. 2021 Sep 2;108(9):1735-1751.
doi: 10.1016/j.ajhg.2021.07.001. Epub 2021 Jul 26.

Massively parallel characterization of CYP2C9 variant enzyme activity and abundance

Affiliations

Massively parallel characterization of CYP2C9 variant enzyme activity and abundance

Clara J Amorosi et al. Am J Hum Genet. .

Abstract

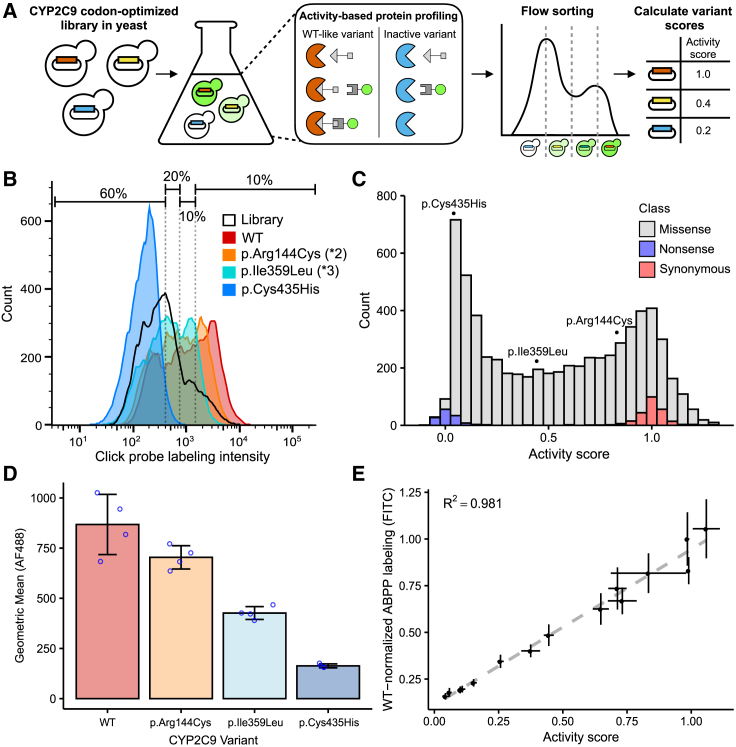
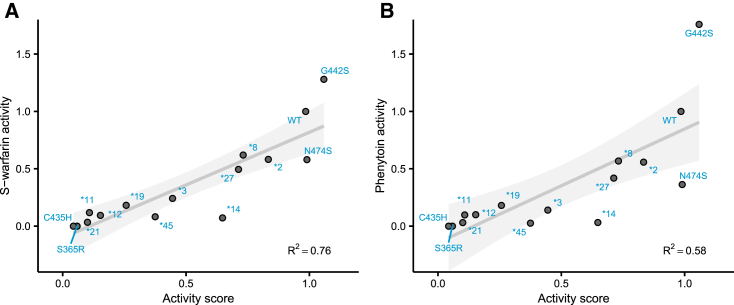
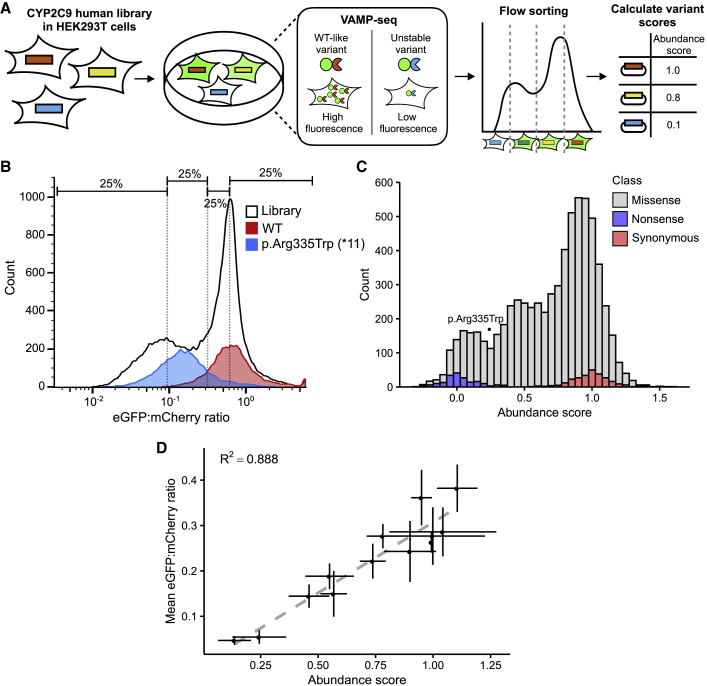
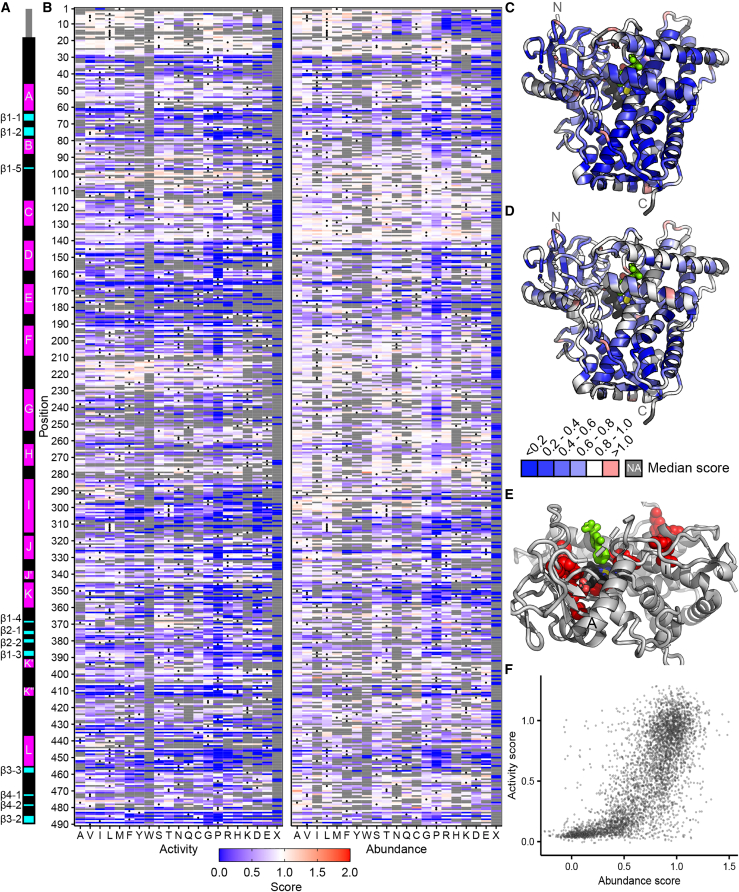
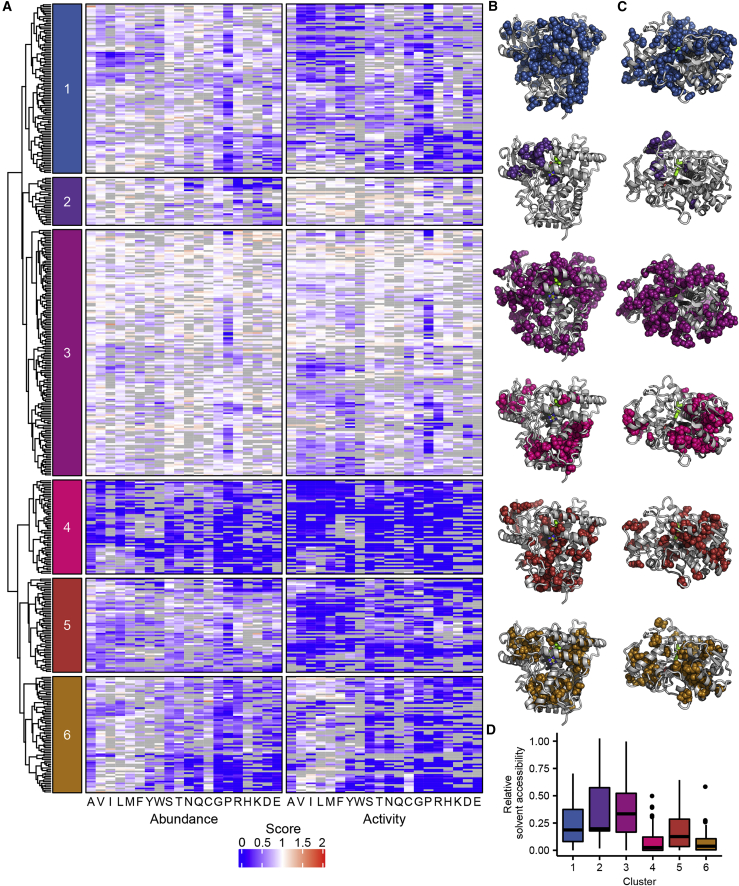
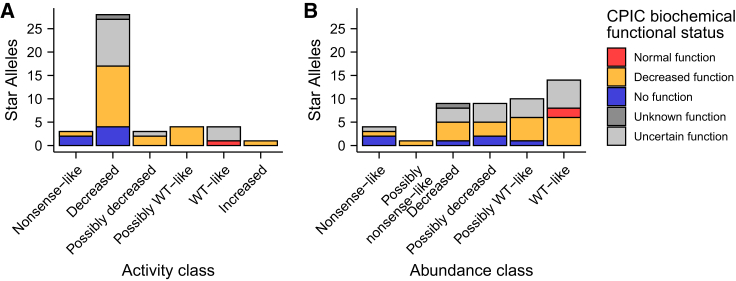
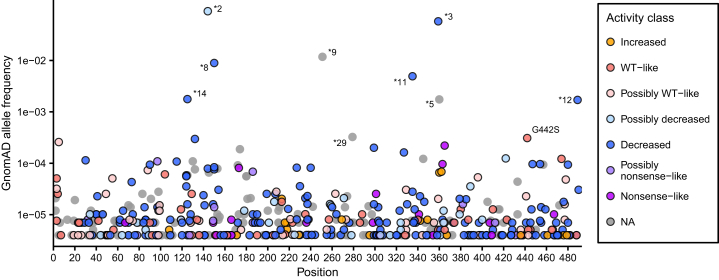
CYP2C9 encodes a cytochrome P450 enzyme responsible for metabolizing up to 15% of small molecule drugs, and CYP2C9 variants can alter the safety and efficacy of these therapeutics. In particular, the anti-coagulant warfarin is prescribed to over 15 million people annually and polymorphisms in CYP2C9 can affect individual drug response and lead to an increased risk of hemorrhage. We developed click-seq, a pooled yeast-based activity assay, to test thousands of variants. Using click-seq, we measured the activity of 6,142 missense variants in yeast. We also measured the steady-state cellular abundance of 6,370 missense variants in a human cell line by using variant abundance by massively parallel sequencing (VAMP-seq). These data revealed that almost two-thirds of CYP2C9 variants showed decreased activity and that protein abundance accounted for half of the variation in CYP2C9 function. We also measured activity scores for 319 previously unannotated human variants, many of which may have clinical relevance.

Keywords: CYP2C9; deep mutational scanning; humanized yeast; pharmacogenomics; warfarin.


Conflict of interest statement

Declaration of interests The authors declare no competing interests.

Figures

Figure 1
Figure 1
Multiplexed measurement of CYP2C9 activity via click-seq (A) A humanized yeast strain is transformed with a library of codon-optimized CYP2C9 variants, labeled with activity-based protein profiling (ABPP), resulting in a range of fluorescence levels, and sorted into four bins via fluorescence-activated cell sorting. Bins are sequenced for calculation of relative variant activity. (B) Flow cytometry of ABPP-labeled yeast expressing CYP2C9 WT (red), reduced activity variants p.Arg144Cys (2, orange) and p.Ile359Leu (3, turquoise), null variant p.Cys435His (blue), and CYP2C9 variant library (black outline). Smoothed histograms are shown, and each sample represents ~20,000 cells. Note that some cells with low intensity are the result of plasmid loss and thus do not contribute to the downstream sequencing results. Histograms and binning shown are from one replicate and are representative of the other three replicates. (C) Stacked histogram of activity score colored by type of variant. Individual scores of p.Cys435His, p.Ile359Leu (3), and p.Arg144Cys (2) are shown on top. (D) Geometric mean of ABPP-labeled CYP2C9 variants. Individual replicates shown as blue points, and error bars show standard deviation. (E) WT-normalized ABPP labeling (FITC-normalized fluorescence) for 14 CYP2C9 variants, expressed in the humanized yeast strain and labeled separately. Individual variants were labeled with the same ABPP protocol as the pooled assay. Scatterplot and linear regression of activity score (pool score) versus individual variant ABPP labeling (n = 3 replicates). Error bars show standard error for activity scores and standard error for ABPP labeling.
Figure 2
Figure 2
Comparison of CYP2C9 activity scores with gold-standard activity assays on yeast microsomes (A and B) Scatterplots of CYP2C9 activity scores plotted against individually tested CYP2C9 variants. Individual variants were expressed in the humanized yeast strain used in the pooled assay, and yeast microsomes were harvested from these individual strains. In (A), we used LC-MS to determine the rate of S-warfarin 7-hydroxylation. In (B), we used LC-MS to determine the rate of phenytoin 4-hydroxylation. The gray line is the regression line, and the shaded area shows the 95% confidence interval. All activities are shown normalized to wild-type rates. Variants shown are C435H (p.Cys435His), S365R (p.Ser365Arg), 21 (p.Pro30Leu), 11 (p.Arg335Trp), 12 (p.Pro489Ser), 19 (p.Gln454His), 45 (p.Arg132Trp), 3 (p.Ile359Leu), 14 (p.Arg125His), 27 (p.Arg150Leu), 8 (p.Arg150His), 2 (p.Arg144Cys), N474S (p.Asn474Ser), and G442S (p.Gly442Ser).
Figure 3
Figure 3
Multiplexed measurement of CYP2C9 activity via VAMP-seq (A) Using VAMP-seq, we expressed a CYP2C9 library in HEK293T cells such that each variant was expressed as an eGFP fusion, resulting in a range of fluorescence according to variant stability. We then flow sorted cells into bins and sequenced them to determine relative variant abundance. (B) Flow cytometry of CYP2C9 WT (red), destabilizing variant p.Arg335Trp (11, blue), and CYP2C9 eGFP fusion library expressed in HEK293T cells (black outline). Smoothed histograms of eGFP:mCherry ratios are shown. Approximate quartile bins for sorting shown are at the top. (C) Stacked histogram of abundance score colored by type of variant. Abundance score of p.Arg335Trp (11) is shown as a point. (D) Scatterplot and linear regression of individually measured cell eGFP:mCherry ratios for 12 CYP2C9 variants versus VAMP-seq-derived abundance scores for the same variants. Error bars show standard error for abundance scores and standard error for individually determined eGFP:mCherry ratio (n = 2 replicates).
Figure 4
Figure 4
Click-seq activity scores and VAMP-seq abundance scores for CYP2C9 (A) Secondary structure of CYP2C9; alpha helices are shown in magenta, and beta sheets are shown in cyan. Helix and beta sheet names are labeled. (B) Heatmaps of CYP2C9 activity (left) and abundance (right) scores. WT amino acids are denoted with a dot, and missing data are shown in gray. Scores range from nonfunctional (blue) to WT-like (white) to increased (red). (C and D) CYP2C9 structure (PDB: 1R9O) colored by median activity (C) and abundance (D) at each position. Median scores are binned as depicted in the legend, and missing positions are shown in gray. Heme is colored by element (carbon:black, nitrogen:blue, oxygen:red, iron:yellow), and substrate (flurbiprofen) is colored bright green. Median activity scores shown in (C), and median abundance scores shown in (D). (E) Zoomed view of partial CYP2C9 structure. Positions with the lowest 2.5% specific activity scores are shown as red spheres. F and G helices are hidden, A and I helices are labeled, and heme and substrate are colored as in (C) and (D). (F) Scatterplot of CYP2C9 activity and abundance scores from a total of 4,421 missense variants.
Figure 5
Figure 5
Hierarchical clustering of activity and abundance scores and cluster accessibility (A–D) In (A), dendrogram and heatmaps of CYP2C9 activity and abundance score clustered by position. Heatmaps colored as in Figure 4. Only positions that had at least 26 total substitutions were included in this analysis. Colored boxes on the left indicate the six major clusters and correspond to the colors shown in (B), (C), and (D). In (B) and (C), the positions that correspond to each of the six clusters are shown as spheres in the corresponding color on the CYP2C9 crystal structure (PDB: 1R9O). Alternate viewpoint is shown in (C). In (D), relative solvent accessibility of each cluster is shown as a boxplot. Bold black line shows median, box shows 25th and 75th percentile, vertical line shows 1.5 interquartile range above and below percentiles, and outliers are shown as black points.
Figure 6
Figure 6
Comparison of activity and abundance scores with clinical pharmacogenomic recommendations (A and B) Stacked bar plot of number of CYP2C9 star alleles versus activity (A) or abundance (B) class, colored by clinical pharmacogenomic recommendation (CPIC biochemical functional class status). CPIC classes are taken from NSAID clinical functional status recommendations.
Figure 7
Figure 7
Classification of human CYP2C9 variants via activity data Frequency and protein position of CYP2C9 missense variants in human population database gnomAD, colored by click-seq activity class. Allele frequencies were calculated from combined v.2 and v.3 gnomAD allele frequencies. Variants at population frequency greater than 3 × 10−4 are labeled by star allele (if applicable) or amino acid change. Labeled variants are 2 (p.Arg144Cys), 3 (p.Ile359Leu), 5 (p.Asp350Glu), 8 (p.Arg150His), 9 (p.His251Arg), 11 (p.Arg335Trp), 12 (p.Pro489Ser), 14 (p.Arg125His), 29 (p.Pro279Thr), and G442S (p.Gly442Ser). Human variants lacking an activity class are shown in gray.

References

    1. Landrum M.J., Lee J.M., Riley G.R., Jang W., Rubinstein W.S., Church D.M., Maglott D.R. ClinVar: public archive of relationships among sequence variation and human phenotype. Nucleic Acids Res. 2014;42:D980–D985. - PMC - PubMed
    1. Starita L.M., Ahituv N., Dunham M.J., Kitzman J.O., Roth F.P., Seelig G., Shendure J., Fowler D.M. Variant Interpretation: Functional Assays to the Rescue. Am. J. Hum. Genet. 2017;101:315–325. - PMC - PubMed
    1. Sultana J., Cutroneo P., Trifirò G. Clinical and economic burden of adverse drug reactions. J. Pharmacol. Pharmacother. 2013;4(Suppl 1):S73–S77. - PMC - PubMed
    1. Lazarou J., Pomeranz B.H., Corey P.N. Incidence of adverse drug reactions in hospitalized patients: a meta-analysis of prospective studies. JAMA. 1998;279:1200–1205. - PubMed
    1. Budnitz D.S., Pollock D.A., Weidenbach K.N., Mendelsohn A.B., Schroeder T.J., Annest J.L. National surveillance of emergency department visits for outpatient adverse drug events. JAMA. 2006;296:1858–1866. - PubMed

Publication types

MeSH terms