

Frequency drift in MR spectroscopy at 3T
- PMID: 34314848
- PMCID: PMC8456751
- DOI: 10.1016/j.neuroimage.2021.118430
Frequency drift in MR spectroscopy at 3T
Abstract
Purpose: Heating of gradient coils and passive shim components is a common cause of instability in the B0 field, especially when gradient intensive sequences are used. The aim of the study was to set a benchmark for typical drift encountered during MR spectroscopy (MRS) to assess the need for real-time field-frequency locking on MRI scanners by comparing field drift data from a large number of sites.
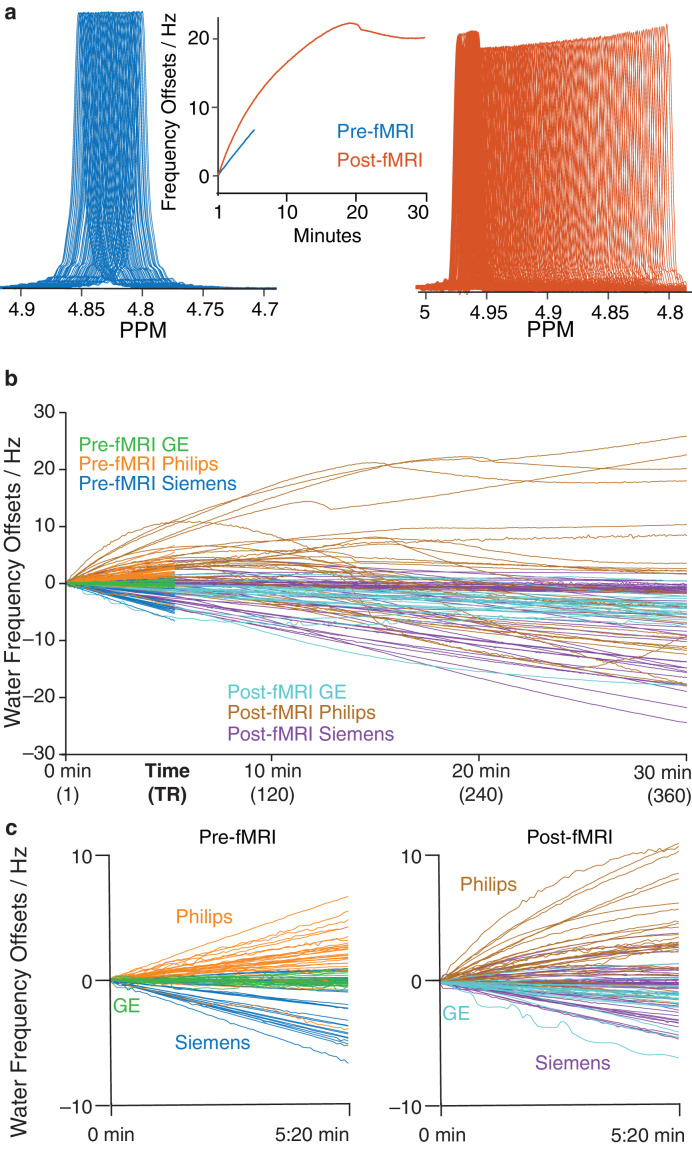
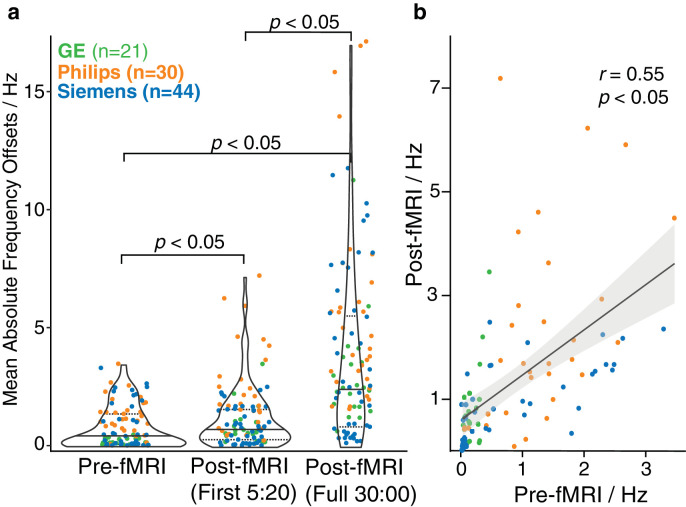
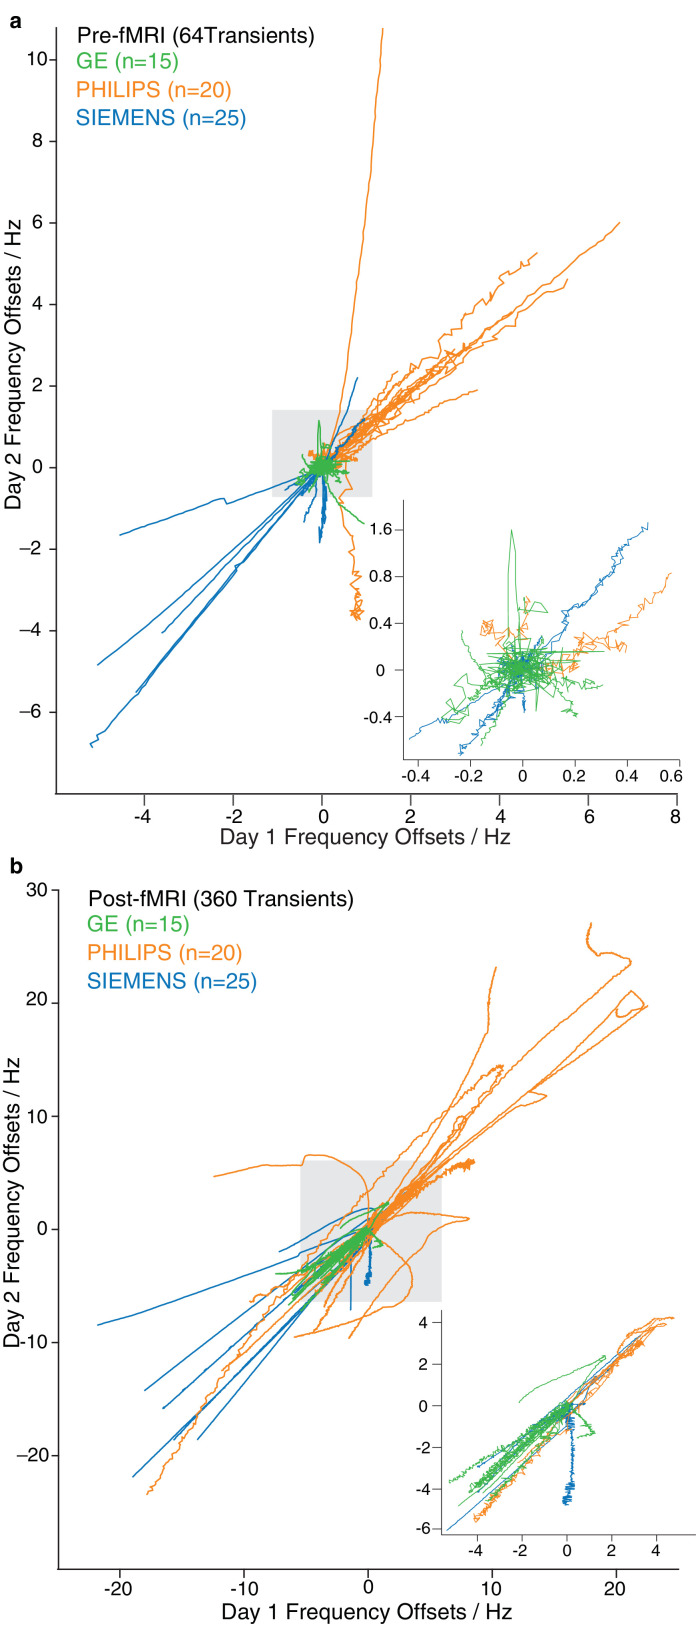
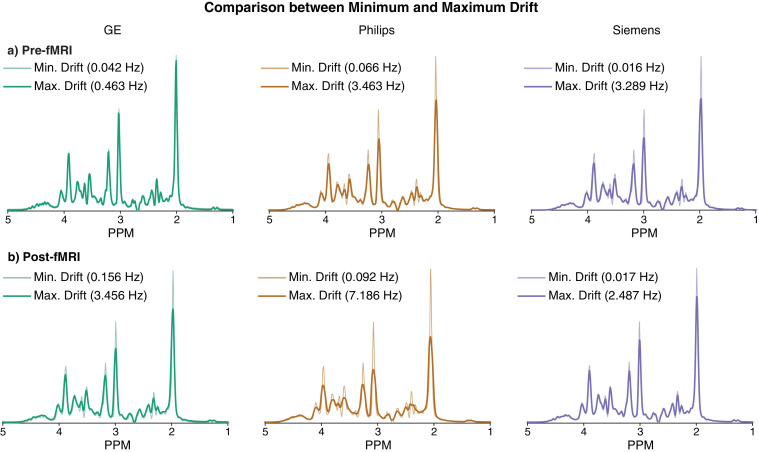
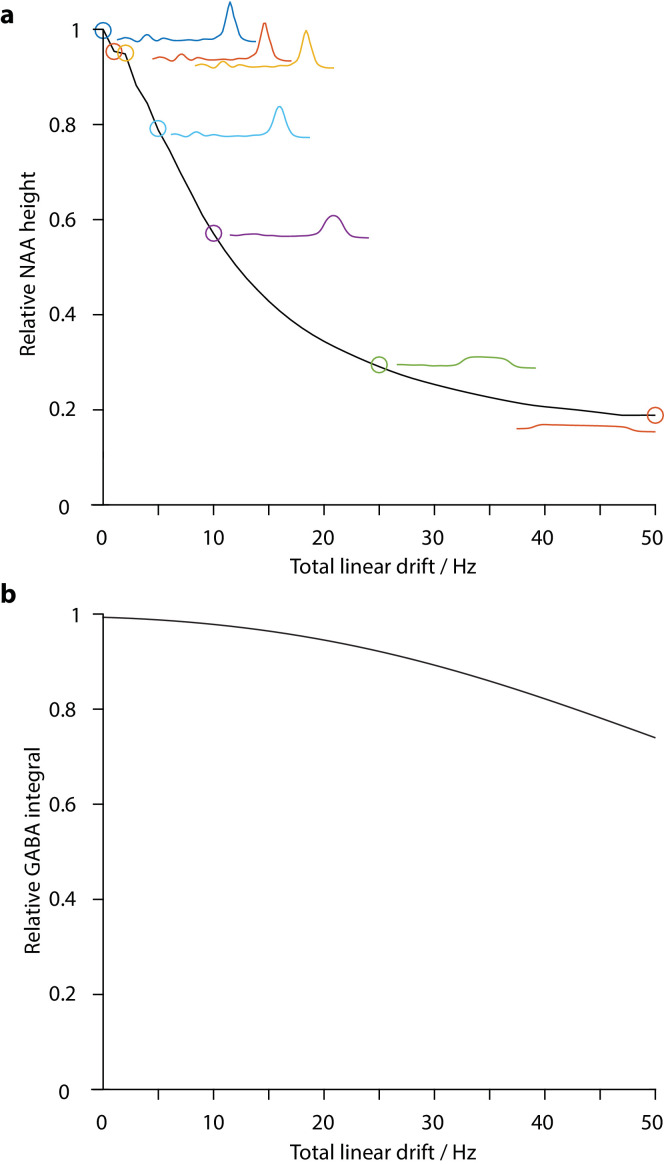
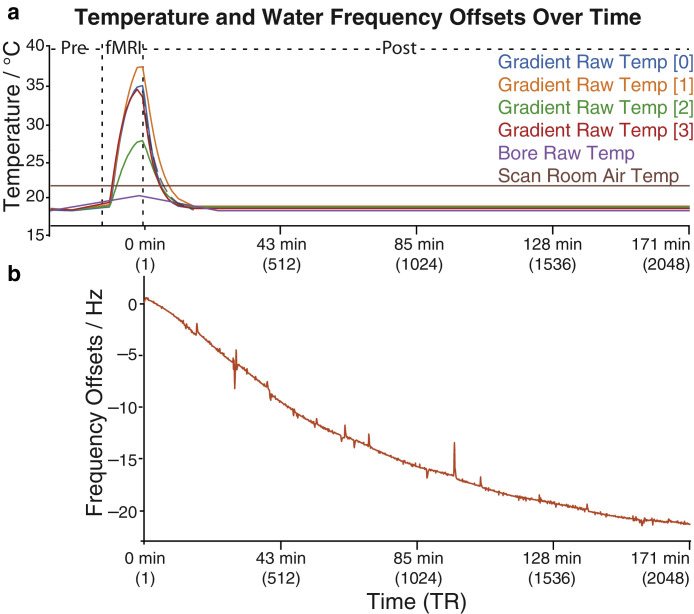
Method: A standardized protocol was developed for 80 participating sites using 99 3T MR scanners from 3 major vendors. Phantom water signals were acquired before and after an EPI sequence. The protocol consisted of: minimal preparatory imaging; a short pre-fMRI PRESS; a ten-minute fMRI acquisition; and a long post-fMRI PRESS acquisition. Both pre- and post-fMRI PRESS were non-water suppressed. Real-time frequency stabilization/adjustment was switched off when appropriate. Sixty scanners repeated the protocol for a second dataset. In addition, a three-hour post-fMRI MRS acquisition was performed at one site to observe change of gradient temperature and drift rate. Spectral analysis was performed using MATLAB. Frequency drift in pre-fMRI PRESS data were compared with the first 5:20 minutes and the full 30:00 minutes of data after fMRI. Median (interquartile range) drifts were measured and showed in violin plot. Paired t-tests were performed to compare frequency drift pre- and post-fMRI. A simulated in vivo spectrum was generated using FID-A to visualize the effect of the observed frequency drifts. The simulated spectrum was convolved with the frequency trace for the most extreme cases. Impacts of frequency drifts on NAA and GABA were also simulated as a function of linear drift. Data from the repeated protocol were compared with the corresponding first dataset using Pearson's and intraclass correlation coefficients (ICC).
Results: Of the data collected from 99 scanners, 4 were excluded due to various reasons. Thus, data from 95 scanners were ultimately analyzed. For the first 5:20 min (64 transients), median (interquartile range) drift was 0.44 (1.29) Hz before fMRI and 0.83 (1.29) Hz after. This increased to 3.15 (4.02) Hz for the full 30 min (360 transients) run. Average drift rates were 0.29 Hz/min before fMRI and 0.43 Hz/min after. Paired t-tests indicated that drift increased after fMRI, as expected (p < 0.05). Simulated spectra convolved with the frequency drift showed that the intensity of the NAA singlet was reduced by up to 26%, 44 % and 18% for GE, Philips and Siemens scanners after fMRI, respectively. ICCs indicated good agreement between datasets acquired on separate days. The single site long acquisition showed drift rate was reduced to 0.03 Hz/min approximately three hours after fMRI.
Discussion: This study analyzed frequency drift data from 95 3T MRI scanners. Median levels of drift were relatively low (5-min average under 1 Hz), but the most extreme cases suffered from higher levels of drift. The extent of drift varied across scanners which both linear and nonlinear drifts were observed.
Keywords: 3T; Frequency drift; Magnetic resonance spectroscopy (MRS); Multi-site; Multi-vendor; Press.
Copyright © 2021. Published by Elsevier Inc.
Conflict of interest statement
Declaration of Competing Interest Jack J. Miller would like to acknowledge the support of a Novo Nordisk Research Fellowship run in conjunction with the University of Oxford. Francisco Reyes-Madrigal has served as a speaker for Janssen (Johnson & Johnson) and AstraZeneca. Marc Thioux and Pim van Dijk were supported by The Netherlands Organization for Health Research and Development (ZonMW) and the Dorhout Mees Foundation. All other authors have no conflict of interest to declare.
Figures
References
-
- R Core Team . R Foundation for Statistical Computing; Vienna, Austria: 2020. R: A Language and Environment for Statistical Computing.
-
- Ebel A., Maudsley A.A. Detection and correction of frequency instabilities for volumetric 1H echo-planar spectroscopic imaging. Magn. Reson. Med. 2005;53:465–469. - PubMed
-
- Edden R.A., Barker P.B. Spatial effects in the detection of gamma-aminobutyric acid: improved sensitivity at high fields using inner volume saturation. Magn. Reson. Med. 2007;58:1276–1282. - PubMed
Publication types
MeSH terms
Grants and funding
- P41 EB031771/EB/NIBIB NIH HHS/United States
- R00 AG062230/AG/NIA NIH HHS/United States
- K01 AA025306/AA/NIAAA NIH HHS/United States
- R01 EB023963/EB/NIBIB NIH HHS/United States
- P50 HD105354/HD/NICHD NIH HHS/United States
- K99 EB028828/EB/NIBIB NIH HHS/United States
- R01 AA025365/AA/NIAAA NIH HHS/United States
- K99 AG062230/AG/NIA NIH HHS/United States
- S10 OD021726/OD/NIH HHS/United States
- R01 DA054275/DA/NIDA NIH HHS/United States
- P41 EB015909/EB/NIBIB NIH HHS/United States
- S10 OD021648/OD/NIH HHS/United States
- S10 OD012336/OD/NIH HHS/United States
- R01 DC008871/DC/NIDCD NIH HHS/United States
- P30 AG066519/AG/NIA NIH HHS/United States
- K99 DA051315/DA/NIDA NIH HHS/United States
- R21 AG060245/AG/NIA NIH HHS/United States
- R01 MH110270/MH/NIMH NIH HHS/United States
- R01 EB016089/EB/NIBIB NIH HHS/United States
LinkOut - more resources
Full Text Sources
Medical
