. 2021 Jul 27;21(1):116.
doi: 10.1186/s12880-021-00649-6.

Extracellular volume-guided late gadolinium enhancement analysis for non-ischemic cardiomyopathy: The Women's Interagency HIV Study

Affiliations

Extracellular volume-guided late gadolinium enhancement analysis for non-ischemic cardiomyopathy: The Women's Interagency HIV Study

Yoko Kato et al. BMC Med Imaging. .

Abstract

Background: Quantification of non-ischemic myocardial scar remains a challenge due to the patchy diffuse nature of fibrosis. Extracellular volume (ECV) to guide late gadolinium enhancement (LGE) analysis may achieve a robust scar assessment.

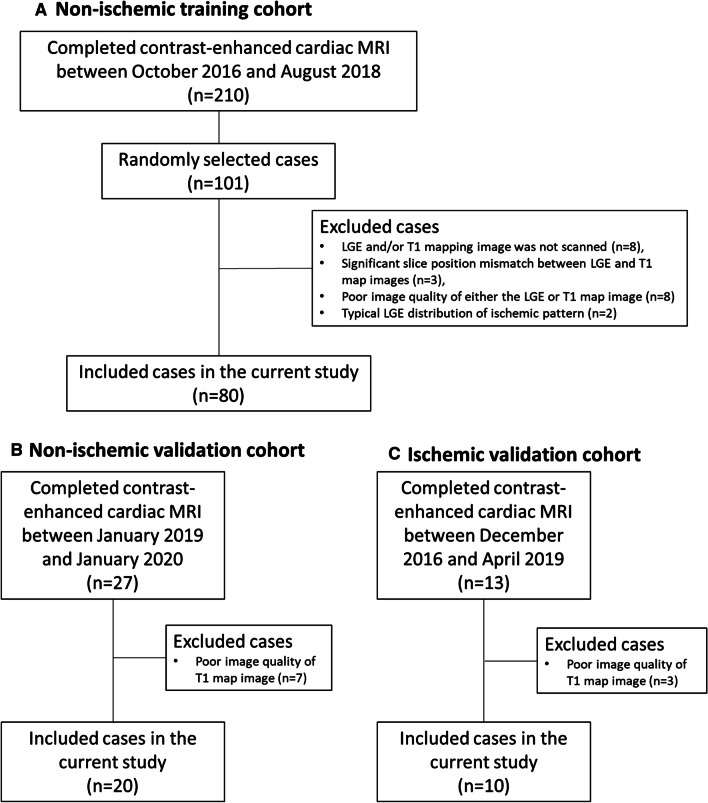
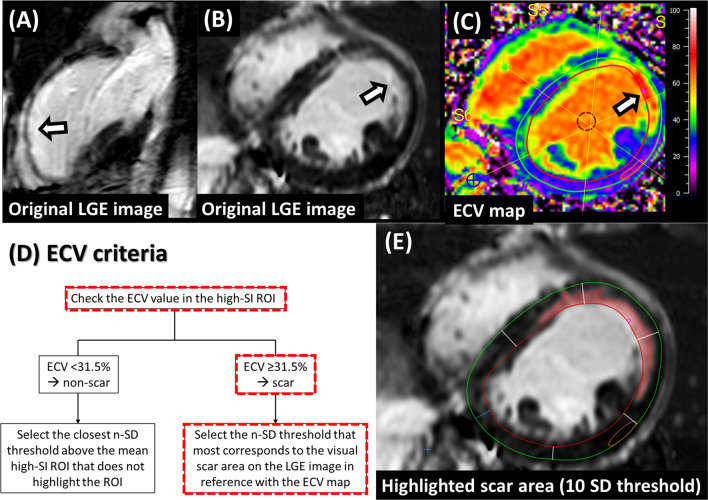
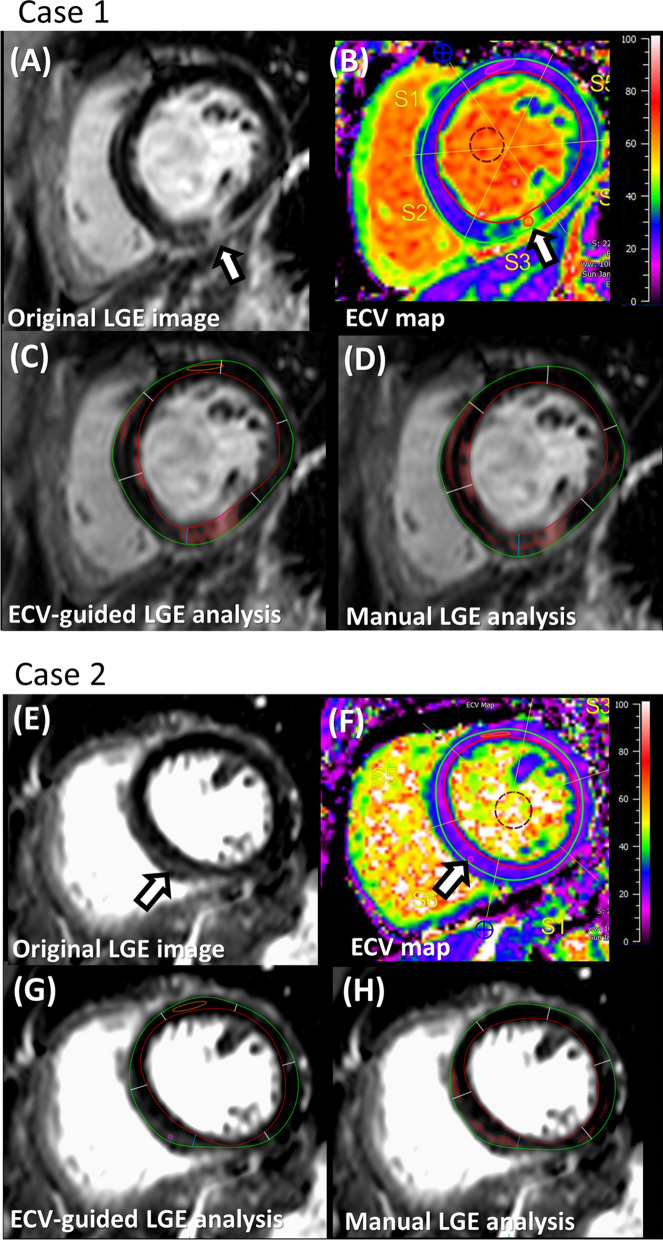
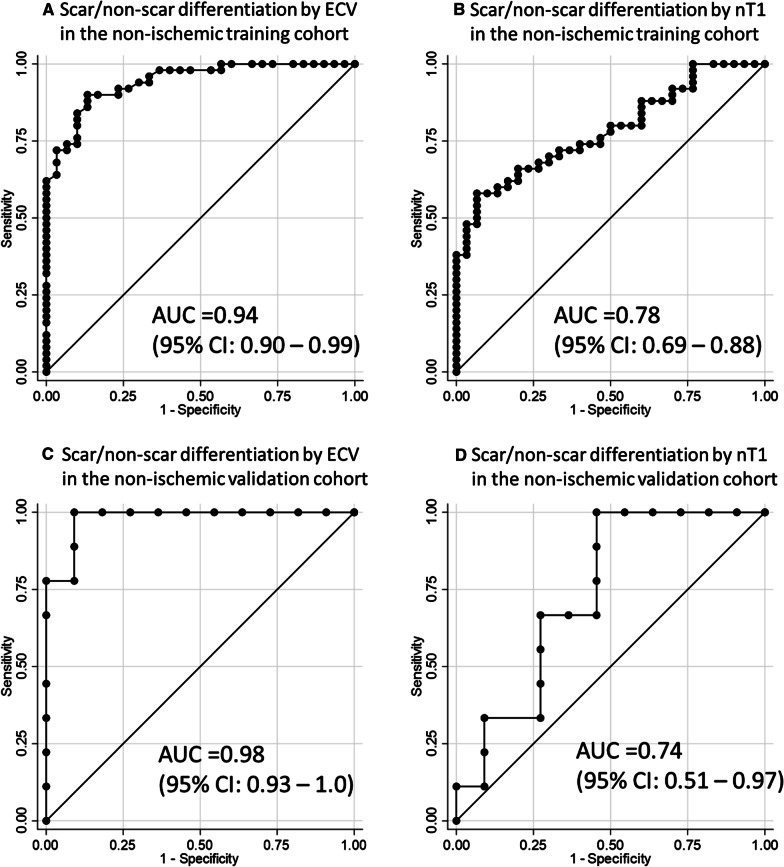
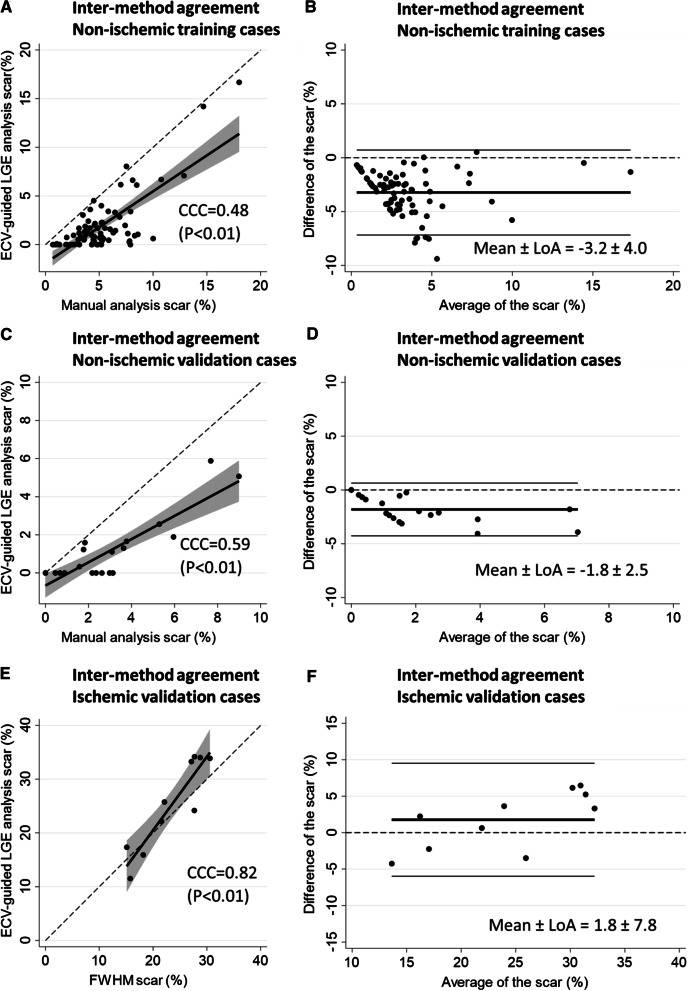
Methods: Three cohorts of 80 non-ischemic-training, 20 non-ischemic-validation, and 10 ischemic-validation were prospectively enrolled and underwent 3.0 Tesla cardiac MRI. An ECV cutoff to differentiate LGE scar from non-scar was identified in the training cohort from the receiver-operating characteristic curve analysis, by comparing the ECV value against the visually-determined presence/absence of the LGE scar at the highest signal intensity (SI) area of the mid-left ventricle (LV) LGE. Based on the ECV cutoff, an LGE semi-automatic threshold of n-times of standard-deviation (n-SD) above the remote-myocardium SI was optimized in the individual cases ensuring correspondence between LGE and ECV images. The inter-method agreement of scar amount in comparison with manual (for non-ischemic) or full-width half-maximum (FWHM, for ischemic) was assessed. Intra- and inter-observer reproducibility were investigated in a randomly chosen subset of 40 non-ischemic and 10 ischemic cases.

Results: The non-ischemic groups were all female with the HIV positive rate of 73.8% (training) and 80% (validation). The ischemic group was all male with reduced LV function. An ECV cutoff of 31.5% achieved optimum performance (sensitivity: 90%, specificity: 86.7% in training; sensitivity: 100%, specificity: 81.8% in validation dataset). The identified n-SD threshold varied widely (range 3 SD-18 SD), and was independent of scar amount (β = -0.01, p = 0.92). In the non-ischemic cohorts, results suggested that the manual LGE assessment overestimated scar (%) in comparison to ECV-guided analysis [training: 4.5 (3.2-6.4) vs. 0.92 (0.1-2.1); validation: 2.5 (1.2-3.7) vs. 0.2 (0-1.6); P < 0.01 for both]. Intra- and inter-observer analyses of global scar (%) showed higher reproducibility in ECV-guided than manual analysis with CCC = 0.94 and 0.78 versus CCC = 0.86 and 0.73, respectively (P < 0.01 for all). In ischemic validation, the ECV-guided LGE analysis showed a comparable scar amount and reproducibility with the FWHM.

Conclusions: ECV-guided LGE analysis is a robust scar quantification method for a non-ischemic cohort. Trial registration ClinicalTrials.gov; NCT00000797, retrospectively-registered 2 November 1999; NCT02501811, registered 15 July 2015.

Keywords: ECV-guided LGE analysis; Extracellular volume fraction (ECV); Human immunodeficiency virus (HIV); Late gadolinium enhancement (LGE); Magnetic resonance imaging (MRI); Non-ischemic LGE; Scar quantification.


Conflict of interest statement

The authors declare that they have no competing interests.

Figures

Fig. 1
Fig. 1
Study flowcharts. A Non-ischemic training cohort. B Non-ischemic validation cohort. C Ischemic validation cohort. A Of the 210 participants that completed contrast-enhanced cardiac MRI between October 2016 and August 2018, a sub-sample of 101 women was randomly selected for the present study. Twenty-one of them were excluded from image analysis due to the reasons listed in the flowchart. Overall 80 participants were included in the non-ischemic training cohort. B Of the continuous 27 contrast-enhanced cardiac MRI between January 2019 and January 2020, seven of them were excluded from the image analysis due to the image quality issue. Overall 20 cases were included in the non-ischemic validation cohort. C Of the continuous 13 contrast-enhanced cardiac MRI between December 2016 and April 2020, three of them were excluded from the image analysis due to the image quality issue. Overall 10 cases were included in the ischemic validation cohort. MRI magnetic resonance imaging
Fig. 2
Fig. 2
A representative case of ECV-guided LGE analysis. A Original LGE image at the 2-chamber view. B Original LGE image at the mid-LV slice. C ECV map. D ECV criteria flowchart. E LGE image at the mid-LV slice with highlighted scar area. A high SI was observed in the anterior wall (A, B, arrows). The ECV value at the corresponding location was 69.3%, which was higher than 31.5% (C, arrow). Based on the ECV criteria flowchart, the high SI area was judged as scar (D, red dotted line boxes). Then, the optimal n-SD threshold was selected on the LGE image in reference with the ECV map. In this case, the optimal threshold was 10SD (E). The selected threshold was propagated to other slices on the LGE image. ECV extracellular volume, LGE late gadolinium enhancement, SI signal intensity, ROI region of interest, SD standard deviation, LV left ventricle, RV right ventricle
Fig. 3
Fig. 3
Representative cases presented with or without scar on ECV-guided LGE analysis. AD Case 1, which presented with scar on ECV-guided LGE analysis. A, Original LGE image at the mid-LV slice. B ECV map, C LGE image at the mid-LV slice with highlighted area by the ECV-guided LGE analysis. D LGE image at the mid-LV slice with the manually highlighted area. EH Case 2, which presented without scar on ECV-guided LGE analysis. E Original LGE image at the mid-LV slice. F ECV map. G LGE image at the mid-LV slice with no highlighted area by the ECV-guided LGE analysis. H LGE image at the mid-LV slice with the manually highlighted area. (Case 1) A high SI was observed in the inferior wall (A, arrow). The ECV value at the corresponding location was 58.3%, which was higher than 31.5% (B, arrow). Based on the ECV criteria , the high SI area was judged as a scar. The optimal threshold of 11SD was selected and highlighted the myocardium (C). The manual analysis also highlighted the corresponding area (D). (Case 2) A high SI was observed in the inferoseptum (E, arrow). The ECV value at the corresponding location was 26.5%, which was lower than 31.5% (F, arrow). Based on the ECV criteria , the high SI area was judged as a non- scar. The optimal threshold of 13SD was chosen which did not highlight the myocardium (G). Meanwhile, the manual analysis highlighted the myocardium (H). ECV extracellular volume, LGE late gadolinium enhancement, LV left ventricle, SI signal intensity, ROI region of interest, SD standard deviation
Fig. 4
Fig. 4
Comparison between the scar differentiation performance of ECV and nT1 in the non-ischemic training cohort and validation cohort. A Scar/non-scar differentiation performance of ECV in the non-ischemic training cohort. B Scar/non-scar differentiation performance of nT1 in the non-ischemic training cohort. C Scar/non-scar differentiation performance of ECV in the non-ischemic validation cohort. D Scar/non-scar differentiation performance of nT1 in the non-ischemic validation cohort. In both cohorts, ECV presented a better performance of scar/non-scar differentiation than nT1. In the training cohort, the derived ECV cutoff of 31.5% achieved sensitivity of 90%, specificity of 86.7%, PPV of 91.8%, and NPV of 83.9% (A) while the derived nT1cutoff of 1317 ms achieved sensitivity of 68%, specificity of 70%, PPV of 79.1%, and NPV of 56.8% (B). In the validation cohort, the ECV cutoff of 31.5% excellently differentiated scar/ non-scar (sensitivity 100%, specificity 81.8%, PPV 81.8%, and NPV 100%) (C) while the nT1 cutoff of 1317 ms presented a fair performance (sensitivity 33.3%, specificity 90.9%, PPV 75%, and NPV 62.5%) (D). ECV extracellular volume, nT1 native T1, AUC area under the curve, CI confidence interval, PPV positive predictive value, NPV negative predictive value
Fig. 5
Fig. 5
Scatter plot graphs and Bland–Altman plots of inter-method agreement of global scar amount (%) between the ECV-guided LGE analysis and the conventional methods in non-ischemic training cases, non-ischemic validation cases, and ischemic validation cases. A Scatter plot graph and B Bland–Altman plot of the inter-method agreement between the ECV-guided LGE analysis and the manual analysis in 80 non-ischemic cases. C Scatter plot graph and D Bland–Altman plot of the inter-method agreement between the ECV-guided LGE analysis and the manual analysis in 20 non-ischemic validation cases. E Scatter plot graph and F Bland–Altman plot of the inter-method agreement between the ECV-guided LGE analysis and the FWHM with manual correction in 10 ischemic validation cases. A moderate inter-method agreement was observed in non-ischemic cases. In ischemic cases, the agreement was excellent. ECV extracellular volume, LGE late gadolinium enhancement, CCC concordance correlation coefficient, LoA limits of agreement, FWHM full-width half-maximum

Similar articles

Cited by

  • HIV, HIV-Specific Factors, and Myocardial Disease in Women.
    Kato Y, Ambale-Venkatesh B, Naveed M, Shitole SG, Peng Q, Levsky JM, Haramati LB, Ordovas K, Noworolski SM, Lee YJ, Kim RS, Lazar JM, Anastos K, Tien PC, Kaplan RC, Lima JAC, Kizer JR. Kato Y, et al. Clin Infect Dis. 2024 Aug 16;79(2):451-461. doi: 10.1093/cid/ciae077. Clin Infect Dis. 2024. PMID: 38356158 Free PMC article.

References

    1. Chan RH, Maron BJ, Olivotto I, Pencina MJ, Assenza GE, Haas T, et al. Prognostic value of quantitative contrast-enhanced cardiovascular magnetic resonance for the evaluation of sudden death risk in patients with hypertrophic cardiomyopathy. Circulation. 2014;130:484–495. doi: 10.1161/CIRCULATIONAHA.113.007094. - DOI - PubMed
    1. Puntmann VO, Carr-White G, Jabbour A, Yu C-Y, Gebker R, Kelle S, et al. T1-mapping and outcome in nonischemic cardiomyopathy. JACC Cardiovasc Imaging. 2016;9:40–50. doi: 10.1016/j.jcmg.2015.12.001. - DOI - PubMed
    1. Youn J-C, Hong YJ, Lee H-J, Han K, Shim CY, Hong G-R, et al. Contrast-enhanced T1 mapping-based extracellular volume fraction independently predicts clinical outcome in patients with non-ischemic dilated cardiomyopathy: a prospective cohort study. Eur Radiol. 2017;27:3924–3933. doi: 10.1007/s00330-017-4817-9. - DOI - PubMed
    1. Mordi I, Jhund PS, Gardner RS, Payne J, Carrick D, Berry C, et al. LGE and NT-proBNP identify low risk of death or arrhythmic events in patients with primary prevention ICDs. JACC Cardiovasc Imaging. 2014;7:561–569. doi: 10.1016/j.jcmg.2013.12.014. - DOI - PubMed
    1. Gräni C, Eichhorn C, Bière L, Kaneko K, Murthy VL, Agarwal V, et al. Comparison of myocardial fibrosis quantification methods by cardiovascular magnetic resonance imaging for risk stratification of patients with suspected myocarditis. J Cardiovasc Magn Reson. 2019;21:1–11. doi: 10.1186/s12968-019-0520-0. - DOI - PMC - PubMed

Publication types

Associated data