. 2021 Oct;100(4):319-334.
doi: 10.1124/molpharm.121.000270. Epub 2021 Jul 27.

Acylation of the Incretin Peptide Exendin-4 Directly Impacts Glucagon-Like Peptide-1 Receptor Signaling and Trafficking

Affiliations

Acylation of the Incretin Peptide Exendin-4 Directly Impacts Glucagon-Like Peptide-1 Receptor Signaling and Trafficking

Maria Lucey et al. Mol Pharmacol. 2021 Oct.

Abstract

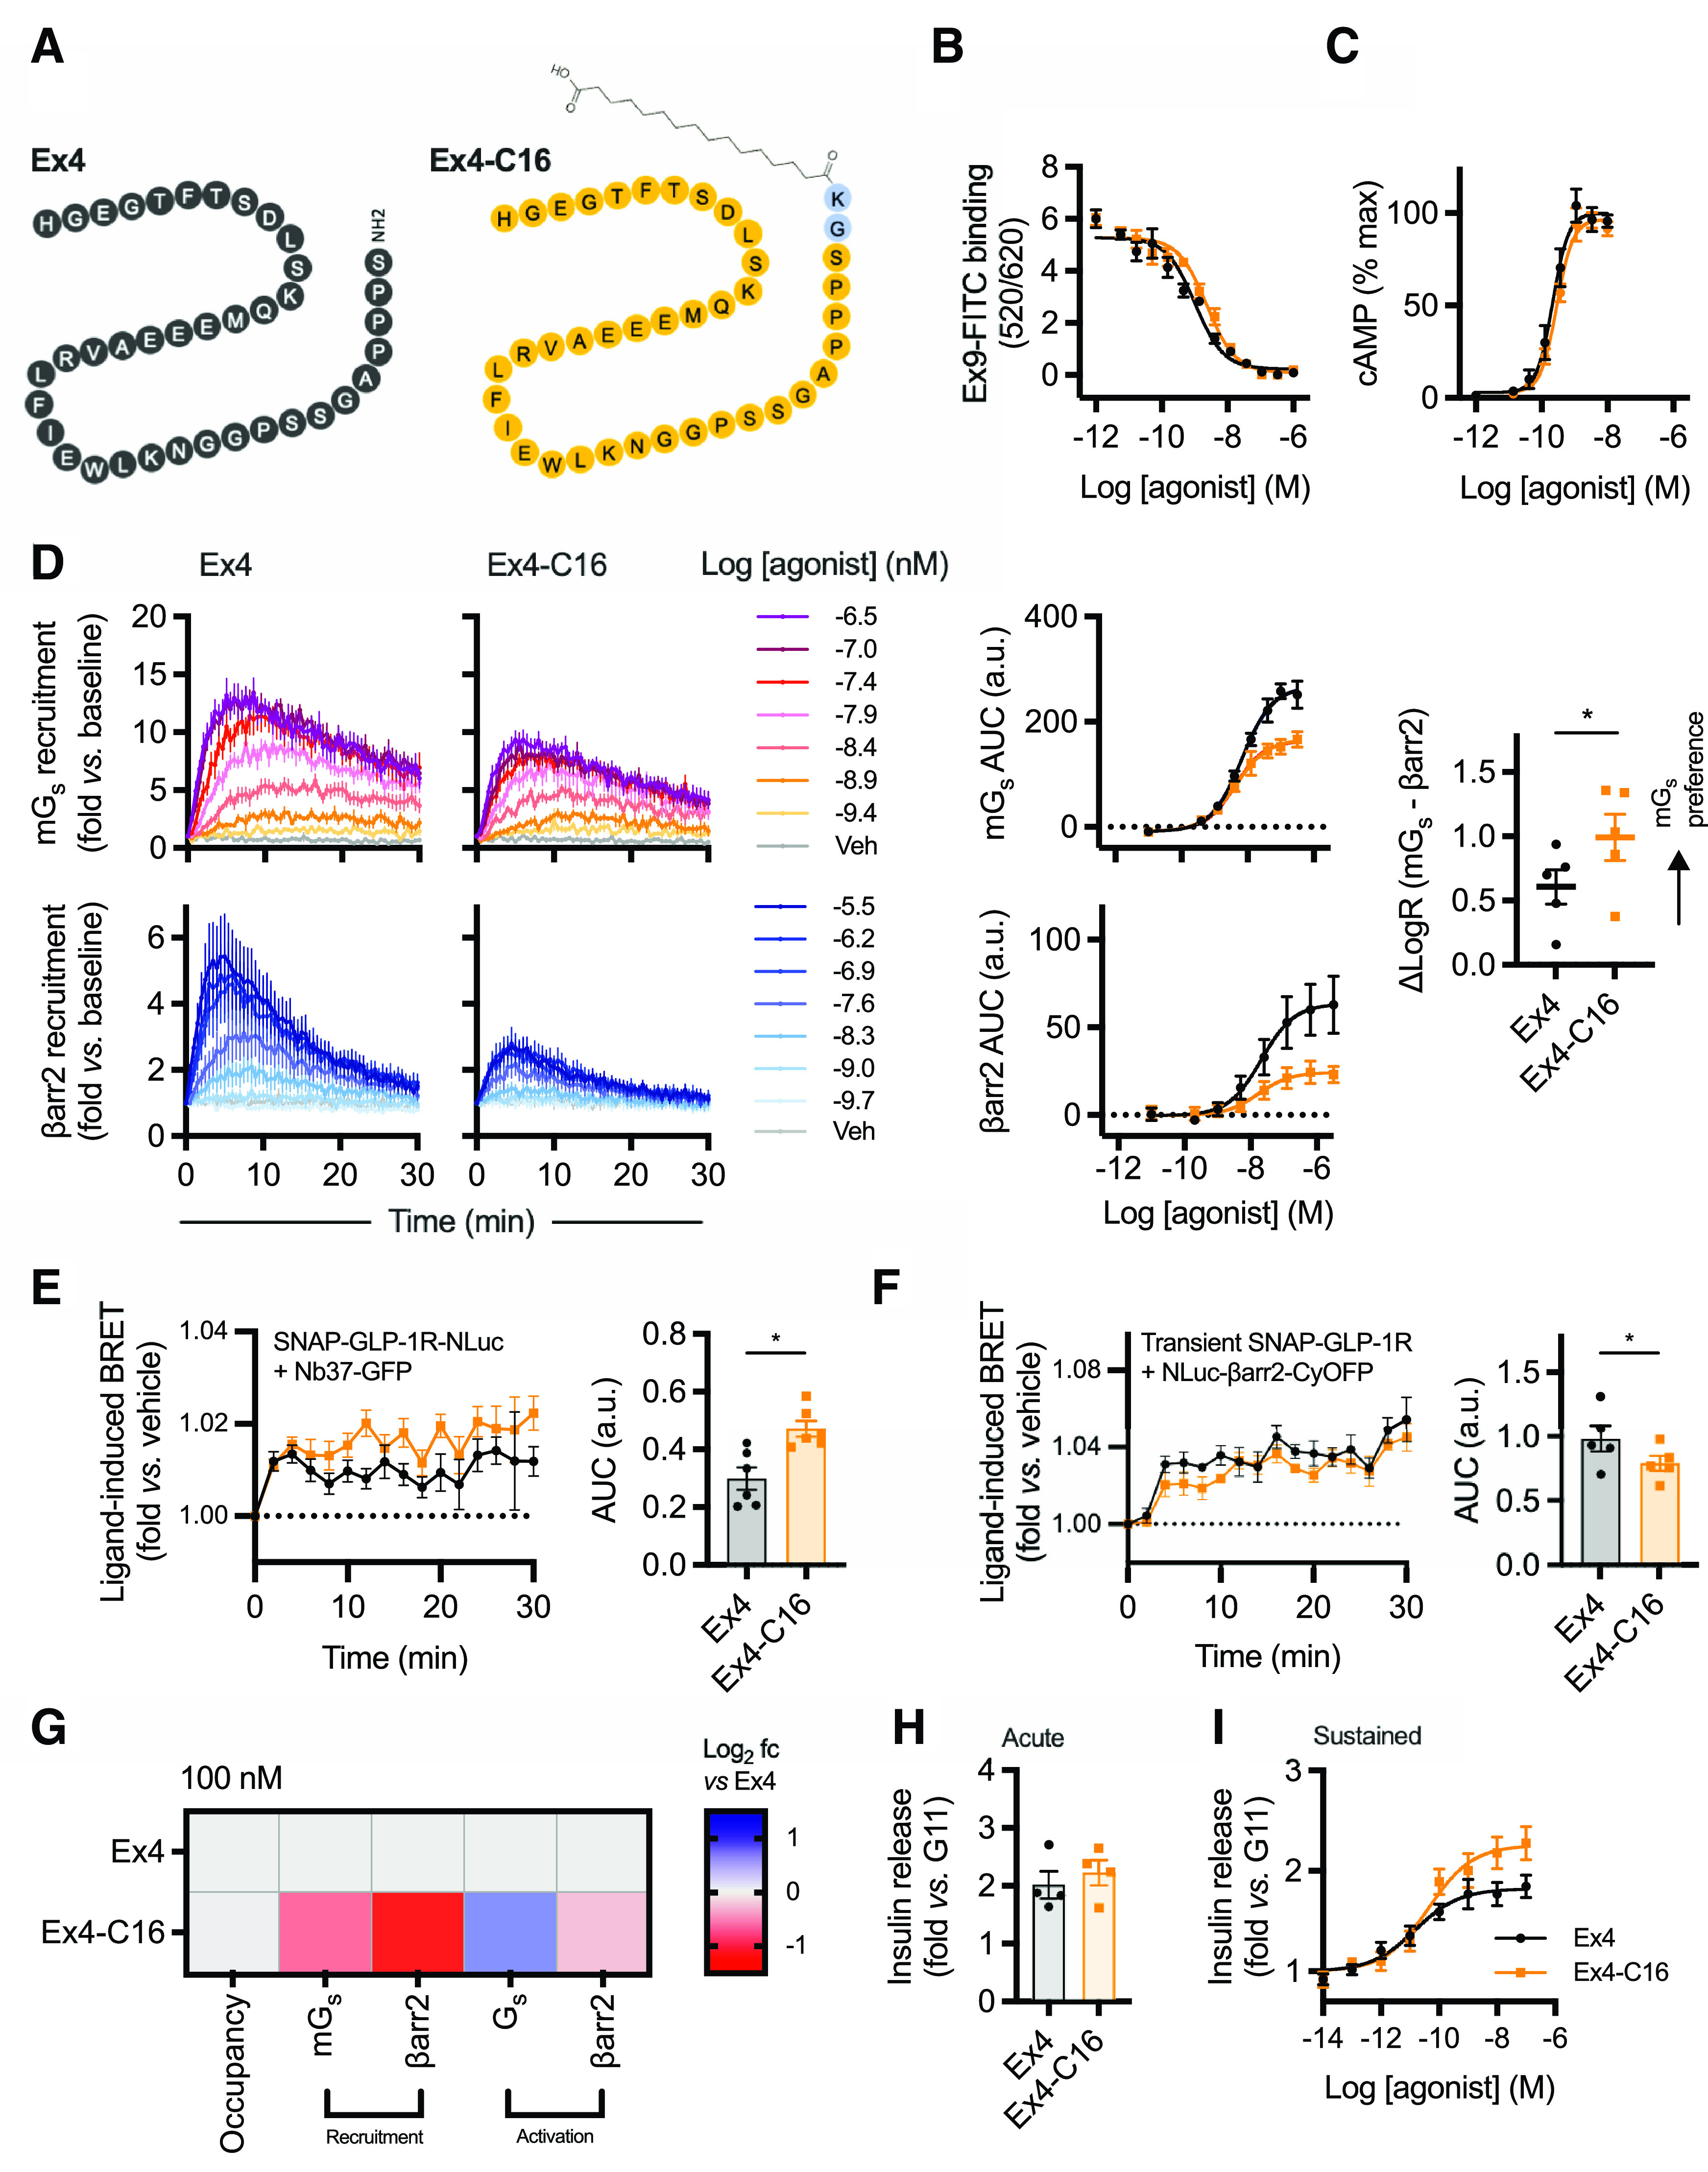
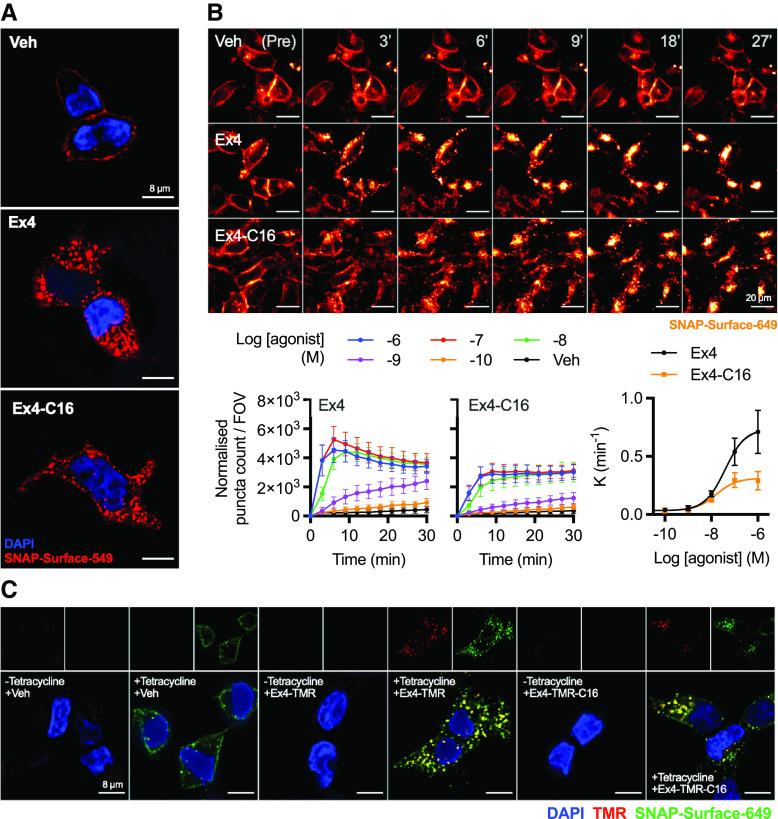
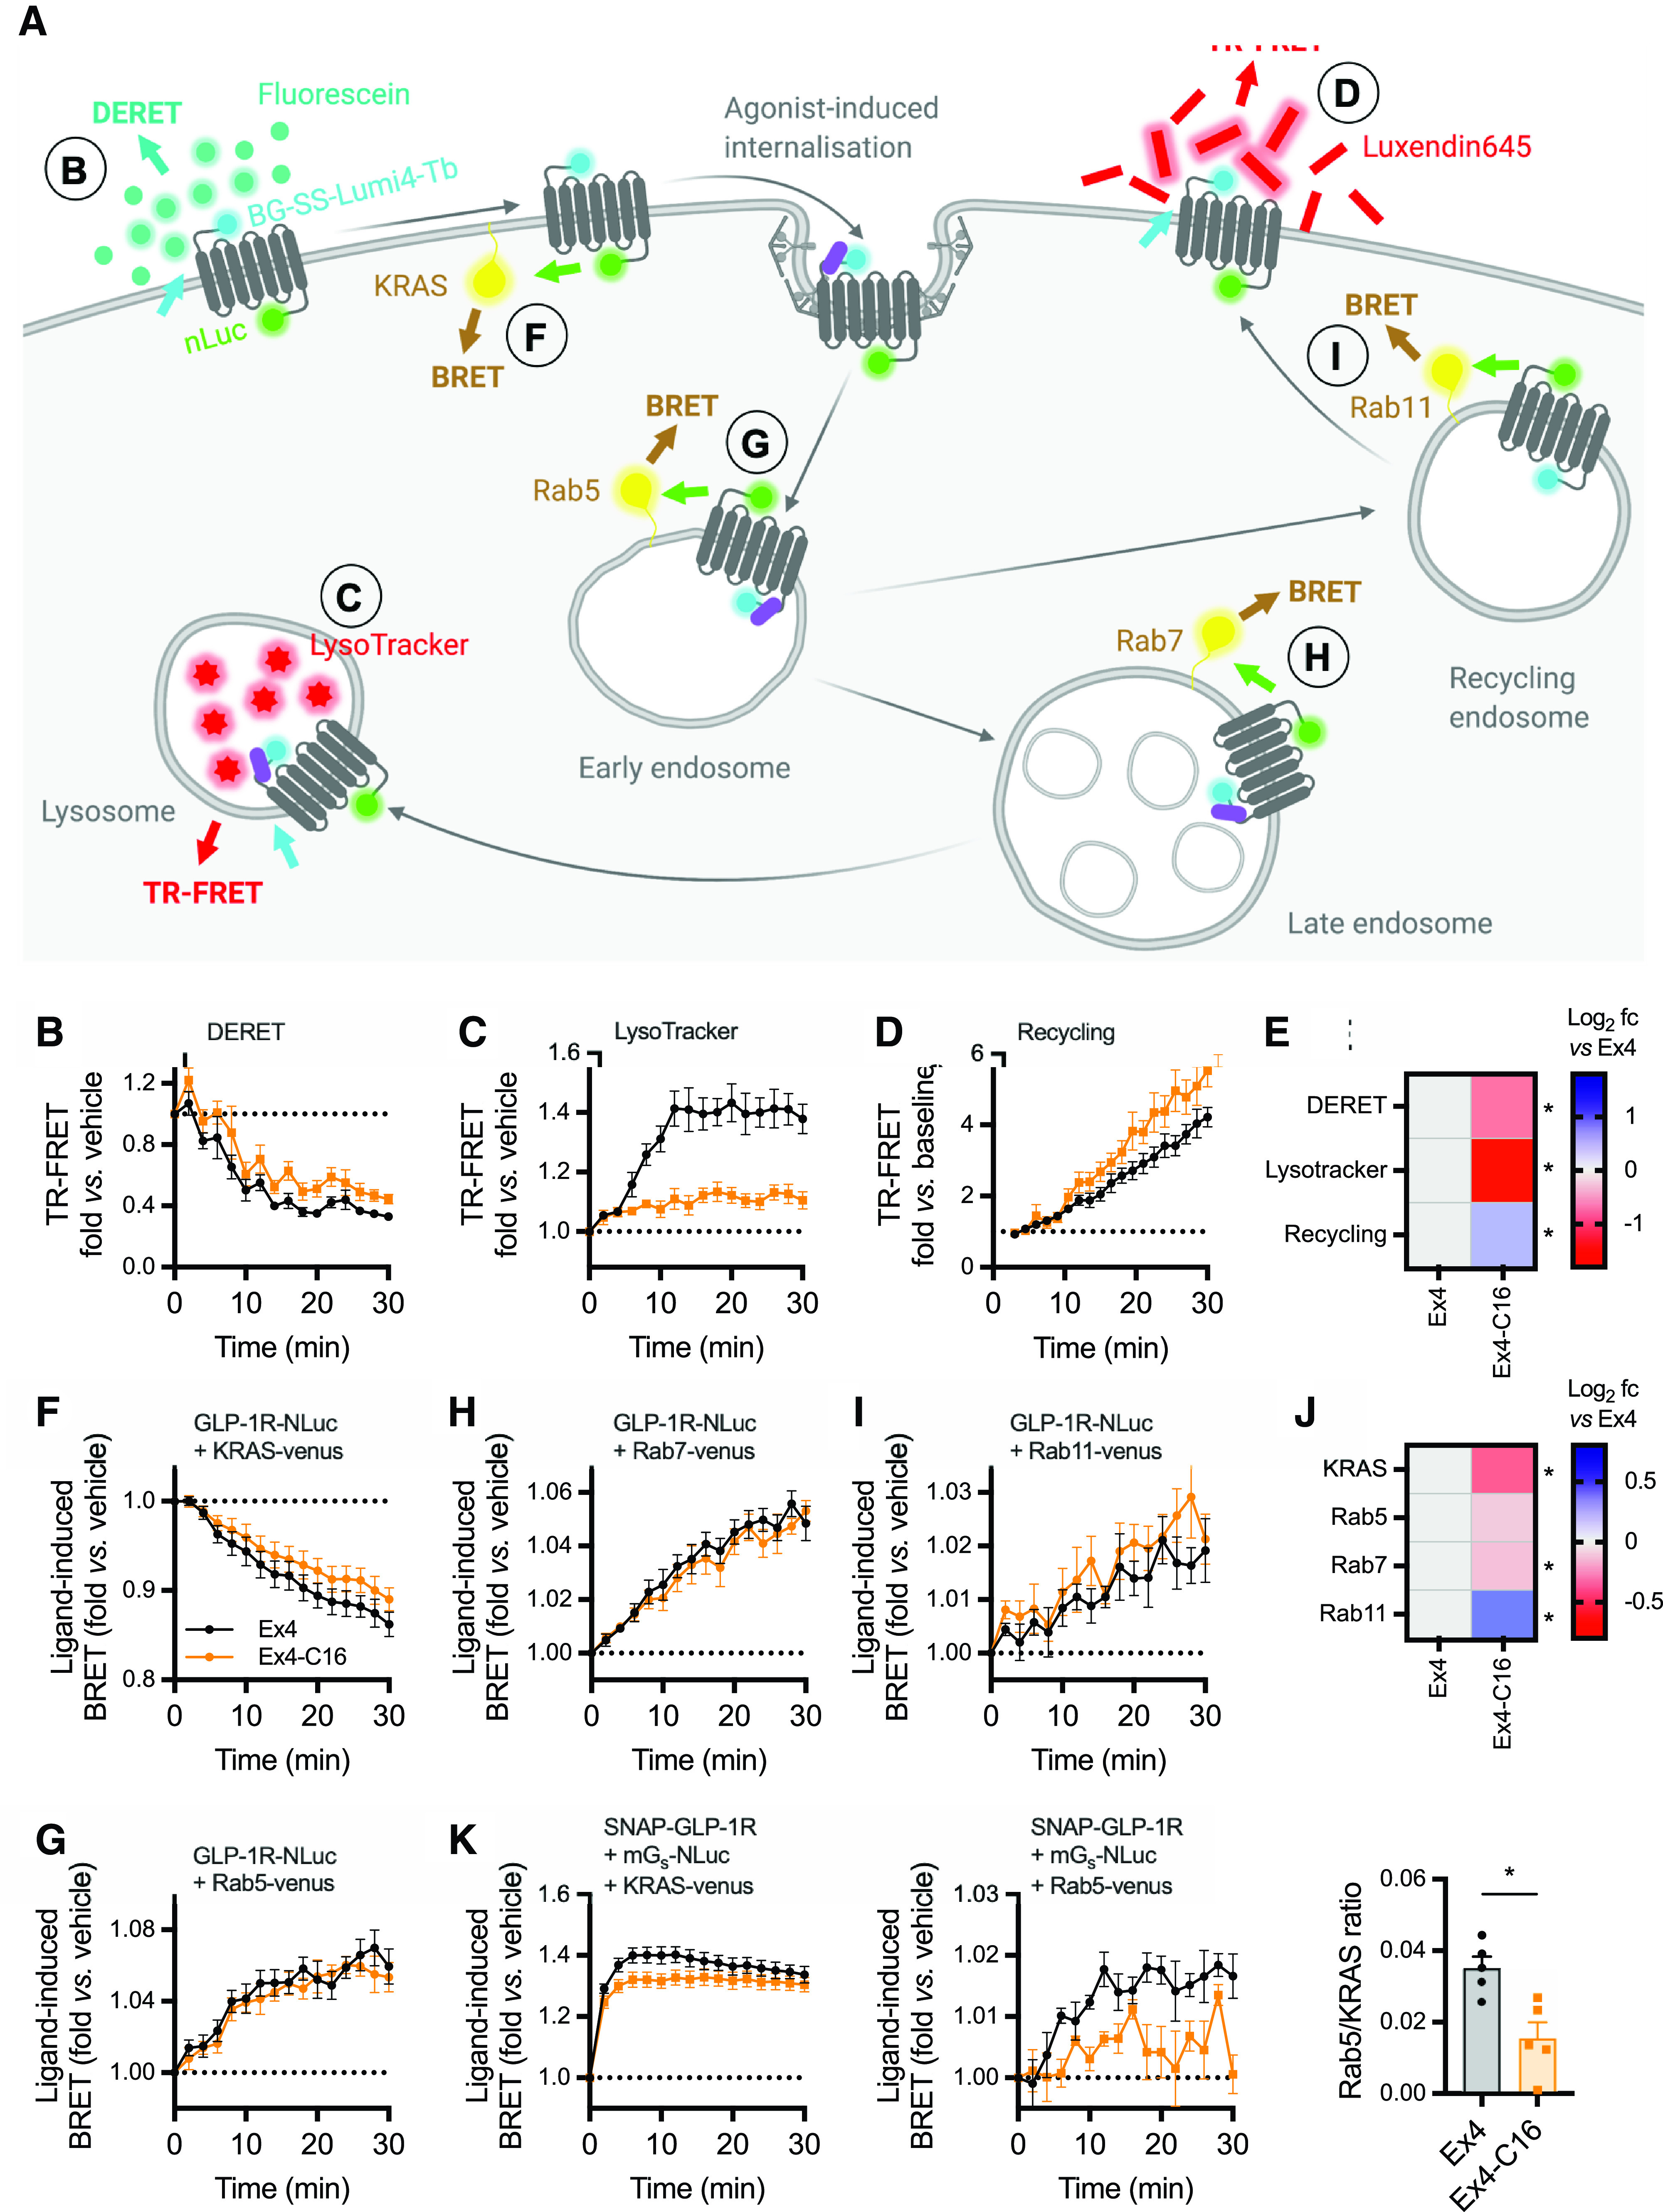
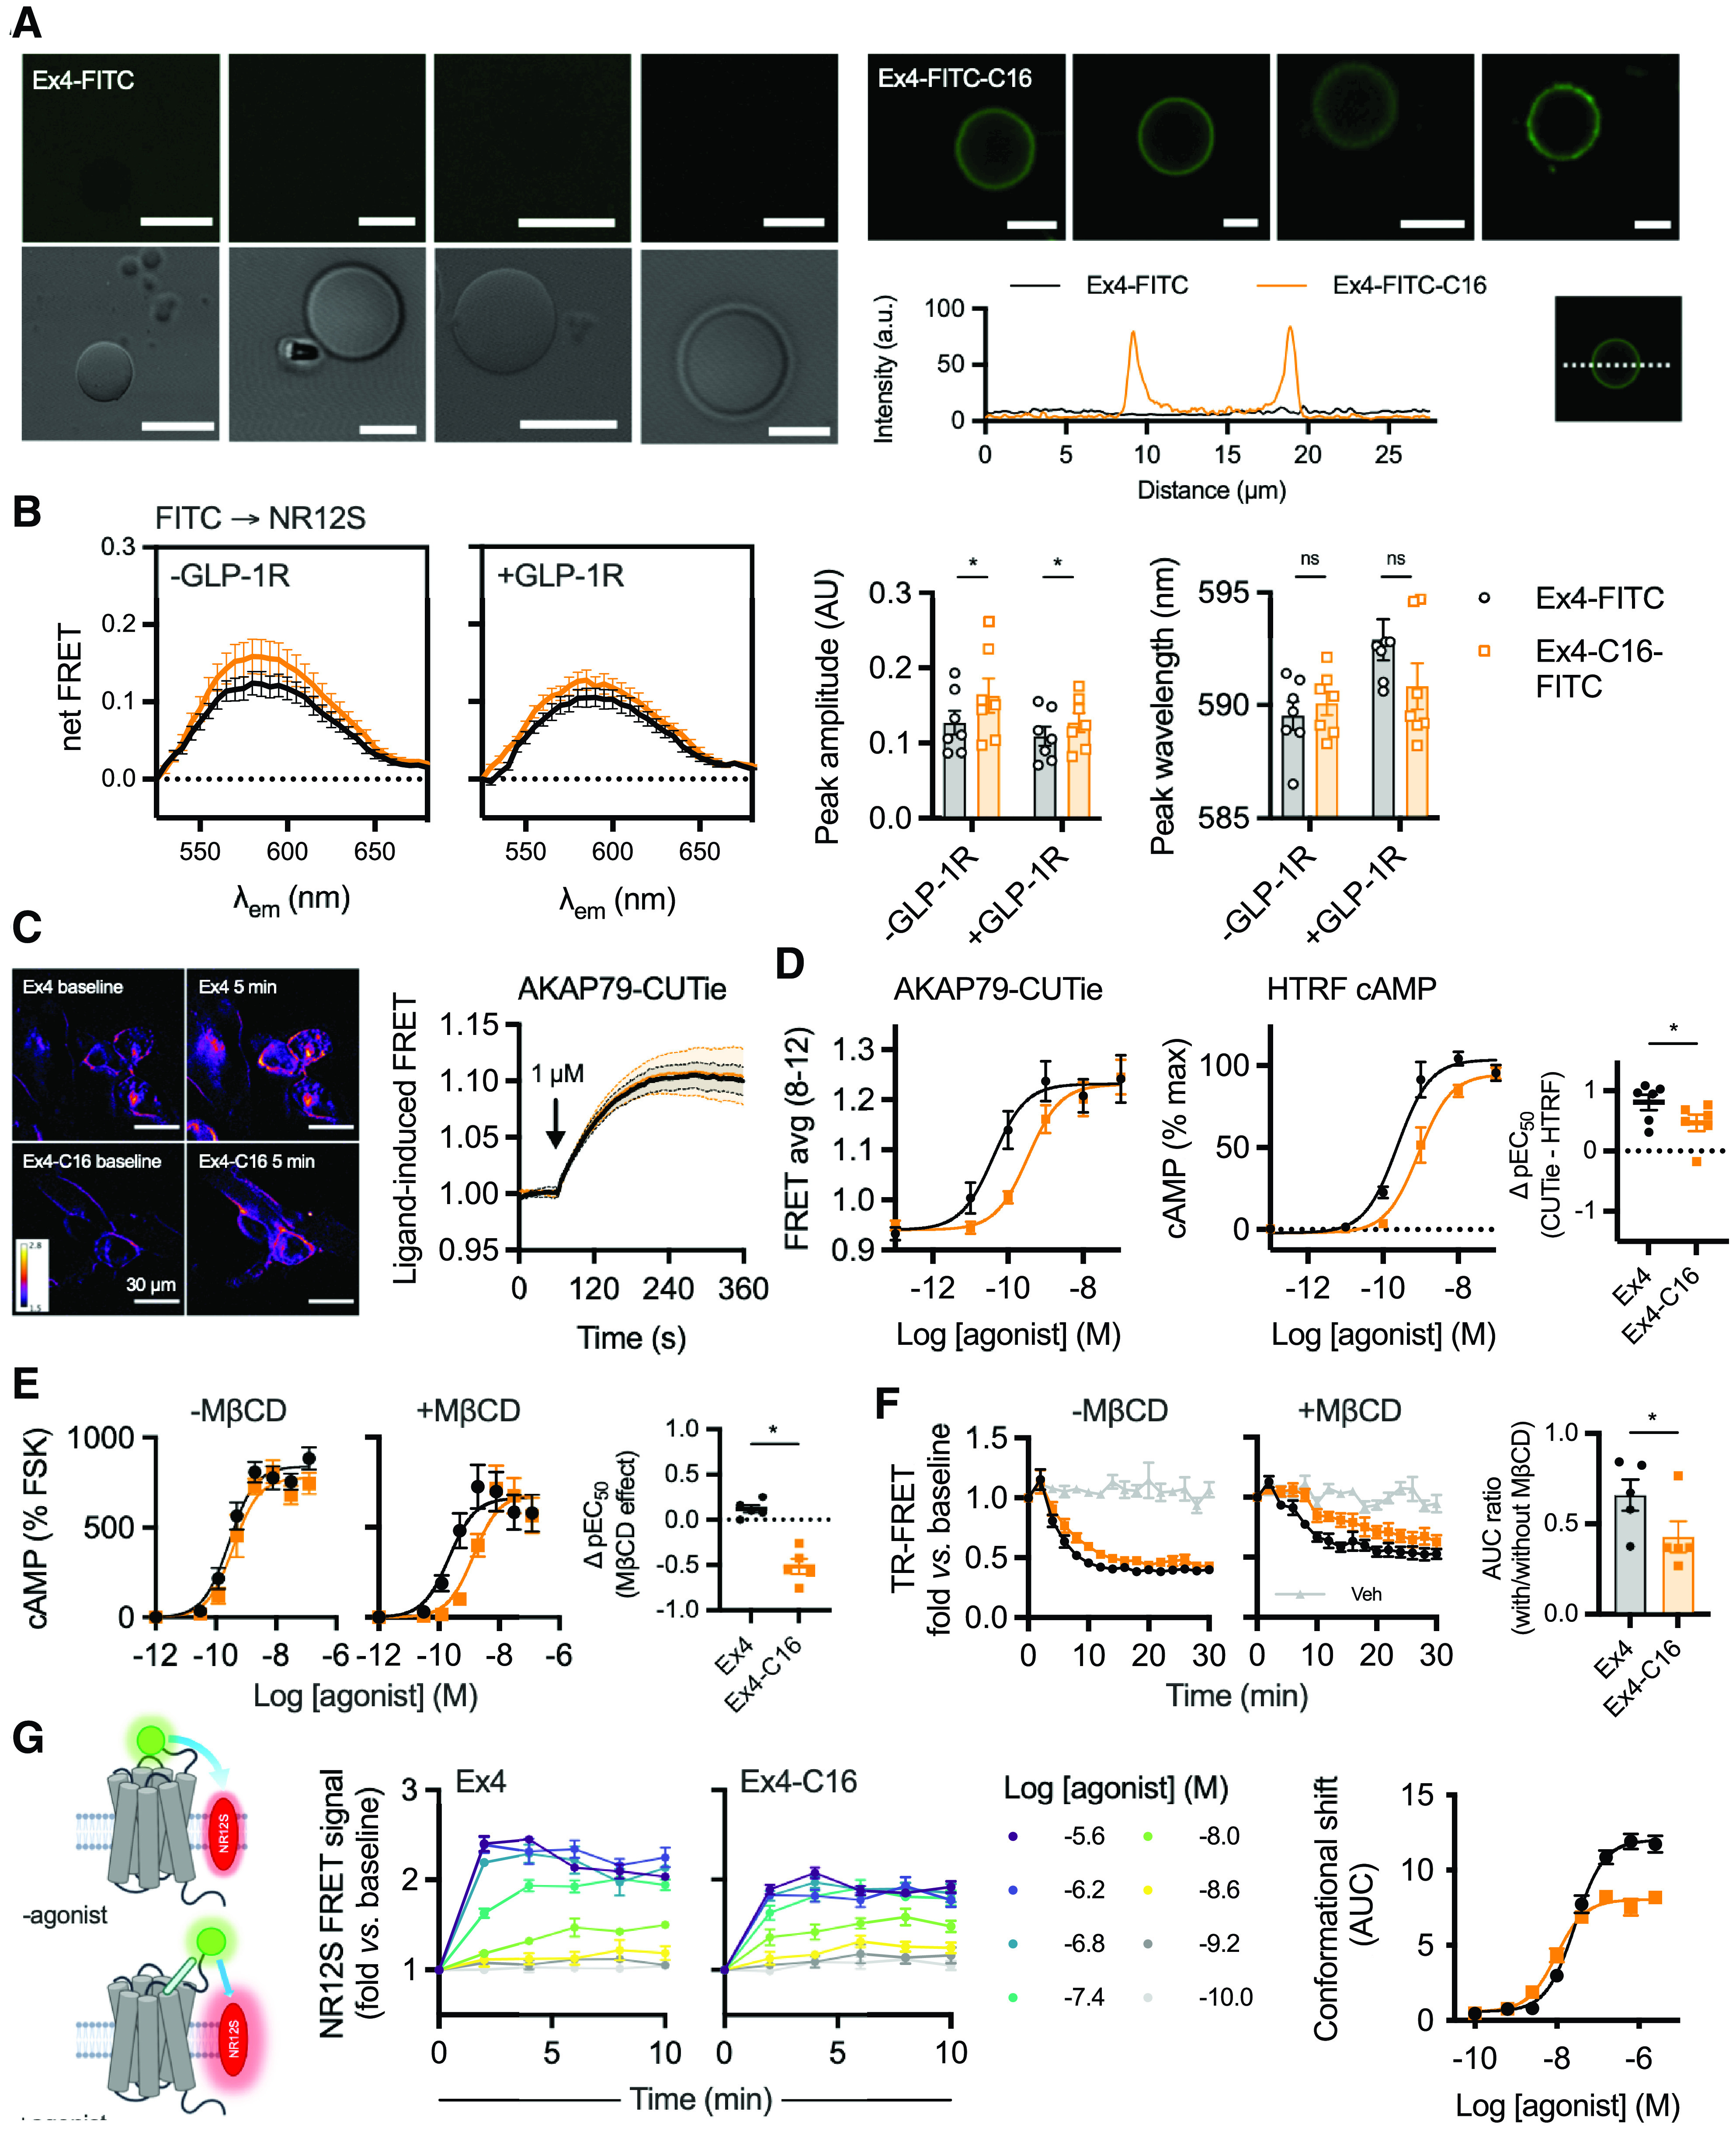
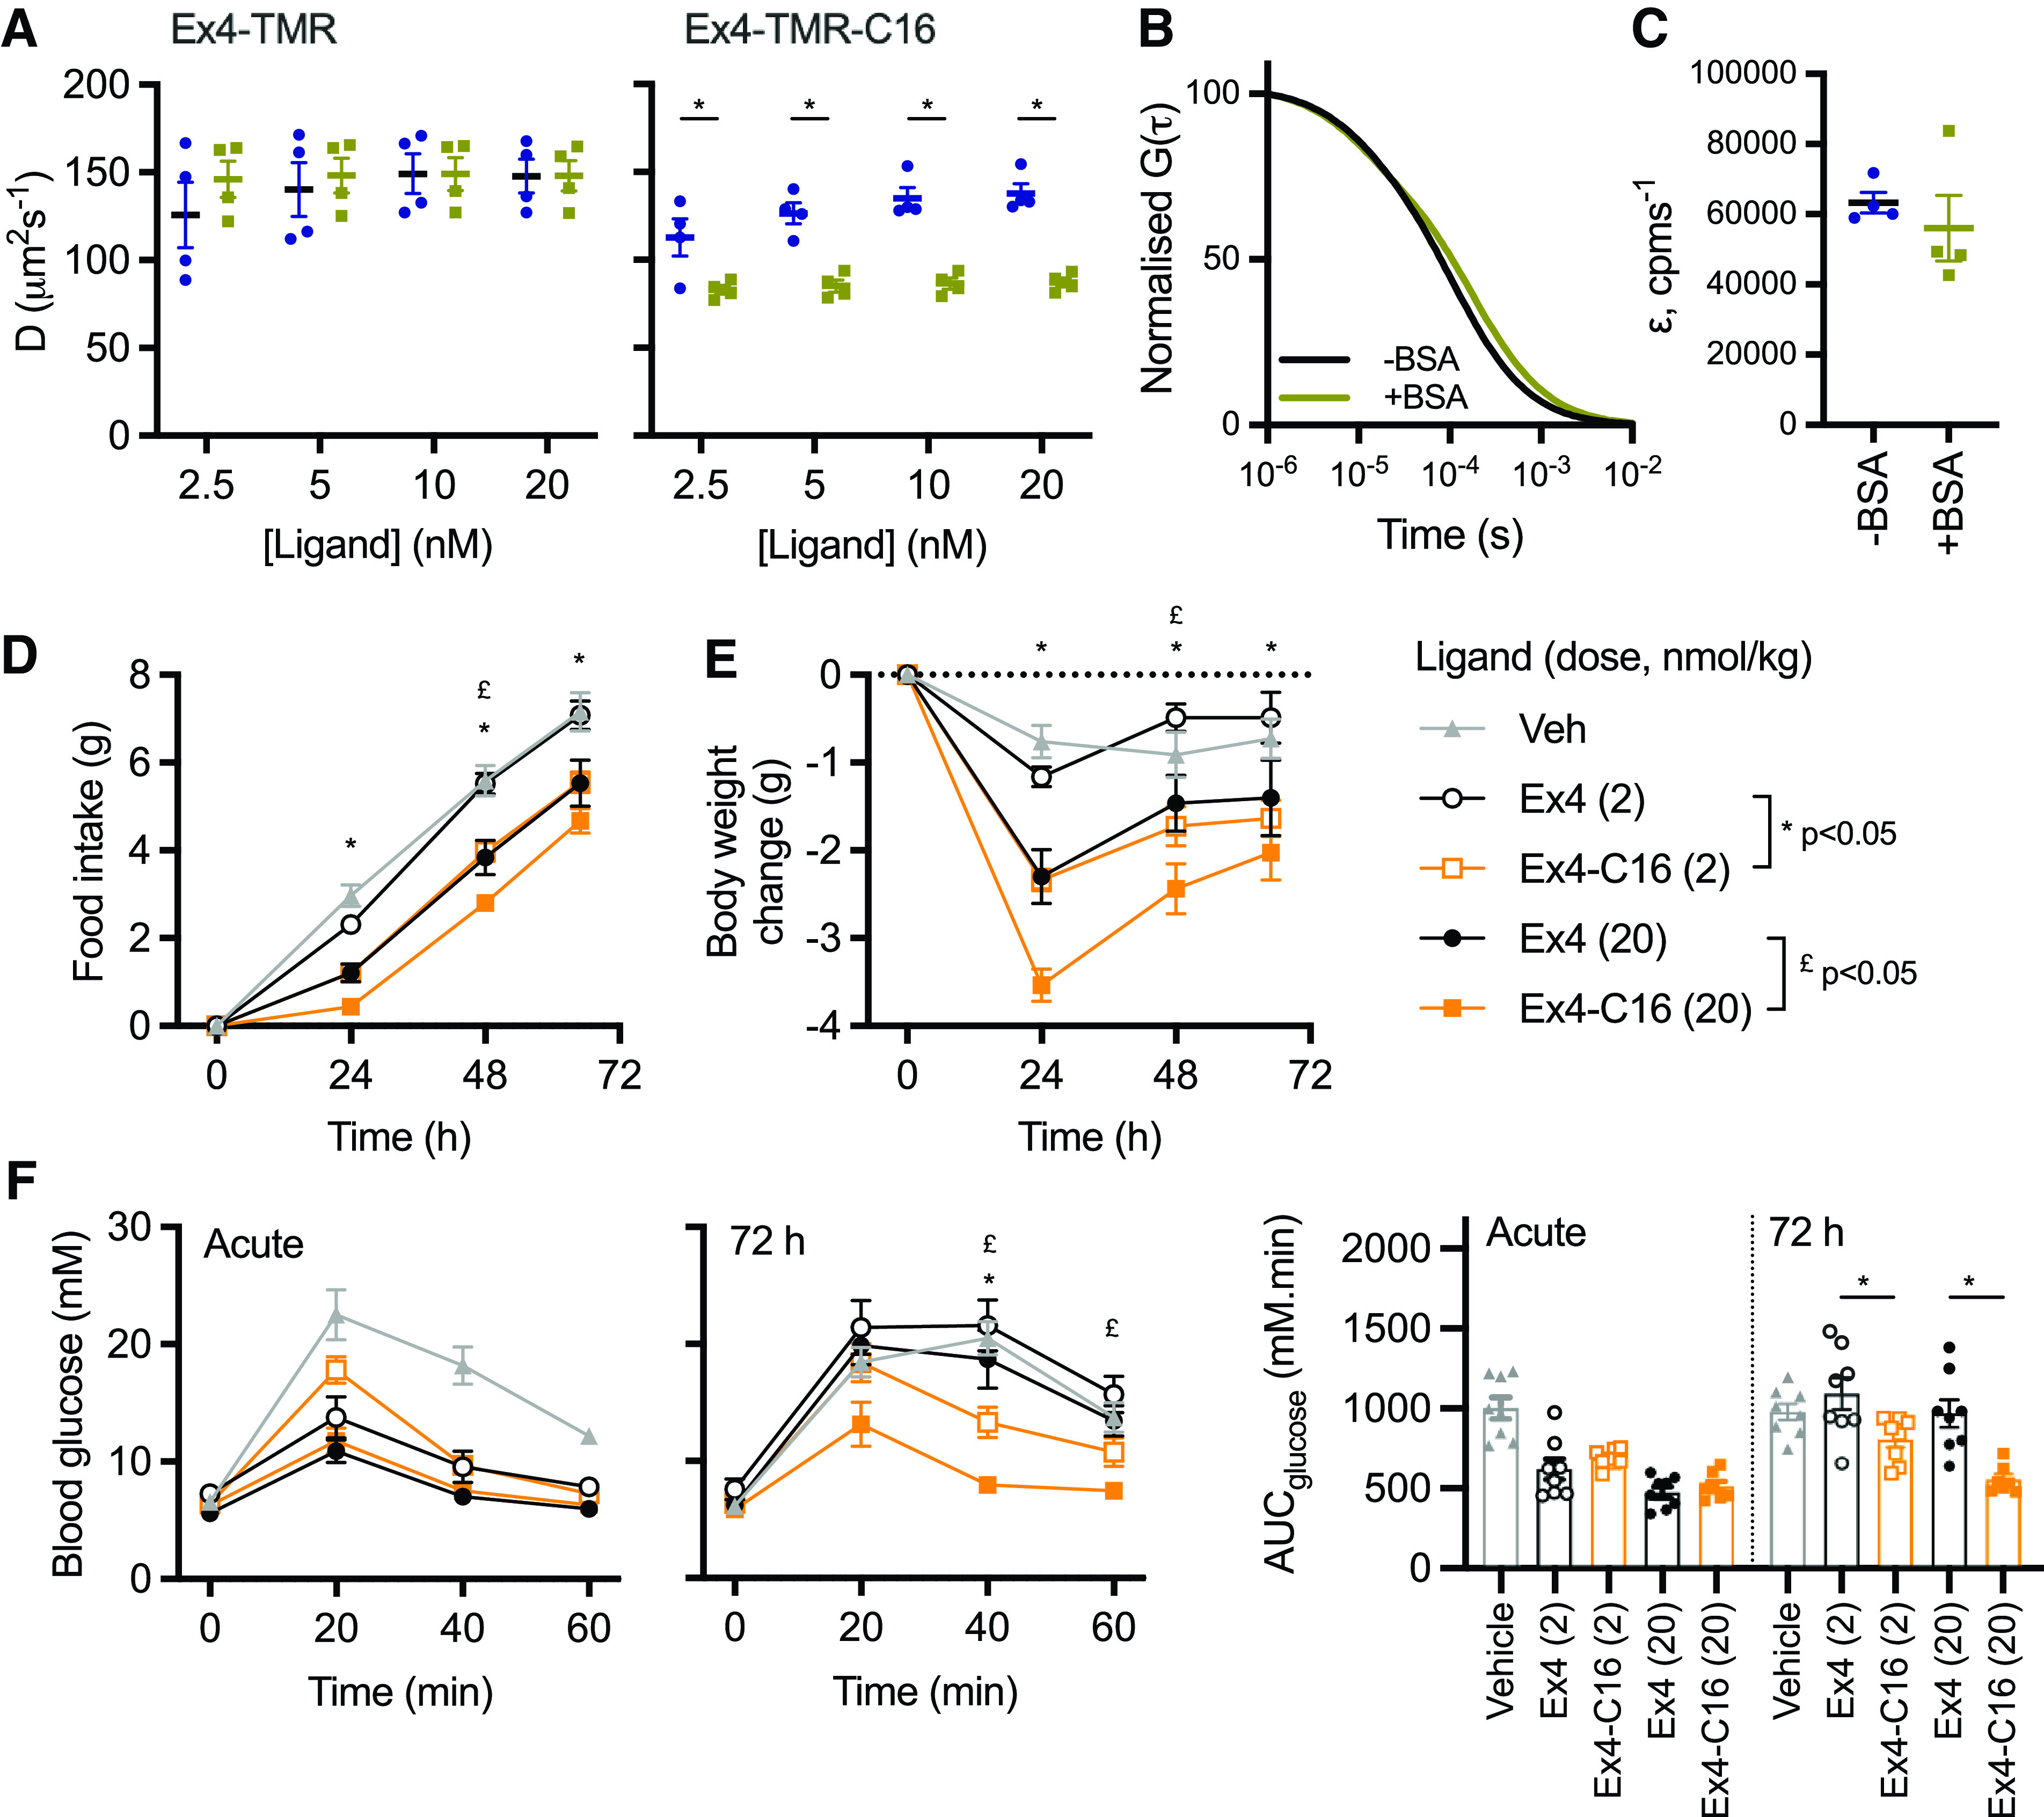
The glucagon-like peptide-1 receptor (GLP-1R) is a class B G protein-coupled receptor and mainstay therapeutic target for the treatment of type 2 diabetes and obesity. Recent reports have highlighted how biased agonism at the GLP-1R affects sustained glucose-stimulated insulin secretion through avoidance of desensitization and downregulation. A number of GLP-1R agonists (GLP-1RAs) feature a fatty acid moiety to prolong their pharmacokinetics via increased albumin binding, but the potential for these chemical changes to influence GLP-1R function has rarely been investigated beyond potency assessments for cAMP. Here, we directly compare the prototypical GLP-1RA exendin-4 with its C-terminally acylated analog, exendin-4-C16. We examine relative propensities of each ligand to recruit and activate G proteins and β-arrestins, endocytic and postendocytic trafficking profiles, and interactions with model and cellular membranes in HEK293 and HEK293T cells. Both ligands had similar cAMP potency, but exendin-4-C16 showed ∼2.5-fold bias toward G protein recruitment and a ∼60% reduction in β-arrestin-2 recruitment efficacy compared with exendin-4, as well as reduced GLP-1R endocytosis and preferential targeting toward recycling pathways. These effects were associated with reduced movement of the GLP-1R extracellular domain measured using a conformational biosensor approach and a ∼70% increase in insulin secretion in INS-1 832/3 cells. Interactions with plasma membrane lipids were enhanced by the acyl chain. Exendin-4-C16 showed extensive albumin binding and was highly effective for lowering of blood glucose in mice over at least 72 hours. Our study highlights the importance of a broad approach to the evaluation of GLP-1RA pharmacology. SIGNIFICANCE STATEMENT: Acylation is a common strategy to enhance the pharmacokinetics of peptide-based drugs. This work shows how acylation can also affect various other pharmacological parameters, including biased agonism, receptor trafficking, and interactions with the plasma membrane, which may be therapeutically important.


Figures

Fig. 1.
Fig. 1.
Biased agonism with exendin-4 and exendin-4-C16. (A) Schematic depicting the amino acid sequences of exendin-4 and exendin-4-C16 in single-letter amino acid code. (B) Equilibrium binding of unmodified exendin-4 and exendin-4-C16, n = 5, measured by competition binding in HEK293-SNAP-GLP1-R cells with exendin(9-39)-FITC used as the competing probe. (C) cAMP response in HEK293-SNAP-GLP-1R cells, 30-minute stimulation, n = 5, with four-parameter fits shown after normalization to global maximum. (D) LgBiT-mini-Gs (mGs) and LgBit-β-arrestin-2 (βarr2) recruitment to GLP-1R-SmBiT, n = 5, with three-parameter concentration-responses constructed from AUCs and bias factor calculation (see Materials and Methods) with comparison by paired t test. (E) Measurement of Gαs activation in HEK293T cells transiently transfected with SNAP-GLP-1R-NLuc and Nb37-GFP and stimulated with 100 nM agonist or vehicle, n = 6, with AUCs compared by paired t test. Refer to Supplemental Fig. 5B for individual experimental repeats. (F) Measurement of β-arrestin-2 activation in HEK293T cells transiently transfected with SNAP-GLP-1R and NLuc-4myc-βarr2-CYOFP1 and stimulated with 100 nM agonist or vehicle, n = 5, with AUCs compared by paired t test. (G) Heatmap representation of 100 nM agonist response data shown in Fig. 1, B–F with normalization to exendin-4 response. (H) Insulin secretion in INS-1 832/3 cells stimulated for 60 minutes with each agonist at 11 mM glucose (G11), n = 4, paired t test. (I) As for (H), but 16-hour stimulation, n = 6. Data are shown as means ± S.E.M. with individual replicates shown in some cases. *P < 0.05 by statistical test indicated.
Fig. 2.
Fig. 2.
Visualization of GLP-1R endocytosis with exendin-4 and exendin-4-C16, and fluorescent agonist conjugates. (A) Representative images from n = 3 experiments demonstrating endocytosis of SNAP-GLP-1R labeled with SNAP-Surface-549 after treatment of 30 minutes with 100 nM agonist or vehicle; scale bars, 8 µm. (B) Time-lapse images demonstrating movement of surface-labeled SNAP-GLP-1R into punctate structures on stimulation with 100 nM agonist or vehicle; scale bars, 20 µm. The graphs show the change over time in “spot count” per 0.33-mm field of view (FOV) after normalization to cell confluence, with the concentration-dependent rate constant (K) derived from one-phase association fitting also plotted with a three-parameter fit. (C) Representative images showing endosomal uptake of exendin-4 and exendin-4-TMR in T-REx-SNAP-GLP-1R cells with or without tetracycline-induced GLP-1R expression, labeled with SNAP-Surface-649 prior to stimulation with 100 nM of each TMR-conjugate for 30 minutes. Scale bars, 8 µm. Data are shown as means ± S.E.M.
Fig. 3.
Fig. 3.
Subcellular targeting of exendin-4 and exendin-4-C16. (A) Schematic depicting the investigation of GLP-1R membrane trafficking using the TR-FRET and BRET assays used in this work. (B) GLP-1R disappearance from cell surface in HEK293-SNAP-GLP-1R cells treated with 100 nM agonist or vehicle, measured by DERET, n = 5. (C) GLP-1R translocation to late endosomes/lysosomes in HEK293-SNAP-GLP-1R cells treated with 100 nM agonist or vehicle, measured by TR-FRET using LysoTracker Red DND99 as the acceptor, n = 5. (D) GLP-1R recycling in HEK293-SNAP-GLP-1R cells previously treated for 30 minutes with 100 nM agonist, measured by TR-FRET using extracellular Luxendin645 as the acceptor, n = 5. (E) Heatmap representation of data shown in (B), (C), and (D) after normalization to the exendin-4 response; statistical significance is indicated after paired t test. (F) GLP-1R disappearance from the cell surface in HEK293T cells transiently transfected with SNAP-GLP-1R-NLuc and KRAS-venus and treated with 100 nM agonist or vehicle, measured by BRET, n = 6. (G) GLP-1R appearance in Rab5+ early endosomes in HEK293T cells transiently transfected with SNAP-GLP-1R-NLuc and KRAS-venus and treated with 100 nM agonist or vehicle, measured by BRET, n = 6. (H) As for (G), but for Rab7+ late endosomes, n = 7. (I) As for (G), but for Rab11+ recycling endosomes, n = 7. (J) Heatmap representation of data shown in (F), (G), (H), and (I) after normalization to the exendin-4 response; statistical significance is indicated from paired t tests. (K) Mini-Gs translocation to the plasma membrane or Rab5+ early endosomes in HEK293-SNAP-GLP-1R cells treated with 100 nM agonist after transient transfection with Mini-Gs-NLuc plus KRAS-venus or Rab5-venus, n = 5. The agonist-specific AUC measured for each compartment marker are ratiometrically compared by paired t test. Data are shown as means ± S.E.M. with individual replicates shown in some cases. *P < 0.05 by statistical test indicated.
Fig. 4.
Fig. 4.
Membrane interactions of C-terminally acylated exendin-4 conjugates. (A) Confocal microscopy and phase contrast images of GUVs incubated with exendin-4-FITC or exendin-4-FITC-C16. Scale bars, 5 µm. Membrane signal is represented on the line plot. (B) FRET spectrum from T-REx-SNAP-GLP-1R cells with or without tetracycline-induced GLP-1R expression, labeled with 50 nM NR12S and incubated with 100 nM exendin-4-FITC or exendin-4-FITC-C16, n = 7. The background spectrum of each FITC ligand was subtracted, and the trace was normalized to the signal at 525 nm. Peak emission wavelength and amplitude, derived from Gaussian fitting of each spectrum, are shown and compared between ligands by two-way randomized block ANOVA with Sidak’s test. (C) FRET imaging of T-REx-SNAP-GLP-1R cells stimulated with 1 µM exendin-4 or exendin-4-C16, with representative ratiometric images pre- and poststimulation, and quantification from n =3 experiments. (D) Matched comparison of nanodomain-specific cAMP (AKAP79-CUTie) and total cAMP (HTRF) in T-REx-SNAP-GLP-1R cells, 12-minute stimulation, n = 6, with ΔpEC50 comparison by paired t test. (E) cAMP responses in HEK293-SNAP-GLP-1R cells preincubated for 30 minutes with vehicle or 10 mM MβCD prior to stimulation with each ligand for 30 minutes. Responses are expressed relative to the forskolin (FSK; 10 µM) response, n = 5, with the effect of MβCD on potency shown by subtracting pEC50 results and comparison by paired t test. (F) GLP-1R internalization measured by DERET in HEK293-SNAP-GLP-1R cells preincubated for 30 minutes with vehicle or 10 mM MβCD prior to stimulation with each ligand at 100 nM for 30 minutes, n = 5. AUC relative to baseline was quantified, and +MβCD results are expressed relative to −MβCD results for each ligand, and compared by paired t test. (G) Principle of NR12S conformational biosensor assay, with kinetic responses showing TR-FRET ratio normalized to baseline in response to indicated concentration of exendin-4 or exendin-4-C16, n = 5, with concentration-response curve constructed from AUC with three-parameter fit. Data are shown as means ± S.E.M. with individual replicates when possible. *P < 0.05 by statistical test indicated.
Fig. 5.
Fig. 5.
Albumin binding by fluorescence correlation spectroscopy and in vivo effects. (A) Diffusion coefficients, D (µm2s−1), of indicated concentration of indicated ligand with and without 0.1% BSA, with comparison by two-way randomized block ANOVA with Sidak’s test. (B) Representative 1x3D free diffusion fit for Exendin4-TMR-C16 (20 nM) autocorrelation curves with or without 0.1% BSA. The autocorrelation function, G(τ), is normalized to facilitate comparison of decay curves. (C) Molecular brightness, ε (counts per molecule per second), of EX4-TMR-C16 (20 nM) with and without 0.1% BSA. (D) Cumulative food intake in male HFD mice (n = 8/group) after a single intraperitoneal injection of the indicated agonist. Statistical comparisons between equimolar agonist doses by two-way repeated measures ANOVA with Tukey’s test. (E) As for (B), but showing the effect on body weight. (F) IPGTT (2 g/kg glucose) performed at the start and end of the 72-hour study. AUCs are compared by one-way ANOVA with Sidak’s test for equimolar agonist doses. Data are shown as means ± S.E.M. with individual replicates shown in some cases. *P < 0.05 by statistical test indicated.

References

    1. Andersen A, Lund A, Knop FK, Vilsbøll T (2018) Glucagon-like peptide 1 in health and disease. Nat Rev Endocrinol 14:390–403. - PubMed
    1. Andersen NH, Brodsky Y, Neidigh JW, Prickett KS (2002) Medium-dependence of the secondary structure of exendin-4 and glucagon-like-peptide-1. Bioorg Med Chem 10:79–85. - PubMed
    1. Ast JArvaniti AFine NHFNasteska DAshford FBStamataki ZKoszegi ZBacon AJones BJLucey MA, et al. (2020) Super-resolution microscopy compatible fluorescent probes reveal endogenous glucagon-like peptide-1 receptor distribution and dynamics. Nat Commun 11:467. - PMC - PubMed
    1. Buenaventura TBitsi SLaughlin WEBurgoyne TLyu ZOqua AINorman HMcGlone ERKlymchenko ASCorrêa IR Jr, et al. (2019) Agonist-induced membrane nanodomain clustering drives GLP-1 receptor responses in pancreatic beta cells. PLoS Biol 17:e3000097. - PMC - PubMed
    1. Carpenter B, Tate CG (2016) Engineering a minimal G protein to facilitate crystallisation of G protein-coupled receptors in their active conformation. Protein Eng Des Sel 29:583–594. - PMC - PubMed

Publication types