. 2021 Nov;27(11):1318-1329.
doi: 10.1261/rna.078923.121. Epub 2021 Jul 27.

SARS-CoV-2 infection triggers widespread host mRNA decay leading to an mRNA export block

Affiliations

SARS-CoV-2 infection triggers widespread host mRNA decay leading to an mRNA export block

James M Burke et al. RNA. 2021 Nov.

Abstract

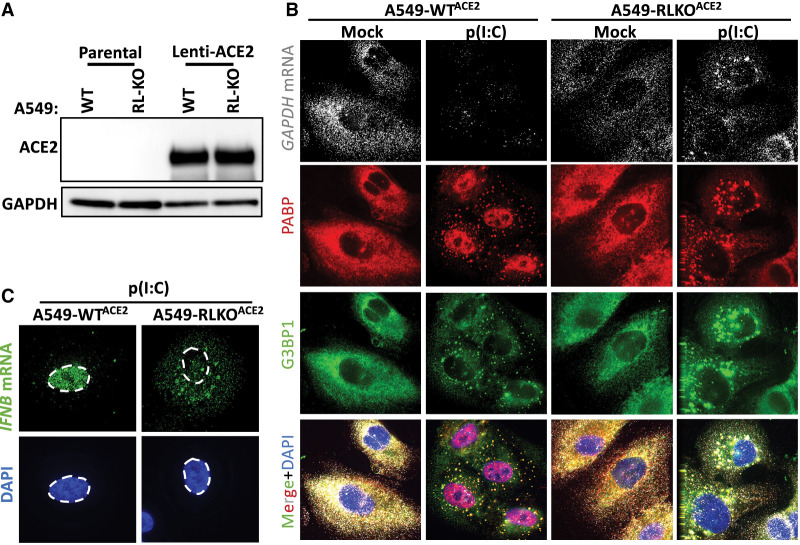
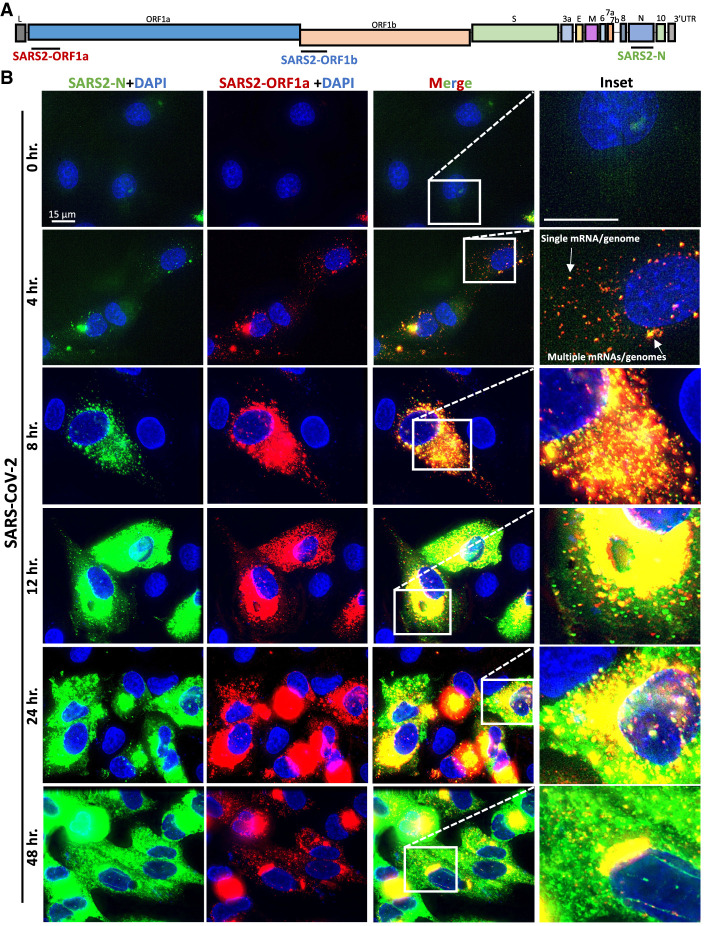
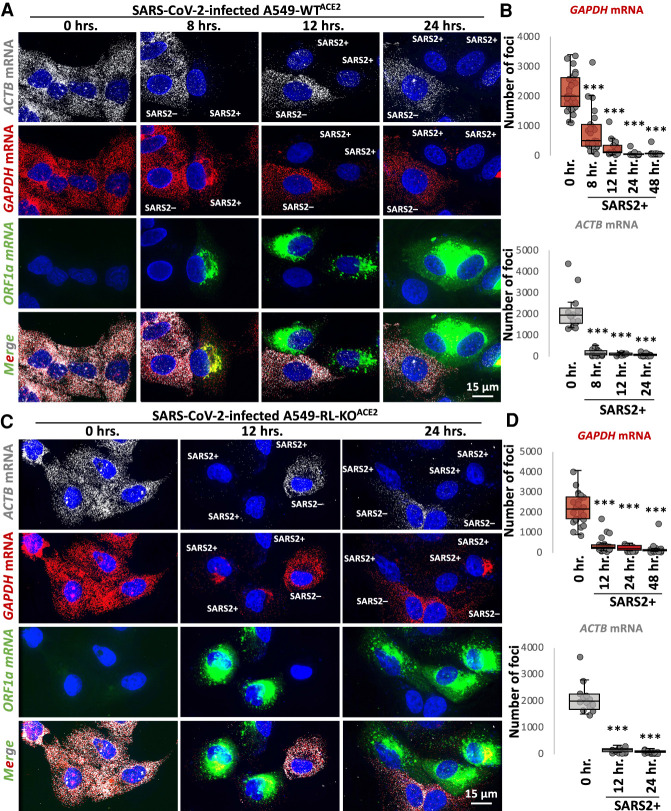
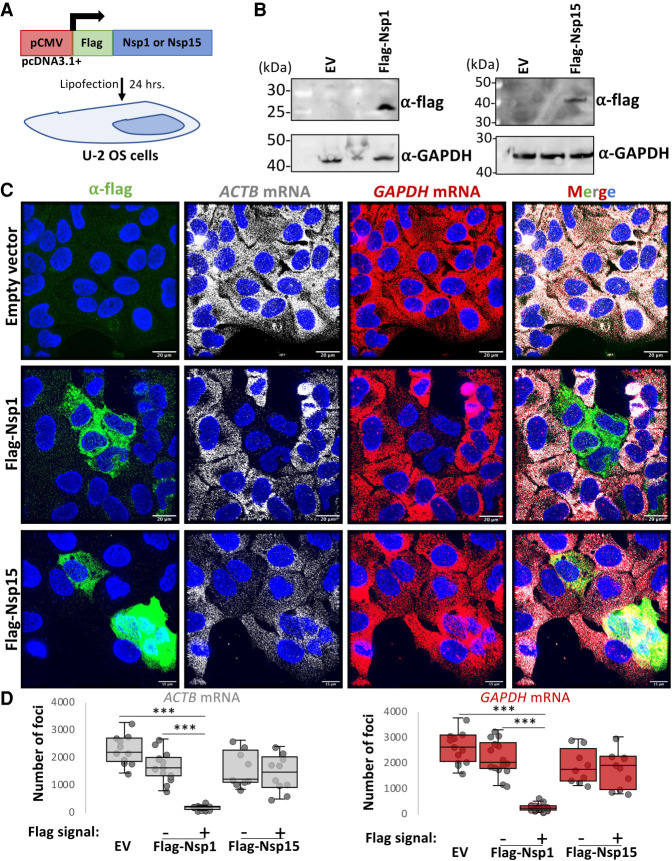
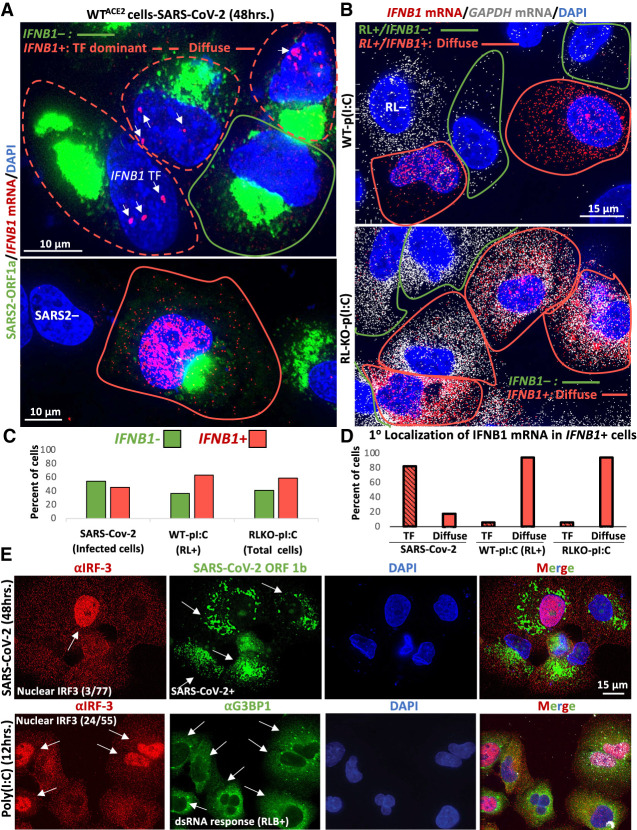
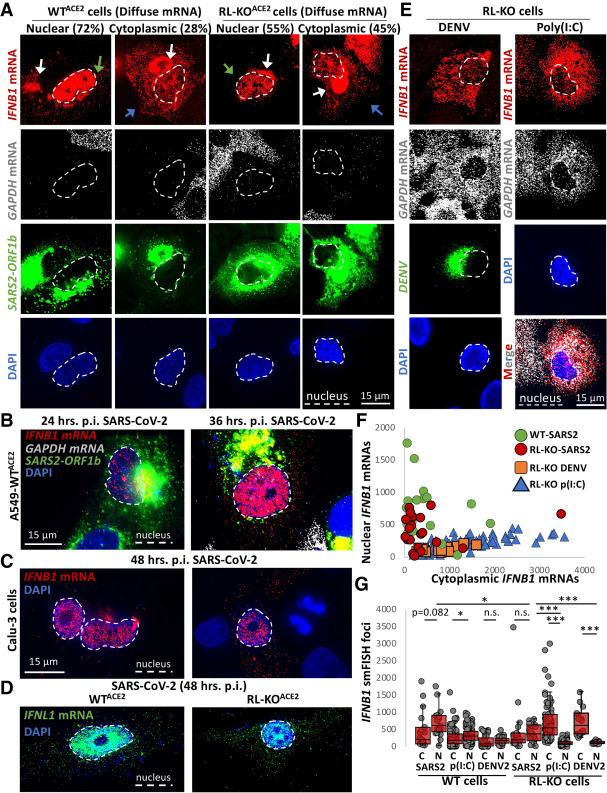
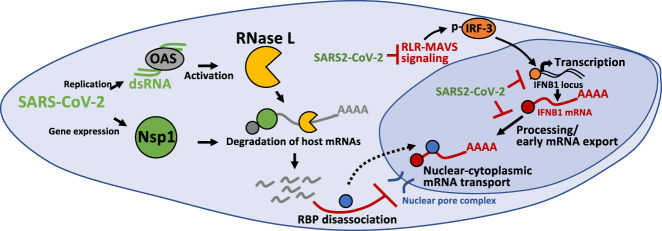
The transcriptional induction of interferon (IFN) genes is a key feature of the mammalian antiviral response that limits viral replication and dissemination. A hallmark of severe COVID-19 disease caused by SARS-CoV-2 is the low presence of IFN proteins in patient serum despite elevated levels of IFN-encoding mRNAs, indicative of post-transcriptional inhibition of IFN protein production. Here, we performed single-molecule RNA visualization to examine the expression and localization of host mRNAs during SARS-CoV-2 infection. Our data show that the biogenesis of type I and type III IFN mRNAs is inhibited at multiple steps during SARS-CoV-2 infection. First, translocation of the interferon regulatory factor 3 (IRF3) transcription factor to the nucleus is limited in response to SARS-CoV-2, indicating that SARS-CoV-2 inhibits RLR-MAVS signaling and thus weakens transcriptional induction of IFN genes. Second, we observed that IFN mRNAs primarily localize to the site of transcription in most SARS-CoV-2 infected cells, suggesting that SARS-CoV-2 either inhibits the release of IFN mRNAs from their sites of transcription and/or triggers decay of IFN mRNAs in the nucleus upon exiting the site of transcription. Lastly, nuclear-cytoplasmic transport of IFN mRNAs is inhibited during SARS-CoV-2 infection, which we propose is a consequence of widespread degradation of host cytoplasmic basal mRNAs in the early stages of SARS-CoV-2 replication by the SARS-CoV-2 Nsp1 protein, as well as the host antiviral endoribonuclease, RNase L. Importantly, IFN mRNAs can escape SARS-CoV-2-mediated degradation if they reach the cytoplasm, making rescue of mRNA export a viable means for promoting the immune response to SARS-CoV-2.

Keywords: IRF3; RNase L; SARS-CoV-2; innate immunity; interferon; mRNA decay; mRNA export.


Figures

FIGURE 1.
FIGURE 1.
Generation and characterization of WT and RNase L-KO A549 cells that express ACE2. (A) Immunoblot analysis to confirm ACE2 expression in parental (WT) and RNase L-KO (RL-KO) A549 cells. (B) Single-molecule fluorescence in situ hybridization (smFISH) for GAPDH mRNA and immunofluorescent assay for RNA-binding proteins PABP and G3BP1 that enrich in RNase L-dependent bodies (RLBs) in WT cells and stress granules in RL-KO cells 4 h post-lipofection of poly(I:C). (C) smFISH for IFNB mRNA in WTACE2 and RL-KOACE2 cells 4 h post-lipofection of poly(I:C).
FIGURE 2.
FIGURE 2.
Single-molecule analysis of SARS-CoV-2 genomic and subgenomic RNAs. (A) Schematic to show the location of smFISH probe sets targeting the different regions of SARS-CoV-2 mRNA. The ORF1a and ORF1b target the full-length genome, whereas the N probes target both the full-length genome and subgenomic RNAs. (B) smFISH for SARS-CoV-2 full length genome (ORF1a probes) and subgenomic RNAs (N probes) at indicated times post-infection with SARS-CoV-2 (MOI = 5).
FIGURE 3.
FIGURE 3.
Host mRNA levels rapidly reduce following SARS-CoV-2 infection, independently of RNase L. (A) smFISH for host GAPDH and ACTB mRNAs and SARS-CoV-2 full-length genome (ORF1b) at indicated times post-infection with SARS-CoV-2 (MOI = 5) in WTACE2 A549 cells. (B) Graphs show quantification of GAPDH and ACTB mRNAs as represented in above images. (C,D) Similar to A and B but in RL-KOACE2 A549 cells. Dots represent individual cells. Between 16 to 30 cells were analyzed per group. Statistical significance ([*] P < 0.05; [**] P < 0.005; [***] P < 0.0005) was determined by t-test.
FIGURE 4.
FIGURE 4.
SARS-CoV-2 Nsp1 expression is sufficient for degradation of host basal mRNAs. (A) Schematic of Flag-tagged SARS-CoV-2 protein expression vector transfected into U2-OS cells. (B) Immunoblot for Flag confirmed expression of Flag-tagged Nsp1 and Nsp15 expression at expected size (Nsp1 ∼20 kDa; Nsp15 ∼40 kDa) in cells transfected with respective expression vectors but not empty vector (EV). Note, the unlabeled lanes between the EV and Nsp1/Nsp15 vectors are plasmid clones that did not express the proteins and were not used for subsequent experiments. (C) Immunofluorescence assay for Flag and smFISH for ACTB and GAPDH mRNAs in U-2 OS cells 24 h post-transfection with either pcDNA3.1+ (empty vector; EV), Flag-Nsp1, or Flag-Nsp15 expression vectors. (D) Quantification of ACTB and GAPDH mRNAs as represented in C. Dots represent individual cells. Between 10–22 cells analyzed per group. Statistical significance ([*] P < 0.05; [**] P < 0.005; [***] P < 0.0005) was determined by t-test.
FIGURE 5.
FIGURE 5.
IFN mRNAs are retained at the site of transcription during SARS-CoV-2 infection. (A) smFISH for IFNB1 mRNA and SARS-CoV-2 ORF1a 48 h post-infection. Two fields of view are shown. In the top image, the cell boundary of SARS-CoV-2-positive cells that stain for IFNB1 are demarcated by red line, whereas IFNB1 mRNA-negative cells are demarcated by green line. Cells that contain IFNB1 transcription site foci (TF) but lack abundant disseminated IFNB1 mRNA are demarcated by dashed red line. The lower image shows a SARS-CoV-2-infected cell that contains abundant and diffuse IFNB1 mRNA in the nucleus and cytoplasm. Cells that do not stain for SARS-CoV-2 are labeled SARS2-. (B) smFISH for IFNB1 mRNA and GAPDH mRNA 16 h post-poly(I:C) transfection in WT and RL-KO A549 cells. In WT cells, 12% do not activate RNase L (RL−). Of the 88% of cells that activate RNase L, 63% (55% of total cells) also induce abundant and disseminated IFNB1 mRNA (red line), whereas 37% of RL+ cells do not induce IFNB1 (green line). Fifty-nine percent of RL-KO cells induce abundant disseminated IFNB1 mRNA (red line), whereas 41% do not (green line). (C) Histograms quantifying the percent of SARS-CoV-2 infected cells, poly(I:C)-transfected WT cells that activate RNase L (GAPDH mRNA-negative cells), and poly(I:C)-transfected RL-KO cells that induce IFNB1, as represented in A and B. (D) Histograms quantifying the percent of IFNB1-positive cells in which IFNB1 smFISH staining is predominantly localized to IFNB1 transcription site foci (TF) or diffuse. (E) Immunofluorescence assay for IRF3 translocation from the cytoplasm to the nucleus in response to either SARS-CoV-2 infection (48 h p.i.; MOI = 5) or poly(I:C) lipofection (12 h). The fraction of cells displaying robust nuclear IRF3 staining is shown in the IRF3 images. For SARS-CoV-2 infection, smFISH for SARS-CoV-2 ORF-1b was used to identify infected cells indicated by arrows. For cells undergoing dsRNA response to poly(I:C), G3BP1 immunofluorescence was used to identify RNase L-dependent bodies (RLBs), as indicated by white arrows.
FIGURE 6.
FIGURE 6.
Nuclear-cytoplasmic transport of IFN mRNAs is inhibited during SARS-CoV-2 infection. (A) smFISH for IFNB1 mRNA, GAPDH mRNA, and SARS-CoV-2 ORF1b mRNA in WTACE2 and RL-KOACE2 cells 48 h post-infection with SARS-CoV-2 (MOI = 5). Spectral crossover from the ORF1b-staining of the SARS-CoV-2 RF into the IFNB1 mRNA channel is indicated by white arrows. The green arrows indicate cells in which IFNB mRNA is retained in the nucleus. The blue arrows indicate cells in which IFNB mRNA is localized to the cytoplasm. (B) Similar to A but smFISH was performed at 24- and 36-h post-infection. (C) smFISH for IFNB1 mRNA in Calu-3 cells 48 h post-infection with SARS-CoV-2 (MOI = 5). Two fields of view are shown. (D) smFISH for IFNL1 mRNA in SARS-CoV-2-infected cells 48 h post-infection (MOI = 5). (E) Representative smFISH for IFNB1 and GAPDH mRNAs in RL-KO A549 cells 48 h post-infection with DENV (MOI = 0.1) or 16 h post-transfection with poly(I:C). (F) Scatter plot quantifying IFNB1 mRNA in the nucleus (y-axis) and in the cytoplasm (x-axis) in individual WTACE2 or RL-KOACE2 cells infected with SARS-CoV-2, or RL-KO cells 48 h post-infection with DENV2 or 8 h post-transfection with poly(I:C). (G) Quantification of IFNB1 mRNA via smFISH in the nucleus (N) or cytoplasm (C) of either WTACE2 or RL-KOACE2 cells infected with SARS-CoV-2, and WT or RL-KO cells transfected with poly(I:C) or infected with DENV2 as represented in (A and C). Poly(I:C) and DENV2 data were obtained from Burke et al. (2021). Dots represent individual cells. Between 20 to 125 cells were analyzed per group. Statistical significance ([*] P < 0.05; [**] P < 0.005; [***] P < 0.0005) was determined by t-test.
FIGURE 7.
FIGURE 7.
Inhibition of antiviral mRNA biogenesis during SARS-CoV-2 infection. Model of how antiviral mRNA biogenesis is inhibited during SARS-CoV-2 infection. SARS-CoV-2 replication generates double-stranded RNA (dsRNA), which is recognized by OAS and leads to RNase L activation. In addition, SARS-CoV-2 expresses the viral Nsp1 protein. Both RNase L activation and Nsp1 expression result in rapid and widespread decay of host basal mRNAs. We propose that the degradation of host mRNAs results in release of RNA-binding proteins (RBPs), and this perturbs late stages of nuclear-cytoplasmic RNA transport. The sequestration of antiviral mRNAs, such as IFNB1 mRNA, in the nucleus prevents their association with ribosomes in the cytoplasm, reducing their translation for protein production. In addition, SARS-CoV-2 inhibits the transcription of antiviral genes by reducing nuclear levels of IRF3 via inhibition of RLR-MAVS signaling. Lastly, SARS-CoV-2 alters an aspect of mRNA processing or association with early mRNA export factors, and/or rapidly degrades dsRNA-induced antiviral mRNAs, such as IFNB1 mRNA. The result of this is the inability of IFNB1 mRNAs to exit the site of IFNB1 transcription, preventing their transport to the cytoplasm and reducing their translation.

References

    1. Bhardwaj K, Palaninathan S, Alcantara JMO, Li Yi L, Guarino L, Sacchettini JC, Kao CC. 2008. Structural and functional analyses of the severe acute respiratory syndrome coronavirus endoribonuclease Nsp15. J Biol Chem 283: 3655–3664. 10.1074/jbc.M708375200 - DOI - PMC - PubMed
    1. Blanco-Melo D, Nilsson-Payant BE, Liu WC, Uhl S, Hoagland D, Møller R, Jordan TX, Oishi K, Panis M, Sachs D, et al. 2020. Imbalanced host response to SARS-CoV-2 drives development of COVID-19. Cell 181: 1036–1045.e9. 10.1016/j.cell.2020.04.026 - DOI - PMC - PubMed
    1. Burke JM, Moon SL, Matheny T, Parker R. 2019. RNase L reprograms translation by widespread mRNA turnover escaped by antiviral mRNAs. Mol Cell 75: 1203–1217.e5. 10.1016/j.molcel.2019.07.029 - DOI - PMC - PubMed
    1. Burke JM, Lester ET, Tauber D, Parker R. 2020. RNase L promotes the formation of unique ribonucleoprotein granules distinct from stress granules. J Biol Chem 295: 1426–1438. 10.1074/jbc.RA119.011638 - DOI - PMC - PubMed
    1. Burke JM, Gilchrist AR, Sawyer SL, Parker R. 2021. RNase L limits host and viral protein synthesis via inhibition of mRNA export. Science Adv 7: eabh2479. 10.1126/sciadv.abh2479 - DOI - PMC - PubMed

Publication types

MeSH terms