. 2021 Jul 27;12(1):4535.
doi: 10.1038/s41467-021-24781-7.

Retinoblastoma from human stem cell-derived retinal organoids

Affiliations

Retinoblastoma from human stem cell-derived retinal organoids

Jackie L Norrie et al. Nat Commun. .

Abstract

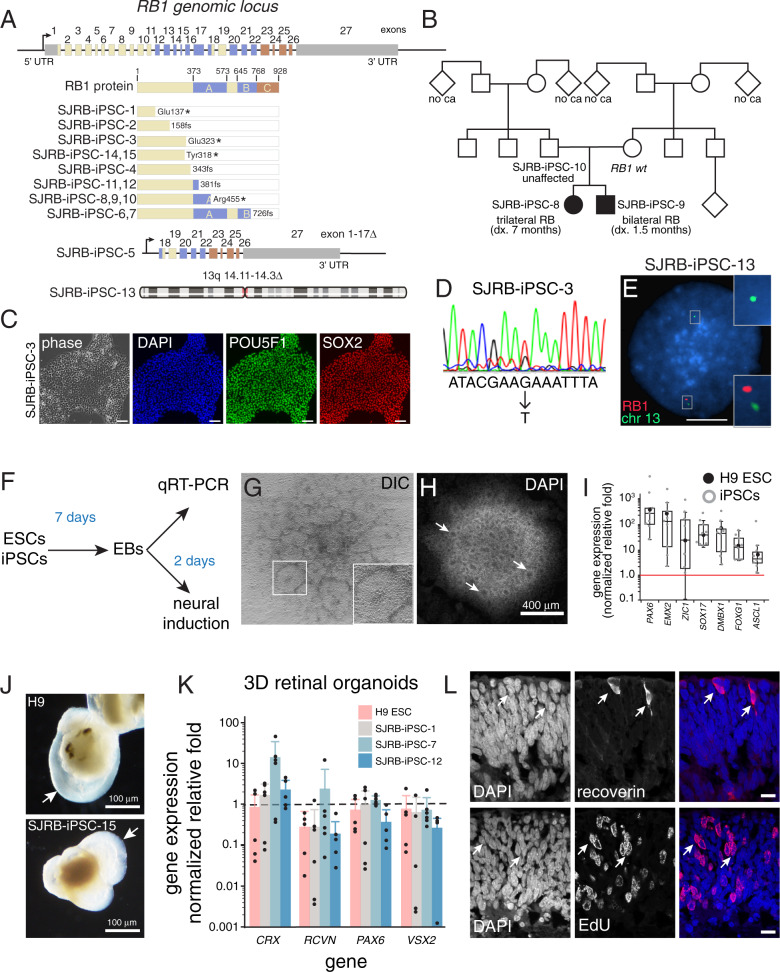
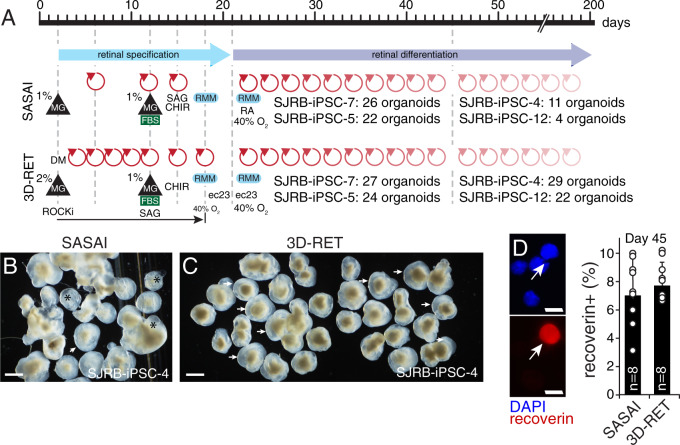
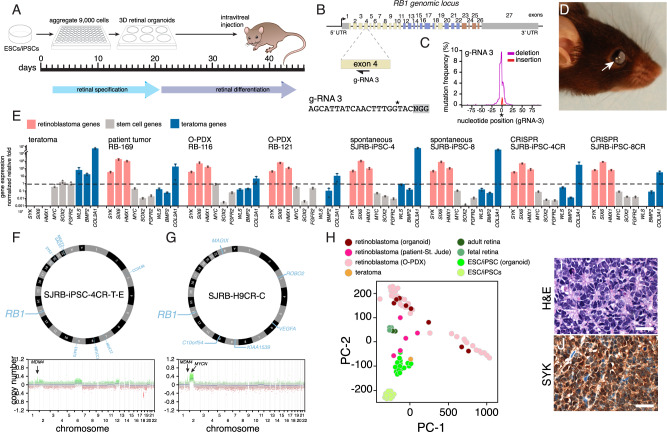
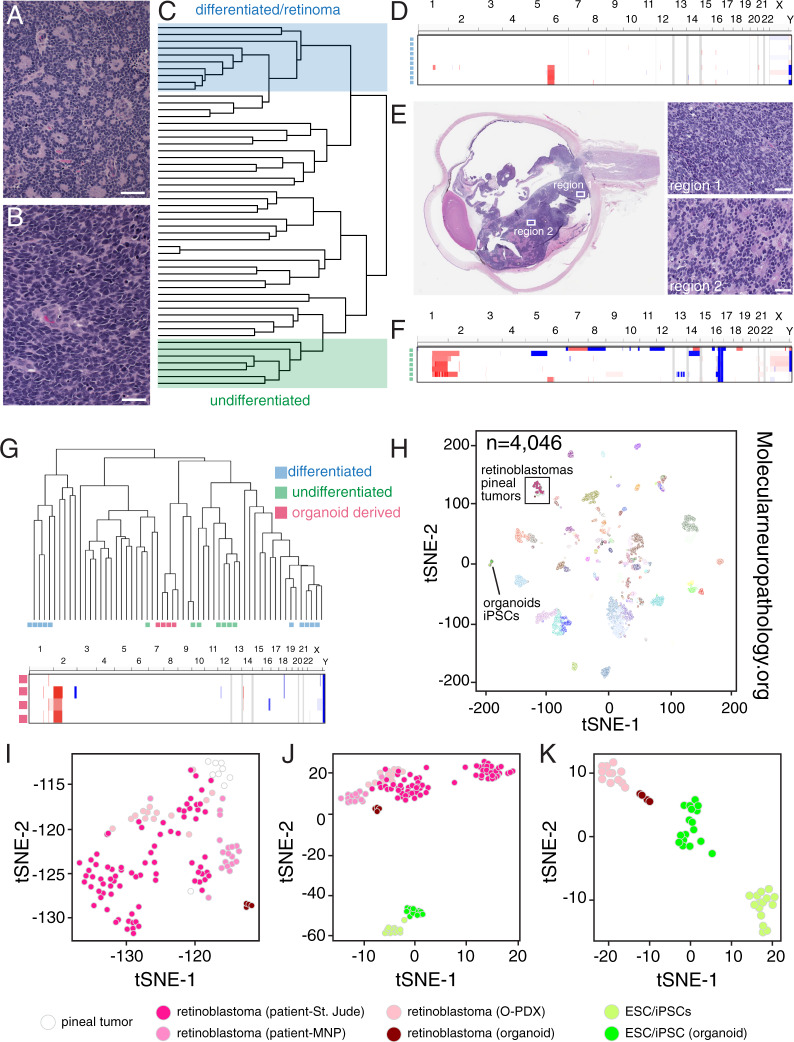
Retinoblastoma is a childhood cancer of the developing retina that initiates with biallelic inactivation of the RB1 gene. Children with germline mutations in RB1 have a high likelihood of developing retinoblastoma and other malignancies later in life. Genetically engineered mouse models of retinoblastoma share some similarities with human retinoblastoma but there are differences in their cellular differentiation. To develop a laboratory model of human retinoblastoma formation, we make induced pluripotent stem cells (iPSCs) from 15 participants with germline RB1 mutations. Each of the stem cell lines is validated, characterized and then differentiated into retina using a 3-dimensional organoid culture system. After 45 days in culture, the retinal organoids are dissociated and injected into the vitreous of eyes of immunocompromised mice to support retinoblastoma tumor growth. Retinoblastomas formed from retinal organoids made from patient-derived iPSCs have molecular, cellular and genomic features indistinguishable from human retinoblastomas. This model of human cancer based on patient-derived iPSCs with germline cancer predisposing mutations provides valuable insights into the cellular origins of this debilitating childhood disease as well as the mechanism of tumorigenesis following RB1 gene inactivation.


Conflict of interest statement

The authors declare no competing interests.

Figures

Fig. 1
Fig. 1. Generation of iPSC lines from patients with germline RB1 mutations.
A Map of the genomic locus showing each of the 27 exons of the RB1 gene and the color-coded protein-coding domains. The germline mutations in each patient/family are shown below the full-length protein. B Representative pedigree for an unaffected carrier (SJRB-iPSC-10) and two affected children (SJ-iPSC-8 and SJ-iPSC-9). C Representative micrographs of SJRB-iPSC-3 colony immunostained for POU5F1 (green) and SOX2 (red) with DAPI (blue) nuclear stain. Staining was repeated on another iPSC line with the same results. D Sanger sequencing chromatogram showing the heterozygous nonsense mutation in the RB1 gene (GAA→UAA). E Representative two-color fluorescence in situ hybridization (FISH) of SJRB-iPSC-13 showing the 13q deletion (200 cells were analyzed). F Drawing of the neural rosette differentiation experiment. G, H Differential interference contrast (DIC) and DAPI-stained colony from the neural rosette induction procedure. Arrows and the enlarged box indicate neural rosettes. Three clones of each line were differentiated and each line was able to produce rosettes. I Boxplot of the normalized relative fold of neurogenic genes for each iPSC line (n = 15) and H9 ESCs from qRT-PCR of the neural induction assay. J Micrograph of representative retinal organoid from H9 ESCs and SJRB-iPSC-15 indicating retina (arrow). K GAPDH normalized relative fold gene expression for 3D retinal organoids from representative iPSC lines using H9 ESCs as controls. Each dot represents the mean of two technical replicates for an individual organoid. L Micrograph of cryosection of day 45 retinal organoid that was labeled with EdU for 1 h prior to harvest showing recoverin expressing photoreceptors and EdU+ retinal progenitor cells (red) with DAPI counterstain. Each of the 15 lines was sectioned showing similar results in neural retina regions. Box and whisker plots include center line as median, box as Q1 and Q3, and whiskers as 1.5× interquartile range. Scale bars: C, 50 μm; E, L, 10 μm.
Fig. 2
Fig. 2. The 3D-RET protocol for retinal organoid formation.
A Drawing of the steps in the Sasai and 3D-RET retinal organoid protocol. The number of retinal organoids produced from a 96-well dish is indicated for representative lines for each protocol. Red arrows indicate media changes. B, C Micrograph of representative retinal organoids using the Sasai and 3D-RET protocols in a side-by-side comparison for SJRB-iPSC-4. All organoids from a 96-well dish were analyzed. Arrows indicate retina organoids and (*) indicates cystic structures that are common in the Sasai protocol. D Micrographs of dissociated cell immunofluorescence of retinal organoids and a dot plot showing the percentage of recoverin immunopositive cells from individual retinal organoids (n = 8). MG Matrigel, SAG smoothened agonist, RMM retinal maturation medium, FBS fetal bovine serum, CHIR GSK3 inhibitor, ec23 retinoic acid analog. Scale bars: B, C, 100 μm. D, 5 μm.
Fig. 3
Fig. 3. Retinoblastoma from 3D retinal organoids.
A Schematic drawing of the retinoblastoma workflow. After 45 days of differentiation, retinal organoids are dissociated and injected into the eyes of immunocompromised mice and they are held for 1 year to wait for tumor formation. B Drawing of the RB1 genomic locus with the location of the gRNA targeting exon 4 and the corresponding sequence. C Plot of mutation frequency in a representative iPSC line for gRNA-3 with insertions (red) and deletion (blue) flanking the cut site (*). D Photograph of a mouse with retinoblastoma from a retinal organoid. E Barplot of qRT-PCR for genes found in the retinoblastoma (SYK, SIX3, HMX1), human pluripotent stem cells (MYC, SOX2, FGFR2), and teratomas (WLS, BMP2, COLA1) from one teratoma, one patient tumor (RB-169), two PDX tumors (RB116 and RB121), two spontaneous retinal organoids-derived tumors (SJRB-iPSC-4 and SJRB-iPSC-8), and two CRISPR-modified retinal organoids (SJRB-iPSC-4CR, SJRB-iPSC-8CR). Each dot is the mean of technical duplicates, the bar is the mean and standard deviation between replicates. All data are normalized to GAPDH and plotted relative to H9 ESCs (dashed line). F, G Circos plot of representative organoid-derived retinoblastoma (SJRB-iPSC-4CR-T-E and SJRB-H9CR-T-C) showing somatic mutations acquired in the tumor relative to the iPSC/ESC line. The copy number changes across the genome are shown below each tumor. H Principal component analysis (PCA) of RNA-seq of organoid-derived retinoblastomas, O-PDXs, patient tumors, iPSC/ESCs, and retinal organoids. I, J Hematoxylin and eosin (H&E)-stained organoid-derived tumor showing rosettes and IHC for SYK (brown) which is not present in the normal retina but is upregulated in retinoblastoma. Staining was completed on three tumors with similar results. Scale bars: 25 μm.
Fig. 4
Fig. 4. DNA methylation profiling of retinoblastoma.
A, B Hematoxylin and eosin (H&E) staining of differentiated and undifferentiated patient retinoblastoma. C Unsupervised hierarchical clustering of retinoblastoma tumors showing separation of the differentiated and undifferentiated samples. DF Copy number variation in the differentiated retinoblastomas (D) and undifferentiated patient retinoblastomas (F) and H&E staining (E) of a patient eye that has regions of both undifferentiated (region 1) and differentiated (region 2) tumor, suggesting intratumor cellular heterogeneity. G Copy number variation and clustering of the retinal organoid-derived tumors. H t-distributed stochastic neighbor embedding (tSNE) plot of the St. Jude retinoblastomas, retinal organoid-derived tumors, retinal organoids, and iPSC/ESCs integrated with the Molecular Neuropathology (MPN) database of brain regions and pediatric brain tumors. I tSNE plot of the boxed region in (H) showing clustering of the organoid-derived tumors with patient retinoblastomas. J tSNE plot of the patient, O-PDX, and organoid-derived retinoblastomas with iPSC/ESCs and normal retinal organoids. K tSNE plot of O-PDX and organoid-derived retinoblastomas with iPSC/ESCs and normal retinal organoids. Scale bars: 25 μm.
Fig. 5
Fig. 5. Cellular heterogeneity of retinoblastomas.
A Uniform manifold approximation projection (UMAP) plot of scRNA-seq of normal human retinal cells including retinal progenitor cells and all adult retinal cell types. B UMAP plot of scRNA-seq of human retinoblastoma from patient tumors, O-PDXs, and organoid-derived tumors. The label transfer for cell identity is displayed, and the overall numbers are represented in the piechart in the upper left corner. C Representative UMAP plot of one of the organoid-derived tumors showing cells with the progenitor cell signature and rod signature and the relative distribution of gene expression profile for proliferation. D Barplot of the proportion of single cells with the retinal progenitor cell gene expression signature and the rod signature for each tumor (upper panel) and the proportion of those cells that are proliferating (S/G2/M, lower panel) for each tumor analyzed by single-cell RNA sequencing (n = 19). E, F UMAP plot of gene expression for normal retina and retinoblastoma for a representative retinal progenitor cell gene (HES6) and a photoreceptor gene (AIPL1). G, H, I Violin plot of the distribution of expression of a progenitor gene (HES6), a photoreceptor gene (AIPL1) and a cone gene (PDE6H) across retinal cell types and retinoblastomas. The colors match the colors in (A, B).

References

    1. Macpherson D, Dyer MA. Retinoblastoma: from the two-hit hypothesis to targeted chemotherapy. Cancer Res. 2007;67:7547–7550. doi: 10.1158/0008-5472.CAN-07-0276. - DOI - PubMed
    1. Rushlow DE, et al. Characterisation of retinoblastomas without RB1 mutations: genomic, gene expression, and clinical studies. Lancet Oncol. 2013;14:327–334. doi: 10.1016/S1470-2045(13)70045-7. - DOI - PubMed
    1. McEvoy J, et al. RB1 gene inactivation by chromothripsis in human retinoblastoma. Oncotarget. 2014;5:438–450. doi: 10.18632/oncotarget.1686. - DOI - PMC - PubMed
    1. Rodriguez-Galindo, C. et al. Ch. 56, (eds Orkin, S.H.) 1747–1778 (Elsevier, 2015).
    1. Knudson A. Mutation and cancer: statistical study of retinoblastoma. Proc. Natl Acad. Ssi. USA. 1971;68:820–823. doi: 10.1073/pnas.68.4.820. - DOI - PMC - PubMed

Publication types

Substances