. 2021 Jul 27;12(1):4567.
doi: 10.1038/s41467-021-24807-0.

Single-cell transcriptome of bronchoalveolar lavage fluid reveals sequential change of macrophages during SARS-CoV-2 infection in ferrets

Affiliations

Single-cell transcriptome of bronchoalveolar lavage fluid reveals sequential change of macrophages during SARS-CoV-2 infection in ferrets

Jeong Seok Lee et al. Nat Commun. .

Abstract

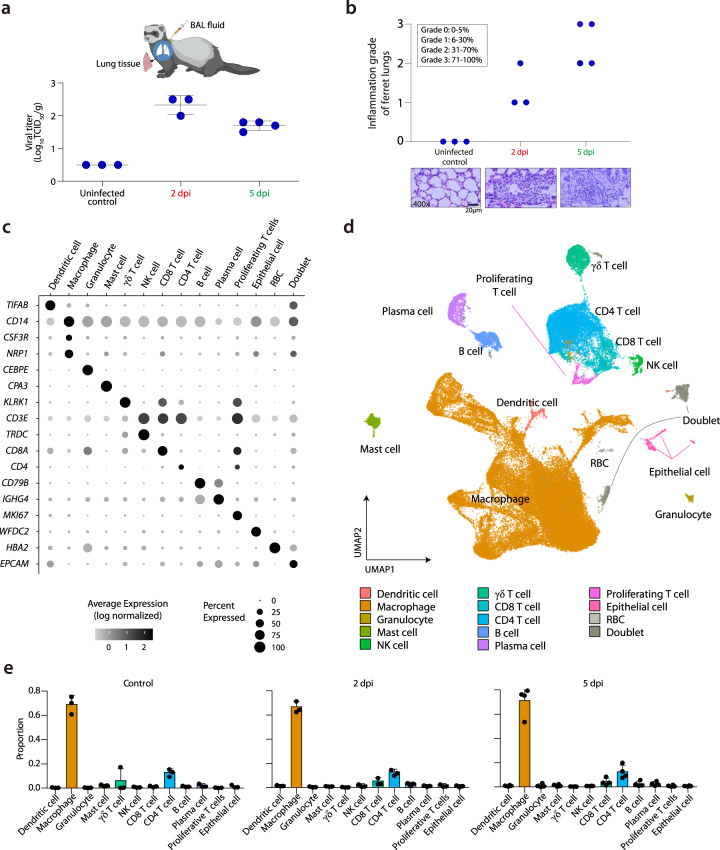
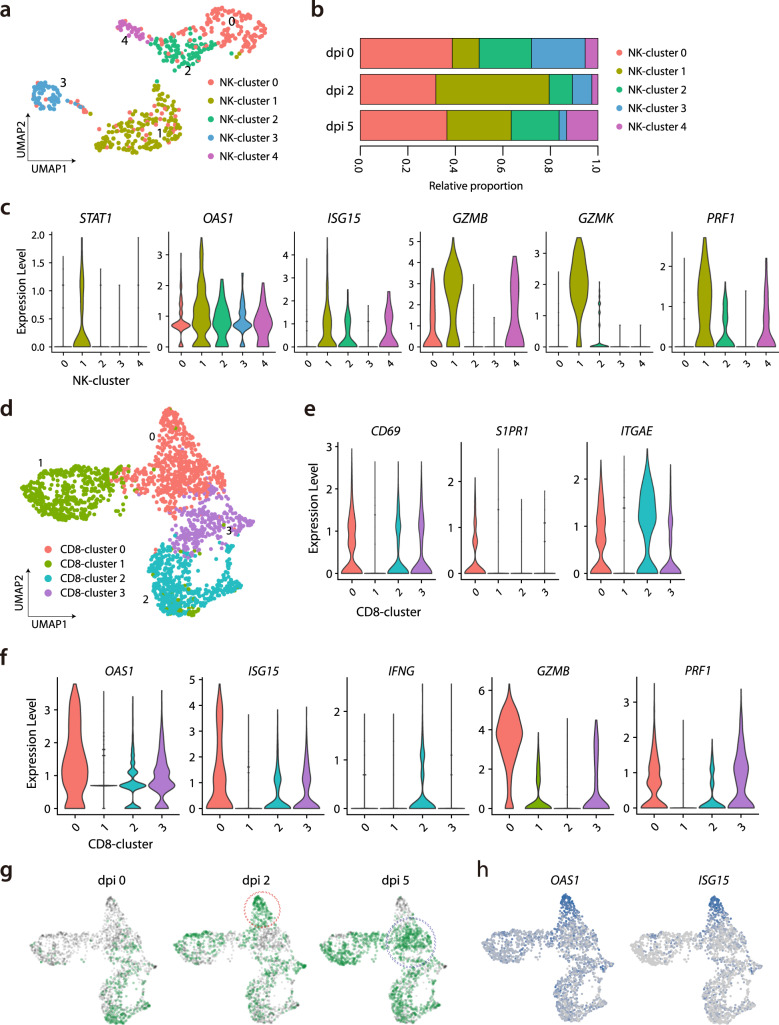
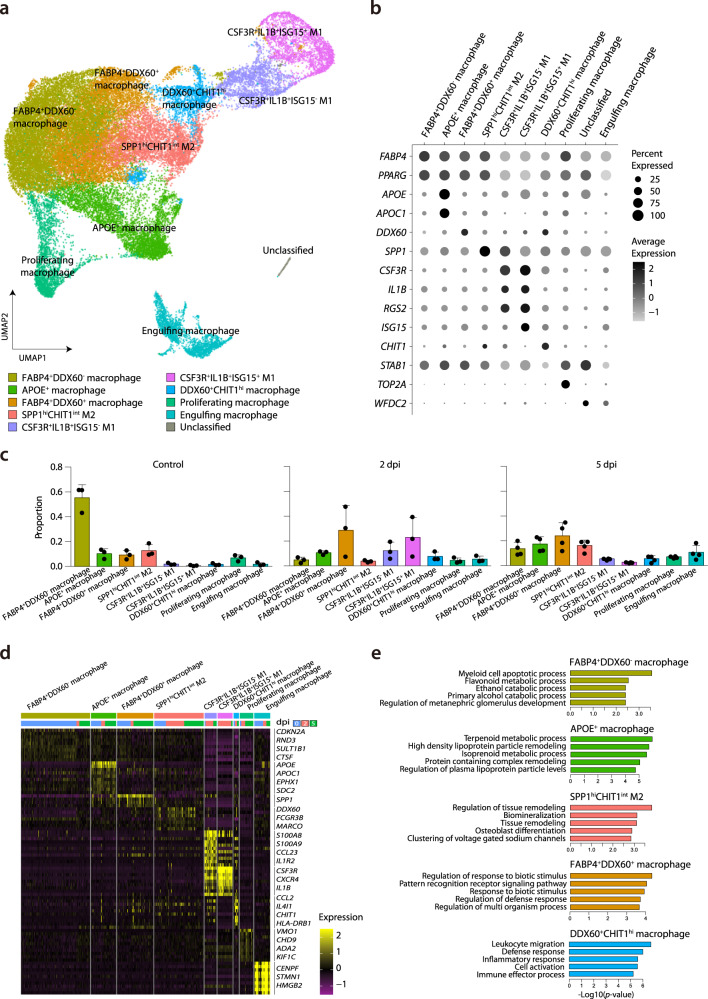
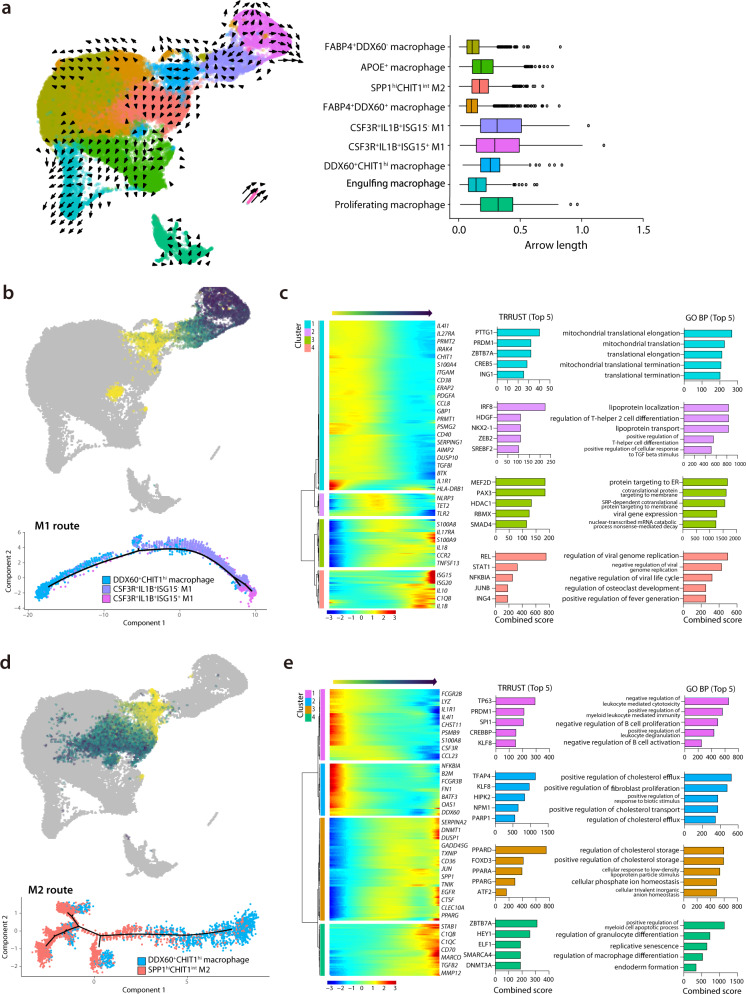
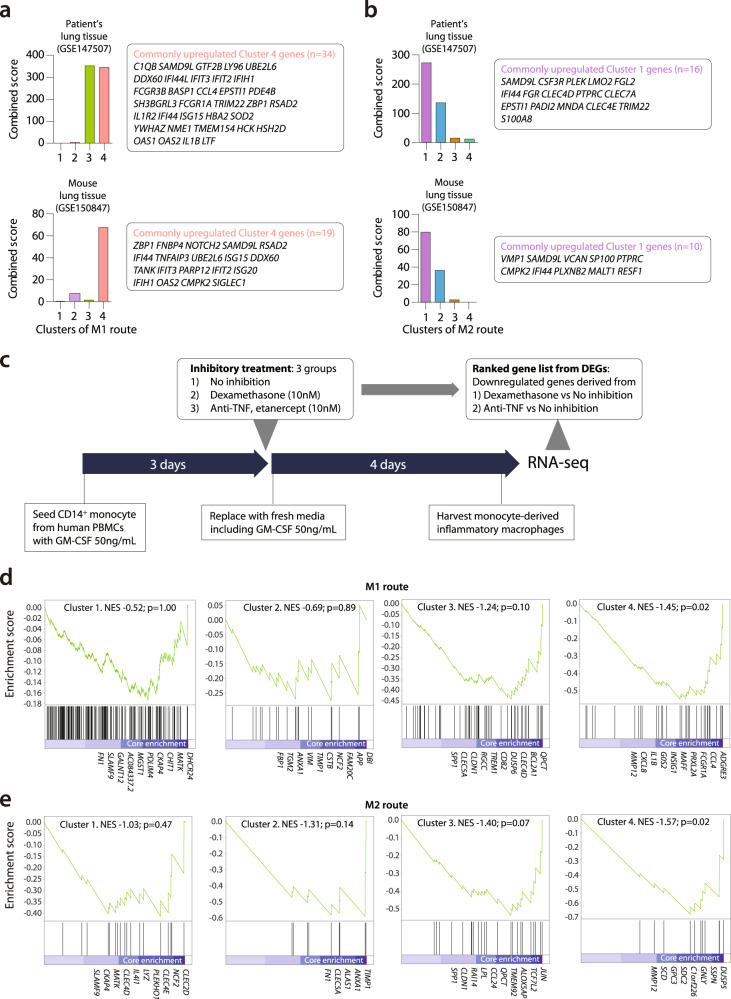
Few studies have used a longitudinal approach to describe the immune response to SARS-CoV-2 infection. Here, we perform single-cell RNA sequencing of bronchoalveolar lavage fluid cells longitudinally obtained from SARS-CoV-2-infected ferrets. Landscape analysis of the lung immune microenvironment shows distinct changes in cell proportions and characteristics compared to uninfected control, at 2 and 5 days post-infection (dpi). Macrophages are classified into 10 distinct subpopulations with transcriptome changes among monocyte-derived infiltrating macrophages and differentiated M1/M2 macrophages, notably at 2 dpi. Moreover, trajectory analysis reveals gene expression changes from monocyte-derived infiltrating macrophages toward M1 or M2 macrophages and identifies a macrophage subpopulation that has rapidly undergone SARS-CoV-2-mediated activation of inflammatory responses. Finally, we find that M1 or M2 macrophages show distinct patterns of gene modules downregulated by immune-modulatory drugs. Overall, these results elucidate fundamental aspects of the immune response dynamics provoked by SARS-CoV-2 infection.


Conflict of interest statement

The authors declare no competing interests.

Figures

Fig. 1
Fig. 1. Single-cell transcriptomes of BAL fluid cells from SARS-CoV-2-infected ferrets.
a Summary of experimental conditions with viral titers in the negative control, at 2 days post-infection (dpi) and 5 dpi. b Histopathologic scoring of the lung tissues of negative control ferrets, and SARS-CoV-2-infected ferrets on 2 and 5 dpi. The scale bar indicates 20 μm. c Fourteen different clusters and their specific marker gene expression levels, where brightness indicates log-normalized average expression, and circle size indicates percent expressed. d UMAP of 59,138 cells from the bronchoalveolar lavage (BAL) fluid of 10 ferrets, colored to show annotated cell types. e The proportion of each cell type at uninfected control (n = 3), 2 dpi (n = 3), and 5 dpi (n = 4). NK natural killer, RBC red blood cell, TCID50 median tissue culture infectious dose. The height of bars indicates mean and error bars indicate standard deviation. Source data are provided as a Source Data file.
Fig. 2
Fig. 2. Subpopulation analysis of NK cells and CD8+ T cells.
a UMAP plot of the NK cell subpopulations in all groups, colored to indicate cluster information. b Proportion of each cell type in NK cell clusters at uninfected control (n = 3), 2 dpi (n = 3), and 5 dpi (n = 4). c Violin plots showing expression levels of STAT1, OAS1, ISG15, GZMB, GZMK, and PRF1 in the five NK cell clusters. d UMAP plot of the CD8+ T-cell subpopulations in all groups, colored to show cluster information. e, f Violin plots showing expression levels of CD69, S1PR1, ITGAE, OAS1, ISG15, IFNG, GZMB, and PRF1 in the four CD8+ T cell clusters. g UMAP plot in which color density reflects the distributions of CD8+ T cells ferrets in the negative control, at 2 dpi and 5 dpi with SARS-CoV-2. The red circle indicates a concentrated area of cluster 0 with CD8+ T cells at 2 dpi, and the blue circle indicates that of CD8+ T cells at 5 dpi. h UMAP plots show normalized expressions of OAS1 and ISG15 in CD8+ T cells. Source data are provided as a Source Data file.
Fig. 3
Fig. 3. Sub-clustering analysis of macrophages.
a UMAP plot of the macrophage subpopulations in all groups, colored to show cluster information. b Ten different clusters and their specific marker gene expression levels, with brightness indicating log-normalized average expression, and circle size indicating the percent expressed. c Proportion of each macrophage cell type at uninfected control (n = 3), 2 dpi (n = 3), and 5 dpi (n = 4). The height of bars indicates mean and error bars indicate standard deviation. d Heatmap of cluster-specific differentially expressed genes (DEGs), for each macrophage cell type (n = 9). The color indicates the relative gene expression, and representative genes are shown together. e Bar plots showing −log10(p value) from enrichment analysis of representative GO biological pathways among FABP4+DDX60 macrophages (resting tissue macrophages), APOE+ macrophages, SPP1hiCHIT1int M2 (potentially profibrogenic), FABP4+DDX60+ macrophages (activated tissue macrophages), and DDX60+CHIT1hi macrophages (monocyte-derived infiltrating). The p values are calculated from a theoretical null distribution with a two-sided Wilcoxon signed-rank test. Source data are provided as a Source Data file.
Fig. 4
Fig. 4. Trajectory analysis from MDIM to M1 and M2 macrophages.
a Left panel shows a UMAP plot of RNA velocity of macrophage subpopulations. Arrow direction and length indicate qualitative and quantitative changes, respectively. The right panel shows box-plots of ranges (horizontal line), interquartile ranges (boxes), and medians (vertical lines) of arrow length using randomly subsampled cells (1/10 of total cells) included in each cluster in the left panel. b Pseudotime trajectory initiated from monocyte-derived infiltrating macrophages (MDIM) toward M1 macrophages (M1 route). c Left panel shows relative expression patterns of representative genes in the M1 route plotted along the pseudo time. The color indicates the relative gene expression calculated by Monocle 2. The right panel shows bar plots of the combined scores in the top-five enrichment analysis of the TRRUST database for transcription factor analysis, and representative GO biological pathways in clusters 1–4, as defined in the left panel. d Pseudotime trajectory initiated from MDIM toward M2 macrophages (M2 route). e Left panel shows relative expression patterns of representative genes in the M2 route plotted along the pseudo time. The right panel shows bar plots of combined scores in the top-five enrichment analysis of the TRRUST database for transcription factor analysis, and the representative GO biological pathways in clusters 1–4, as defined in the left panel. Source data are provided as a Source Data file.
Fig. 5
Fig. 5. GSEA of gene modules originated from the M1 route and M2 route.
a, b Gene set enrichment analysis (GSEA) of clusters 1–4 of the M1 route a. and M2 route b. using public transcriptome data, including post-mortem lung tissue from a COVID-19 patient (GSE147507) and lung tissue from a SARS-CoV-2-infected mouse (GSE150847). For calculating combined scores, upregulated genes derived from COVID-19 patients’ lung tissue and SARS-CoV-2-infected mouse lung were compared to the marker genes of pseudo time clusters of M1 or M2 route, which was calculated from the p value obtained using Fisher’s exact test and the z-score (see “Methods”). Commonly upregulated genes are listed in the box right side of each bar graph. c Experimental design to make dexamethasone and etanercept responsive gene sets for GSEA of clusters 1–4 of the M1 and M2 route. d, e GSEA of clusters 1–4 of the M1 route (c) and M2 route (d) using ranked gene list originated from dexamethasone-downregulated DEGs derived from in vitro experiment described in (c). The name of genes included as core enrichment was listed, NES normalized enrichment score. The p values of the combined score are calculated with a two-sided Fisher’s exact test. The p value of GSEA is the probability under the null distribution calculated by the permutation test. Source data are provided as a Source Data file.

References

    1. Gates B. Responding to Covid-19—a once-in-a-century pandemic? N. Engl. J. Med. 2020;382:1677–1679. doi: 10.1056/NEJMp2003762. - DOI - PubMed
    1. Bost P, et al. Host-viral infection maps reveal signatures of severe COVID-19 patients. Cell. 2020;181:1475–1488. doi: 10.1016/j.cell.2020.05.006. - DOI - PMC - PubMed
    1. Chua RL, et al. COVID-19 severity correlates with airway epithelium-immune cell interactions identified by single-cell analysis. Nat. Biotechnol. 2020;38:970–979. doi: 10.1038/s41587-020-0602-4. - DOI - PubMed
    1. Lee JS, et al. Immunophenotyping of COVID-19 and influenza highlights the role of type I interferons in development of severe COVID-19. Sci. Immunol. 2020;5:eabd1554. doi: 10.1126/sciimmunol.abd1554. - DOI - PMC - PubMed
    1. Brouwer PJM, et al. Potent neutralizing antibodies from COVID-19 patients define multiple targets of vulnerability. Science. 2020;369:643–650. doi: 10.1126/science.abc5902. - DOI - PMC - PubMed

Publication types