Impact of tiered restrictions on human activities and the epidemiology of the second wave of COVID-19 in Italy
- PMID: 34315899
- PMCID: PMC8316570
- DOI: 10.1038/s41467-021-24832-z
Impact of tiered restrictions on human activities and the epidemiology of the second wave of COVID-19 in Italy
Abstract
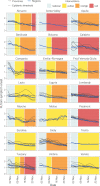
To counter the second COVID-19 wave in autumn 2020, the Italian government introduced a system of physical distancing measures organized in progressively restrictive tiers (coded as yellow, orange, and red) imposed on a regional basis according to real-time epidemiological risk assessments. We leverage the data from the Italian COVID-19 integrated surveillance system and publicly available mobility data to evaluate the impact of the three-tiered regional restriction system on human activities, SARS-CoV-2 transmissibility and hospitalization burden in Italy. The individuals' attendance to locations outside the residential settings was progressively reduced with tiers, but less than during the national lockdown against the first COVID-19 wave in the spring. The reproduction number R(t) decreased below the epidemic threshold in 85 out of 107 provinces after the introduction of the tier system, reaching average values of about 0.95-1.02 in the yellow tier, 0.80-0.93 in the orange tier and 0.74-0.83 in the red tier. We estimate that the reduced transmissibility resulted in averting about 36% of the hospitalizations between November 6 and November 25, 2020. These results are instrumental to inform public health efforts aimed at preventing future resurgence of cases.
© 2021. The Author(s).
Conflict of interest statement
M.A. has received research funding from Seqirus. The funding is not related to COVID-19. All other authors declare no other competing interests.
Figures


References
-
- Our World In Data. Daily new confirmed COVID-19 deaths per million people. (Europe, European Union, Italy). Accessed 8 February 2020: https://ourworldindata.org/coronavirus-data-explorer?zoomToSelection=tru... (2020).
-
- Istituto Superiore di Sanità. Epidemia COVID-19 - Aggiornamento nazionale 9 dicembre 2020. [In Italian] Accessed 18 December 2020; https://www.epicentro.iss.it/coronavirus/bollettino/Bollettino-sorveglia... (2020).
-
- Istituto Superiore di Sanità. Impact of the COVID-19 epidemics on total mortality of the resident population. [In Italian] Accessed 8 February 2020: https://www.iss.it/documents/20126/0/Rapporto+ISS+COVID-19+n.+1_2021.pdf... (2020).
-
- Official Gazette of the Italian Republic. Decree of Italian President of Council of Ministers of 13 October 2020. [In Italian]. Accessed on December 18, 2020; https://www.gazzettaufficiale.it/eli/id/2020/10/13/20A05563/sg (2020).
-
- Official Gazette of the Italian Republic. Decree of Italian President of Council of Ministers of 18 October 2020. [In Italian] Accessed 18 December 2020; https://www.gazzettaufficiale.it/eli/id/2020/10/18/20A05727/sg (2020).
Publication types
MeSH terms
Associated data
LinkOut - more resources
Full Text Sources
Medical
Miscellaneous

