. 2021 Jul 27;12(1):4549.
doi: 10.1038/s41467-021-24800-7.

Functional and epigenetic phenotypes of humans and mice with DNMT3A Overgrowth Syndrome

Affiliations

Functional and epigenetic phenotypes of humans and mice with DNMT3A Overgrowth Syndrome

Amanda M Smith et al. Nat Commun. .

Abstract

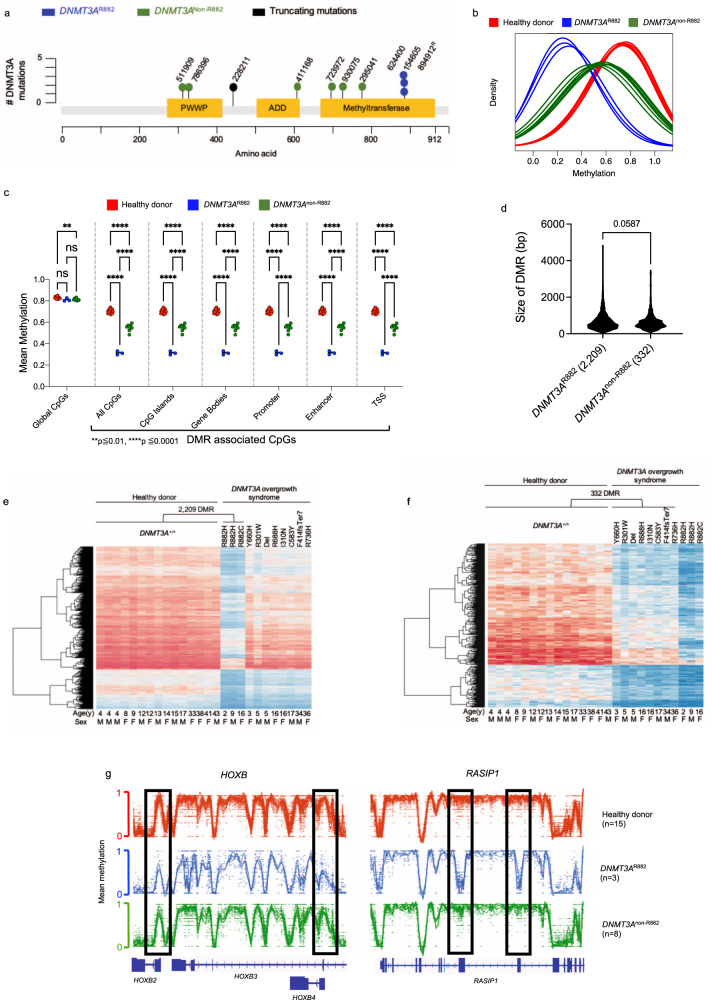
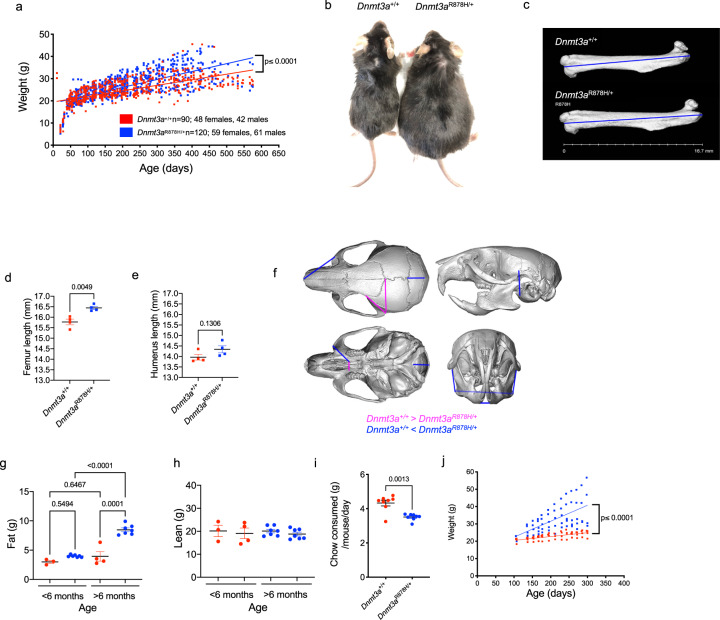
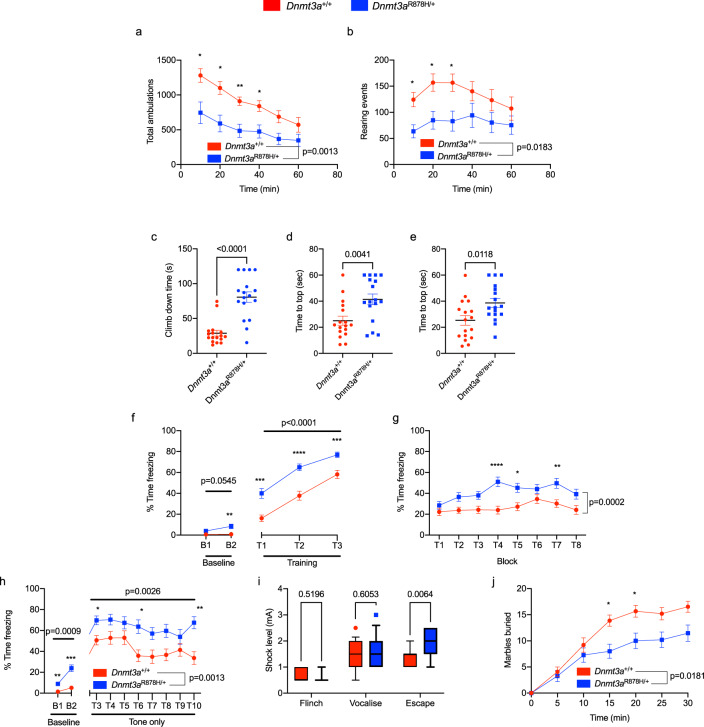
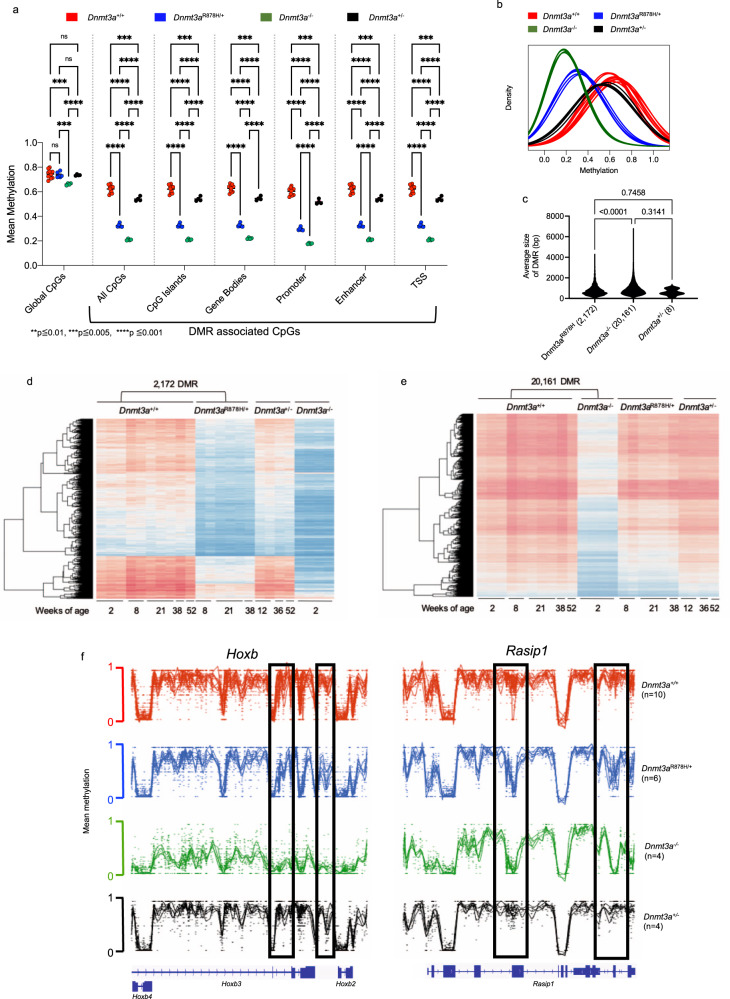
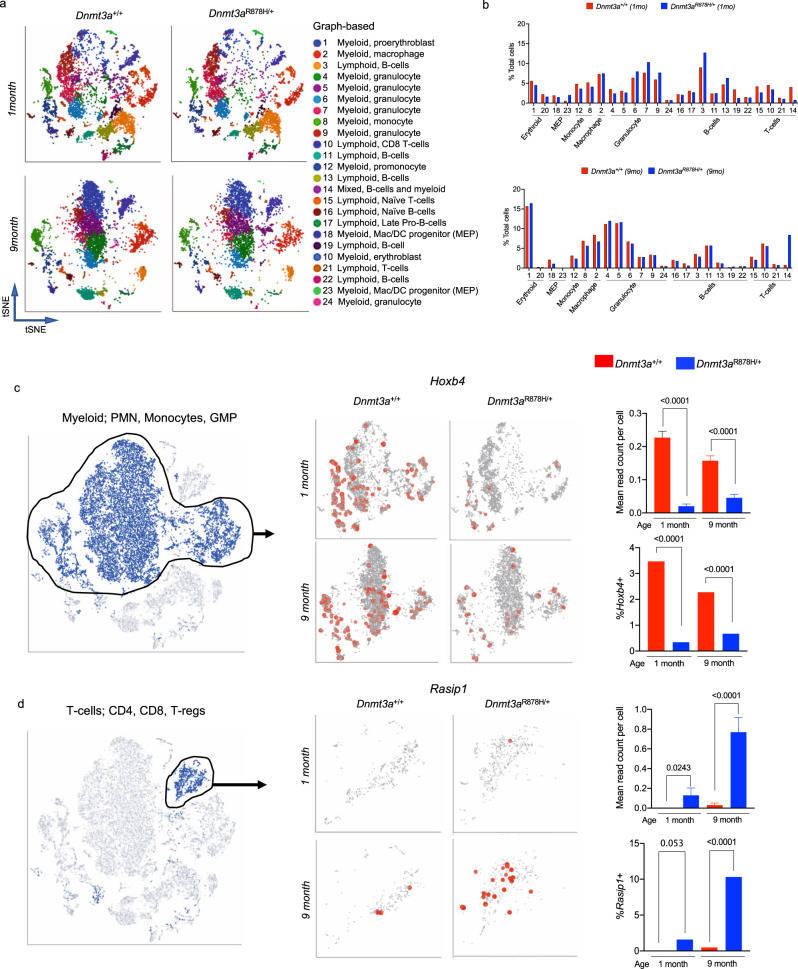
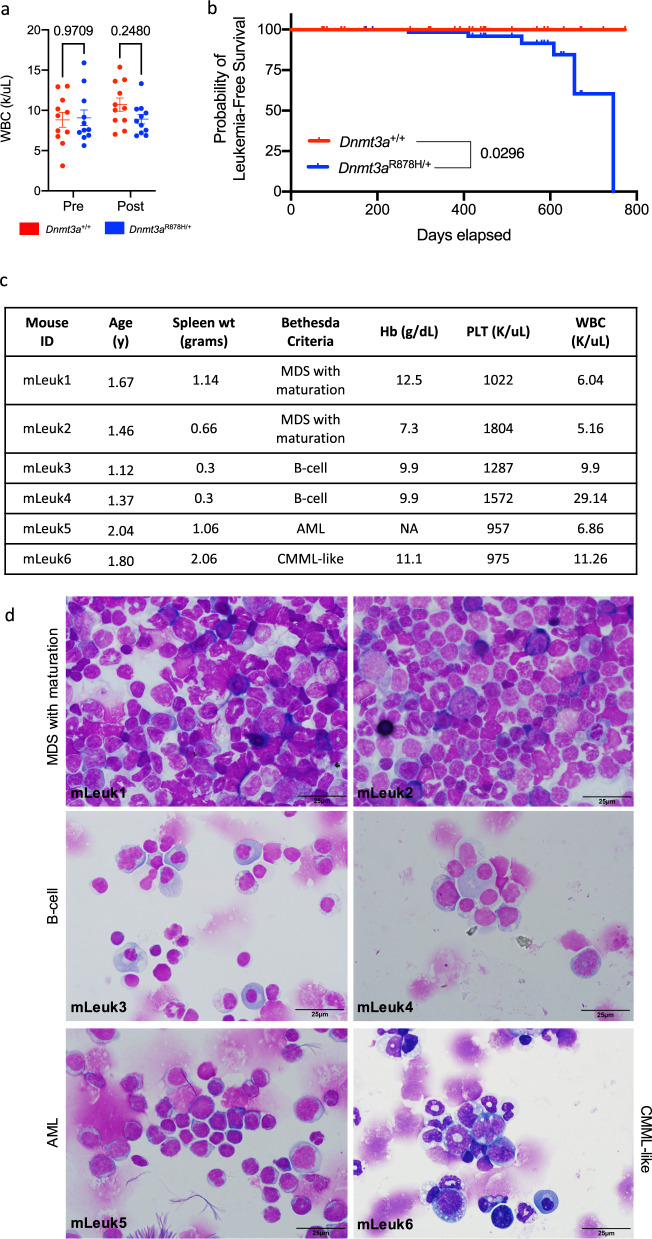
Germline pathogenic variants in DNMT3A were recently described in patients with overgrowth, obesity, behavioral, and learning difficulties (DNMT3A Overgrowth Syndrome/DOS). Somatic mutations in the DNMT3A gene are also the most common cause of clonal hematopoiesis, and can initiate acute myeloid leukemia (AML). Using whole genome bisulfite sequencing, we studied DNA methylation in peripheral blood cells of 11 DOS patients and found a focal, canonical hypomethylation phenotype, which is most severe with the dominant negative DNMT3AR882H mutation. A germline mouse model expressing the homologous Dnmt3aR878H mutation phenocopies most aspects of the human DOS syndrome, including the methylation phenotype and an increased incidence of spontaneous hematopoietic malignancies, suggesting that all aspects of this syndrome are caused by this mutation.


Conflict of interest statement

The authors declare no competing interests.

Figures

Fig. 1
Fig. 1. Peripheral blood cells of DOS patients with DNMT3AR882 mutations have a more severe methylation phenotype than non-R882 mutations.
a Distribution of germline DNMT3A mutations identified in DOS patients from this study. b Density plot of methylation values from whole-genome bisulfite sequencing (WGBS) for CpGs within DMRs for each peripheral blood sample from healthy donors (red; n = 15), DNMT3AR882 (blue, n = 3), and DNMT3Anon-R882 (green, n = 8) patients. c Mean methylation values for both global CpGs and DMR-associated CpGs in specific, annotated regions of the genome. Hypothesis testing was performed via two-way repeated-measures ANOVA with Tukey’s multiple comparison test within each genomic region. (ns = not significant, **p ≦ 0.01, ****p ≦ 0.001). d Mean Size (in bp) of DMRs identified in DNMT3AR882 (n = 2,209) and DNMT3Anon-R882 (n = 332) peripheral blood samples (P = 0.0587, two-tailed t test). e Heatmap showing the mean methylation values for the 2209 DMRs defined in b for each individual healthy donor and DNMT3AR882 sample. The values for the same DMRs were also plotted passively for DNMT3Anon-R882 samples (age and sex shown below). f Heatmap showing the mean CpG methylation values for the 332 DMRs defined by comparing the healthy donors and DNMT3Anon-R882 samples. Values for the same DMRs were plotted passively for DNMT3AR882 samples (age and sex shown below). g Examples of DMRs within the HOXB cluster and RASIP1 gene. Healthy donors are shown in red, DNMT3AR882 cases in blue, and DNMT3Anon-R882 cases in green. Gene tracks are shown below, and DMRs are designated in boxes. DMR differentially methylated region, bp base pairs, TSS transcriptional start site.
Fig. 2
Fig. 2. Peripheral blood cells of a DOS patient with an DNMT3AR882 mutation have differentially expressed genes.
a tSNE projection of scRNA-seq data from peripheral blood derived from one DOS patient with an R882 mutation (right; UPN 624400, age 14 at collection) and his matched DNMT3A+/+ sibling control sample (left; UPN 978897, age 17 at collection). Graph-based clustering identified 12 distinct clusters that were functionally categorized by gene-expression analysis utilizing Toppfun. b The percentage contribution of each graph-based cluster associated with scRNA-seq data shown in Panel a. c Numbers of upregulated (red bars) and downregulated (blue bars) genes in each graph-based cluster. d The heatmap of 50 differentially expressed genes identified as dysregulated in more than one graph-based cluster. e Examples of two differentially expressed genes (HOXB2 and RASIP1) identified in more than one graph-based cluster (highlighted in Panel d with red arrows) and associated with a differentially methylated region; tSNE projections, mean read counts per cell + SEM, and percentage of cells expressing each gene are shown (P-values by t test or Fisher’s exact test for ratio’s are indicated, n = 1 biologically independent samples per genotype). DEG differentially expressed genes.
Fig. 3
Fig. 3. Germline Dnmt3aR878H/+ mice exhibit overgrowth and obesity.
a Weight in grams of Dnmt3a+/+ control mice (red, n = 90) and Dnmt3aR878H/+ mice (blue, n = 120) from weaning (day 21) to 575 days of age. Linear regression analysis was used to determine differences between genotypes (p ≤ 0.0001). b Representative image of age and gender-matched littermate Dnmt3a+/+ (30.9 g) vs. Dnmt3aR878H/+ (59.45 g) mice highlighting a typical size difference at 1 year of age. c Representative CT images of femurs from whole mouse imaging. Measurements of femur length (mm) in Dnmt3a+/+ and Dnmt3aR878H/+ age-matched controls are shown (n = 4 each genotype). d Quantification of femur lengths (mm) measured as shown in b (n = 4 biologically independent samples/genotype, P = 0.0049 by two-tailed t test). e Quantification of humerus lengths (mm) in the same mice, measured by CT scan (n = 4 biologically independent samples/genotype, p-value by two-tailed t test). f Reconstructions of cranium and mandible from CT scans of Dnmt3a+/+ and Dnmt3aR878H/+ mice showing landmarks of differences in size and angles. g The MRI quantification of body fat composition of age-matched Dnmt3a+/+ (red, n = 4) and Dnmt3aR878H/+ (blue, n = 7) pairs separated by age (less or greater than 6 months), to highlight age-dependent increases in body fat (P-values by two-way ANOVA with Tukey’s multiple comparisons test are indicated). h The MRI quantification of lean body mass composition of age-matched Dnmt3a+/+ (red, n = 4) and Dnmt3aR878H/+ (blue, n = 7) pairs separated by age (less or greater than 6 months). i Quantification of chow consumed (calculated as grams of chow per mouse per day) for age-matched Dnmt3a+/+ (red, n = 8) and Dnmt3aR878H/+ (blue, n = 8) mice (P = 0.0013 by two-tailed t test). j Weight tracking in grams of Dnmt3a+/+ control mice (red, n = 4) and Dnmt3aR878H/+ mice (blue, n = 6) fed a high-fat diet from 100 to 300 days of age. Linear regression analysis was used to determine differences between genotypes (p ≤ 0.0001). For d, e, g-i error bars show mean ± SEM. g grams, mm millimeter.
Fig. 4
Fig. 4. Germline Dnmt3aR878H/+ mice exhibit behavioral alterations.
a Total ambulations during 1-hour open-field testing, split into 10-minute intervals (p = 0.0013 effect by genotype, F(1,32) = 12.5, n = 17,17; two-way repeated-measures ANOVA with Šídák’s multiple comparison test). b The number of rearing events during 1-hour open-field testing, split into 10-minute intervals (p = 0.0183 effect by genotype, F(1,32) = 6.183, n = 17,17; two-way repeated-measures ANOVA with Šídák’s multiple comparison test). Dnmt3aR878H/+ mice take significantly longer to c climb down a pole (p ≤ 0.0001, n = 17,17; unpaired t test), reach the top of a d 60° inclined screen (p = 0.0041, n = 17,17; unpaired t test) and e 90° inclined screen (p = 0.0118, n = 17,17; unpaired t test). Panels fh The percentage of time freezing in f conditioned fear training (cue: p ≤ 0.0001 genotype effect, F(1,31) = 28.02, n = 16,17; two-way repeated-measures ANOVA with Šídák’s multiple comparison test), g contextual fear trials (p = 0.0002 genotype effect, F(1,31) = 18.53, n = 16,17; two-way repeated-measures ANOVA with Šídák’s multiple comparison test) and h cued fear trials (baseline: p = 0.0009 genotype effect, F(1,31) = 31.02; cue: p = 0.0026 genotype effect F(1,31) = 10.76, n = 16,17; two-way repeated-measures ANOVA with Šídák’s multiple comparison test). i Minimum shock needed to exhibit a behavioral response in mice during conditioned fear test (escape: p = 0.0064 genotype effect F(1,31) = 5.094, n = 16,17; two-way repeated-measures ANOVA with Šídák’s multiple comparison test). The box extends from 25th to 75th percentile, the line indicates median and whiskers show 10th to 90th percentile. j Marbles buried in 30 min (5 min bins, p = 0.0181, genotype effect F(1,28) = 6.307, n = 15,15; two-way repeated-measures ANOVA with Šídák’s multiple comparison test). *p ≤ 0.05, **p ≤ 0.01, ***p ≤ 0.001, ****p ≤ 0.0001. The line and bar graphs indicate the mean and SEM for each value tested. min minutes, s seconds, mA milliamps.
Fig. 5
Fig. 5. Germline Dnmt3aR878H/+ mice exhibit focal, canonical DNA hypomethylation in bone marrow cells.
a The mean methylation values for both global CpGs, and DMR-contained CpGs, in annotated regions of the genome are shown. Hypothesis testing was performed using two-way repeated-measures ANOVA with Tukey’s multiple comparison test within each genomic region. b The density plot of methylation values from whole-genome bisulfite sequencing (WGBS) for differentially methylated regions (DMRs) defined by comparing Dnmt3a+/+ and germline Dnmt3aR878H/+ for each whole bone marrow sample from Dnmt3a+/+ (red, n = 10), Dnmt3aR878H/+ (blue, n = 6), Dnmt3a+/- (black, n = 4) and Dnmt3a-/- mice (green, n = 4). c The mean size (bp) for all DMRs identified in Dnmt3aR878H/+ (n = 2,172), Dnmt3a+/- (n = 8), and Dnmt3a-/- (n = 20,161) bone marrow cells when independently compared to Dnmt3a+/+ controls (P-values by one-way ANOVA with Tukey’s multiple comparisons test shown). d The heatmap showing mean methylation values for the 2172 DMRs defined in Panel b for each individual Dnmt3a+/+ and Dnmt3aR878H/+ sample. Values for the same DMRs were plotted passively for Dnmt3a+/- and Dnmt3a-/- samples. e The heatmap showing mean CpG methylation values for the 20,161 DMRs defined by comparing the Dnmt3a+/+ and Dnmt3a-/-samples. Values for the same DMRs were plotted passively for Dnmt3aR878H/+ and Dnmt3a+/-. f Examples of Dnmt3a-dependent hypomethylated regions in the Hoxb cluster (left) and the Rasip1 gene (right). The locations of DMRs in each gene are indicated in boxes. DMR differentially methylated region, bp base pairs, TSS transcriptional start site.
Fig. 6
Fig. 6. Germline Dnmt3aR878H/+ mice have differentially expressed genes in hematopoietic cells.
a tSNE projections of scRNA-seq data from whole bone marrow samples from Dnmt3a+/+ (left, n = 2) and Dnmt3aR878H/+ (right, n = 2) mice at 1 month and 9 months of age, showing known populations defined by graph-based clustering and defined by ToppGene. b Population fractions associated with scRNA-seq data shown in Panel a by genotype and age. c and d Examples of differentially expressed genes identified in both humans and mice, and in more than one graph-based cluster, and associated with a differentially methylated region; tSNE projection, read counts per cell in all cells, and percentage of myeloid cells expressing Hoxb4 (panel c) and T-cells expressing Rasip1 (Panel d) are shown (Data are presented as mean values + /- SEM. P-values by two-tailed t test or Fisher’s exact test for ratios are indicated, n = 2 biologically independent samples per genotype). PMN polymorphonuclear leukocyte, GMP granulocyte-monocyte precursor.
Fig. 7
Fig. 7. Germline Dnmt3aR878H/+ mice develop hematopoietic malignancies.
a Dnmt3a+/+ (n = 11) and Dnmt3aR878H/+ (n = 11) mice were treated with 3 mg/kg doxorubicin for days 1–3 and 100 mg/kg cytarabine for days 1–5 administered by tail vein injection, and total peripheral blood white cell counts were assessed before and 24 days after chemotherapy. Individual data points are presented and mean values + /- SEM are shown. P-values were calculated by two-way ANOVA and Šídák’s multiple comparisons test. b Kaplan–Meier curve of leukemia-free survival over time for Dnmt3a+/+ (n = 65) and Dnmt3aR878H/+ mice (n = 79). c) Characteristics of six spontaneous hematopoietic malignancies arising in Dnmt3aR878H/+ mice. d May–Grünwald Giemsa stained cytospins of spleen or bone marrow samples from spontaneous malignancies arising in Dnmt3aR878H/+ mice, as summarized in c. WBC (K/uL) white blood cells (x1000/mL), pre pre-chemotherapy, Post postchemotherapy, y years, Hb (g/dL) hemoglobin (grams/decilitre), PLT (K/uL) platelets (x1000/mL), MDS myelodysplastic syndrome, AML acute myeloid leukemia, CMML chronic myelomonocytic leukemia.

References

    1. Tatton-Brown K, et al. Mutations in the DNA methyltransferase gene DNMT3A cause an overgrowth syndrome with intellectual disability. Nat. Genet. 2014;46:385–388. doi: 10.1038/ng.2917. - DOI - PMC - PubMed
    1. Tatton-Brown K, et al. The Tatton-Brown-Rahman Syndrome: a clinical study of 55 individuals with de novo constitutive DNMT3A variants. Wellcome Open Res. 2018;3:46. doi: 10.12688/wellcomeopenres.14430.1. - DOI - PMC - PubMed
    1. Balci TB, et al. Tatton-Brown-Rahman syndrome: six individuals with novel features. Am. J. Med Genet A. 2020;182:673–680. doi: 10.1002/ajmg.a.61475. - DOI - PubMed
    1. Hollink I, et al. Acute myeloid leukaemia in a case with Tatton-Brown-Rahman syndrome: the peculiar DNMT3A R882 mutation. J. Med Genet. 2017;54:805–808. doi: 10.1136/jmedgenet-2017-104574. - DOI - PubMed
    1. Jeffries AR, et al. Growth disrupting mutations in epigenetic regulatory molecules are associated with abnormalities of epigenetic aging. Genome Res. 2019;29:1057–1066. doi: 10.1101/gr.243584.118. - DOI - PMC - PubMed

Publication types

MeSH terms

Substances

LinkOut - more resources