. 2021 Jul 27;11(1):15265.
doi: 10.1038/s41598-021-94048-0.

Correlation between Alzheimer's disease and type 2 diabetes using non-negative matrix factorization

Collaborators, Affiliations

Correlation between Alzheimer's disease and type 2 diabetes using non-negative matrix factorization

Yeonwoo Chung et al. Sci Rep. .

Abstract

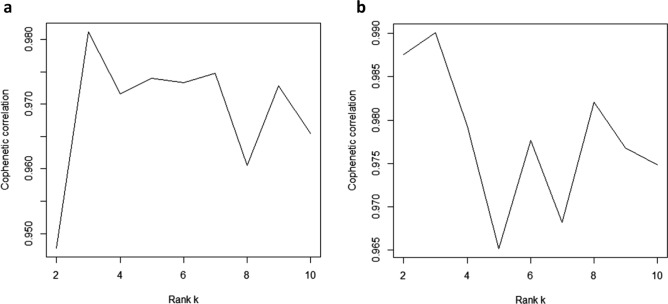
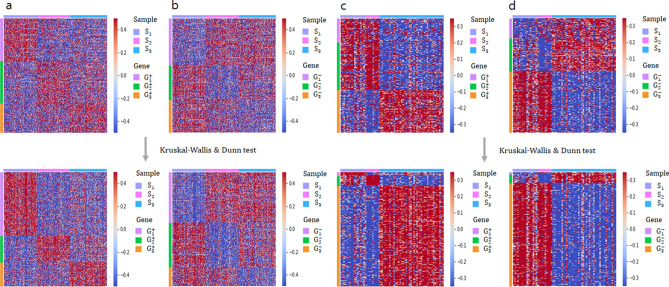
Alzheimer's disease (AD) is a complex and heterogeneous disease that can be affected by various genetic factors. Although the cause of AD is not yet known and there is no treatment to cure this disease, its progression can be delayed. AD has recently been recognized as a brain-specific type of diabetes called type 3 diabetes. Several studies have shown that people with type 2 diabetes (T2D) have a higher risk of developing AD. Therefore, it is important to identify subgroups of patients with AD that may be more likely to be associated with T2D. We here describe a new approach to identify the correlation between AD and T2D at the genetic level. Subgroups of AD and T2D were each generated using a non-negative matrix factorization (NMF) approach, which generated clusters containing subsets of genes and samples. In the gene cluster that was generated by conventional gene clustering method from NMF, we selected genes with significant differences in the corresponding sample cluster by Kruskal-Wallis and Dunn-test. Subsequently, we extracted differentially expressed gene (DEG) subgroups, and candidate genes with the same regulation direction can be extracted at the intersection of two disease DEG subgroups. Finally, we identified 241 candidate genes that represent common features related to both AD and T2D, and based on pathway analysis we propose that these genes play a role in the common pathological features of AD and T2D. Moreover, in the prediction of AD using logistic regression analysis with an independent AD dataset, the candidate genes obtained better prediction performance than DEGs. In conclusion, our study revealed a subgroup of patients with AD that are associated with T2D and candidate genes associated between AD and T2D, which can help in providing personalized and suitable treatments.


Conflict of interest statement

The authors declare no competing interests

Figures

Figure 1
Figure 1
Procedure for relation extraction between two diseases. (a) Gene expression data of AD and T2D patients are given. (b) The convex non-negative matrix factorization (NMF) is used to decompose the input expression matrices. Gene and sample clusters are obtained from the NMF decomposed matrices. (c) DEG genes are assigned to clusters. (d) Common candidate genes are extracted from a related cluster pair between two diseases. (b) is generated by the R software (R version 3.6.1, https://www.r-project.org/) using an example dataset.
Figure 2
Figure 2
Cophenetic correlation coefficients for the consensus matrix in (a) Alzheimer’s disease (AD) and (b) type 2 diabetes (T2D) datasets.
Figure 3
Figure 3
Heatmap of gene clustering method in Alzheimer’s disease (AD) and type 2 diabetes (T2D). (a) and (b) show genes and sample clusters from AD patients. (c) and (d) show genes and sample clusters from T2D patients. Top panels show clusters obtained using the basic “Max” ((a) and (c)) and “Min” ((b) and (d)) methods. Bottom panels show clusters obtained using the Kruskal–Wallis and Denn test for relatively upregulated genes ((a) and (c)) and relatively downregulated genes ((b) and (d)). This figure is generated by the R software (R version 3.6.1, https://www.r-project.org/) and python (version 3.6.8, https://www.python.org/).
Figure 4
Figure 4
Performance comparison of Alzheimer’s disease (AD) classification from controls based on the area under the curve (AUC) using different gene sets.

References

    1. Brookmeyer R, Johnson E, Ziegler-Graham K, Arrighi HM. Forecasting the global burden of Alzheimer’s disease. Alzheimer’s Dement. 2007;3:186–191. doi: 10.1016/j.jalz.2007.04.381. - DOI - PubMed
    1. Barker WW, et al. Relative frequencies of Alzheimer disease, Lewy body, vascular and frontotemporal dementia, and hippocampal sclerosis in the state of Florida Brain Bank. Alzheimer Dis. Assoc. Disord. 2002;16:203–212. doi: 10.1097/00002093-200210000-00001. - DOI - PubMed
    1. van Oijen M, de Jong FJ, Hofman A, Koudstaal PJ, Breteler MM. Subjective memory complaints, education, and risk of Alzheimer’s disease. Alzheimer’s Dement. 2007;3:92–97. doi: 10.1016/j.jalz.2007.01.011. - DOI - PubMed
    1. Armstrong RA. The molecular biology of senile plaques and neurofibrillary tangles in Alzheimer’s disease. Folia Neuropathol. 2009;47:289–99. - PubMed
    1. Gouras GK, Olsson TT, Hansson O. β-amyloid peptides and amyloid plaques in Alzheimer’s disease. Neurotherapeutics. 2015;12:3–11. doi: 10.1007/s13311-014-0313-y. - DOI - PMC - PubMed

Publication types