. 2021 Jul 27;4(1):118.
doi: 10.1038/s41746-021-00483-8.

Performance evaluation of a prescription medication image classification model: an observational cohort

Affiliations

Performance evaluation of a prescription medication image classification model: an observational cohort

Corey A Lester et al. NPJ Digit Med. .

Erratum in

Abstract

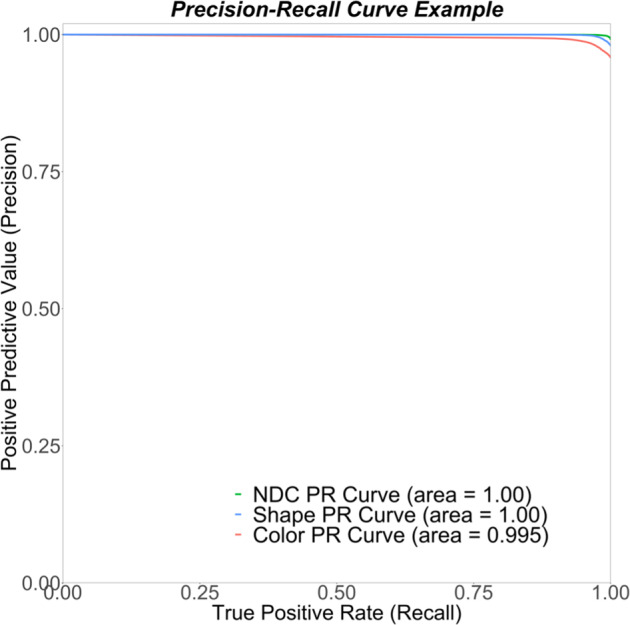
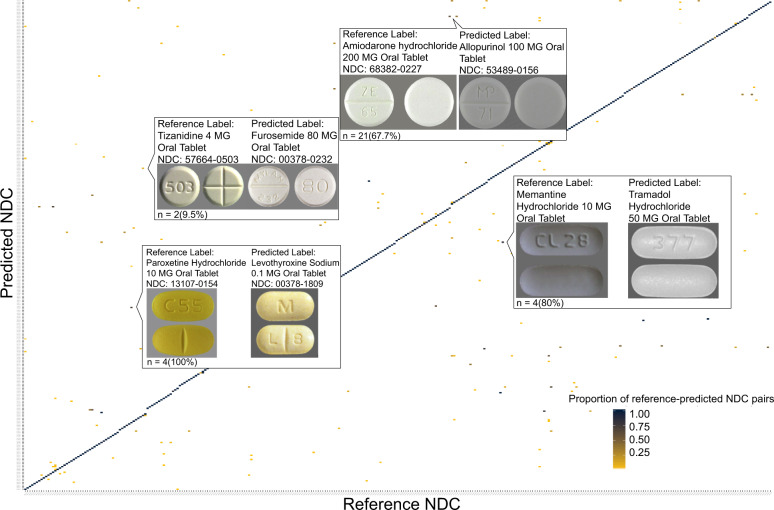
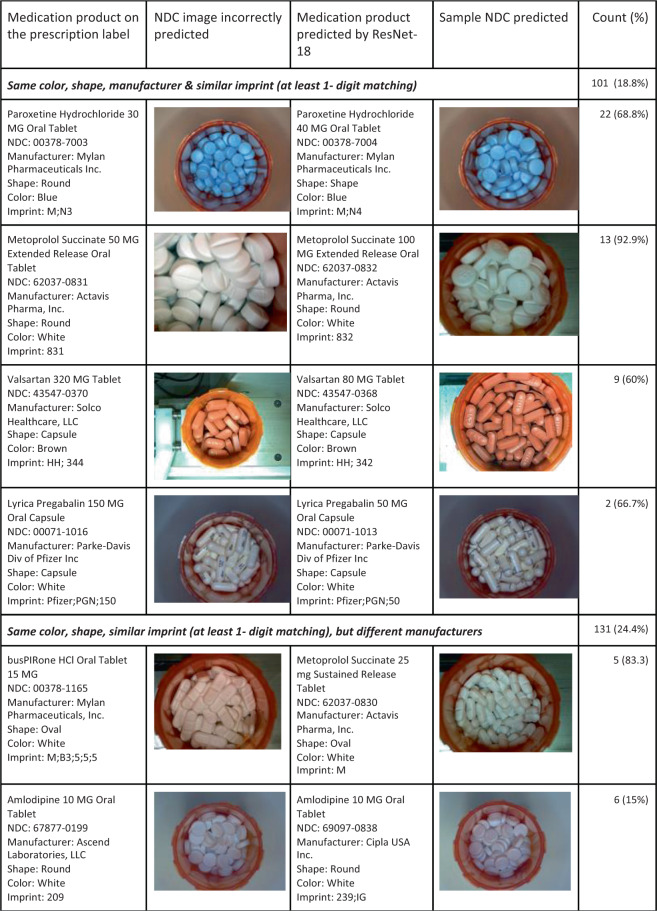
Technology assistance of pharmacist verification tasks through the use of machine intelligence has the potential to detect dangerous and costly pharmacy dispensing errors. National Drug Codes (NDC) are unique numeric identifiers of prescription drug products for the United States Food and Drug Administration. The physical form of the medication, often tablets and capsules, captures the unique features of the NDC product to help ensure patients receive the same medication product inside their prescription bottle as is found on the label from a pharmacy. We report and evaluate using an automated check to predict the shape, color, and NDC for images showing a pile of pills inside a prescription bottle. In a test set containing 65,274 images of 345 NDC classes, overall macro-average precision was 98.5%. Patterns of incorrect NDC predictions based on similar colors, shapes, and imprints of pills were identified and recommendations to improve the model are provided.


Conflict of interest statement

The authors declare no competing interests.

Figures

Fig. 1
Fig. 1. Precision-recall curves for prediction of medication image components.
AUC-PR is used as a measure of how well the classifier distinguishes between classes. In our work, the higher the AUC, the better the models are at predicting the NDC, color, or shape. The NDC and the shape model achieved an AUC-PR of almost 1.00 indicating that decision thresholds could be established to minimize both false-positive and false-negative events.
Fig. 2
Fig. 2. Confidence histogram and reliability diagram for the National Drug Code prediction model on the test dataset.
a The confidence histogram shows the percentage of samples falling into each forecasted probability bin, while (b) the reliability diagram plots the observed predicted probability accuracy against the expected probability, where the range of forecasted probabilities is divided into ten bins (i.e., 0–0.1, 0.1–0.2, 0.2–0.3, etc.). Error bars in the reliability diagram represent 95% confidence intervals for each bin and the numbers of images in each bin are 45, 17, 36, 115, 153, 285, 287, 471, 1063, 62,802, respectively.
Fig. 3
Fig. 3. Confusion matrix normalized by proportion of all predicted and reference National Drug Code images.
Proportion equal to the predicted National Drug Code (NDC) count for given reference image divided by the count of all reference images of that NDC). 1 = the same NDC was predicted each time; 0 = no cases of reference image being a particular predicted NDC.
Fig. 4
Fig. 4. Frequency of the medication National Drug Code incorrectly predicted by the machine sharing similar characteristics.
The left-hand columns show an incorrect National Drug Code (NDC) predicted image along with description of the prescription label. The right-hand columns show an example image of the NDC predicted by the machine.

References

    1. Holmström A-R, et al. Inter-rater reliability of medication error classification in a voluntary patient safety incident reporting system HaiPro in Finland. Res. Soc. Adm. Pharm. 2019;15:864–872. doi: 10.1016/j.sapharm.2018.11.013. - DOI - PubMed
    1. Lester CA, Kessler JM, Modisett T, Chui MA. A text mining analysis of medication quality related event reports from community pharmacies. Res. Soc. Adm. Pharm. 2019;15:845–851. doi: 10.1016/j.sapharm.2018.09.013. - DOI - PMC - PubMed
    1. James KL, et al. Incidence, type and causes of dispensing errors: a review of the literature. Int. J. Pharm. Pract. 2009;17:9–30. doi: 10.1211/ijpp.17.1.0004. - DOI - PubMed
    1. Reiner, G., Pierce, S. L. & Flynn, J. Wrong drug and wrong dose dispensing errors identified in pharmacist professional liability claims. J. Am. Pharm. Assoc. 60, e50–e56 10.1016/j.japh.2020.02.027 (2020). - PubMed
    1. Scott DM, Friesner DL, Rathke AM, Peterson CD, Anderson HC. Differences in medication errors between central and remote site telepharmacies. J. Am. Pharm. Assoc. 2012;52:e97–e104. doi: 10.1331/JAPhA.2012.11119. - DOI - PubMed