. 2021 Nov;45(11):2316-2334.
doi: 10.1038/s41366-021-00899-y. Epub 2021 Jul 27.

Socioeconomic position and body composition in childhood in high- and middle-income countries: a systematic review and narrative synthesis

Affiliations

Socioeconomic position and body composition in childhood in high- and middle-income countries: a systematic review and narrative synthesis

Charis Bridger Staatz et al. Int J Obes (Lond). 2021 Nov.

Abstract

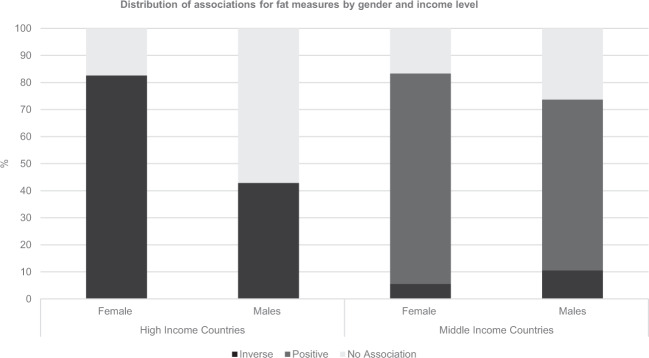
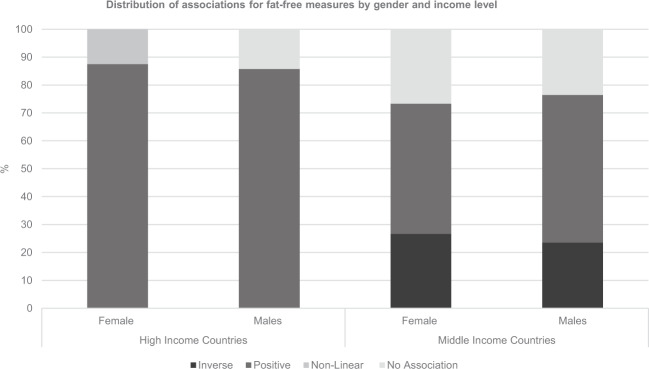
Background: The relation between socioeconomic position (SEP) and obesity measured by body mass index (BMI), a measure of weight for height, has been extensively reviewed in children, showing consistent associations between disadvantaged SEP and higher BMI in high-income countries (HICs) and lower BMI in middle-income countries (MICs). Fat mass (FM), a more accurate measure of adiposity, and fat-free mass (FFM) are not captured by BMI, but have been shown to track from childhood to adulthood, and be important for cardiovascular health and functional outcomes in later life. It is not clear whether body composition is associated with SEP. We systematically reviewed the association between SEP and body composition in childhood.

Methods: A systematic review was carried out following PRISMA guidelines. The protocol was pre-registered with PROSPERO (CRD42019119937). Original studies in the English language, which examined the association between SEP and body composition in childhood, were included. An electronic search of three databases was conducted. Two independent reviewers carried out screening, data extraction and quality assessment. Due to heterogeneity in results, a narrative synthesis was conducted. Heterogeneity in findings according to SEP, sex, body composition measure and country income level was investigated.

Results: 50 papers were included, the majority from HICs. No papers were from low-income countries. Disadvantage in childhood was associated with greater FM and lower FFM in HICs, but with lower FM and lower FFM in MICs. When measures of FFM indexed to height were used there was no evidence of associations with SEP. In HICs, more studies reported associations between disadvantaged SEP and higher FM among girls comparative to boys.

Conclusions: Inequalities in FM are evident in HICs and, in the opposite direction, in MICs and follow similar trends to inequalities for BMI. Inequalities in height are likely important in understanding inequalities in FFM.


Conflict of interest statement

The authors declare no competing interests.

Figures

Fig. 1
Fig. 1. Study selection process outlined with PRISMA flow chart.
Because reasons for exclusion are not mutually exclusive, numbers given for reasons for exclusion during full text-screening stage equal more than the total excluded at this stage (n = 422). Number of studies identified in adults and children is greater than total full texts included in the review, as one paper covered childhood and adulthood and was used in both reviews. 1 Studies in adults are reported on elsewhere.
Fig. 2
Fig. 2. Distribution of associations for fat measures by gender and income level.
Girls in HICs (N = 23): 83% negative associations, 0% positive associations, 0% non-linear associations, 17% show no association; Boys in HICs (N = 21): 43% negative associations, 0% positive associations, 0% non-linear associations, 57% show no association; Girls in MICs (N = 18) 6% negative associations, 78% positive associations, 0% non-linear associations, 17% show no association; Boys in MICs (N = 9) 11% negative associations, 63% positive associations, 0% non-linear associations, 26% show no association.
Fig. 3
Fig. 3. Distribution of associations for fat-free measures by gender and income level.
Girls in HICs (N = 8): 0% negative associations, 87.5% positive associations, 12.5% non-linear associations, 40% show no association; Boys in HICs (N = 7): 0% negative associations, 86% positive associations, 0% non-linear associations, 14% show no association; Girls in MICs (N = 15) 27% negative associations, 47% positive associations, 0% non-linear associations, 27% show no association; Boys in MICs (N = 17) 24% negative associations, 53% positive associations, 0% non-linear associations, 24% show no association.

References

    1. Simmonds M, Llewellyn A, Owen CG, Woolacott N. Predicting adult obesity from childhood obesity: a systematic review and meta-analysis. Obes Rev. 2016;17:95–107. doi: 10.1111/obr.12334. - DOI - PubMed
    1. Shrewsbury V, Wardle J. Socioeconomic status and adiposity in childhood: a systematic review of cross-sectional studies 1990-2005. Obesity. 2008;16:275–84. doi: 10.1038/oby.2007.35. - DOI - PubMed
    1. Barriuso L, Miqueleiz E, Albaladejo R, Villanueva R, Santos JM, Regidor E. Socioeconomic position and childhood-adolescent weight status in rich countries: a systematic review, 1990-2013. BMC Pediatr. 2015;15:129. doi: 10.1186/s12887-015-0443-3. - DOI - PMC - PubMed
    1. Sobal J, Stunkard AJ. Socioeconomic status and obesity: a review of the literature. Psychol Bull. 1989;105:260–75. doi: 10.1037/0033-2909.105.2.260. - DOI - PubMed
    1. Wells JC, Fewtrell MS. Measuring body composition. Arch Dis Child. 2006;91:612–7. doi: 10.1136/adc.2005.085522. - DOI - PMC - PubMed

Publication types