. 2021 Jan;31(1):185-192.
doi: 10.1055/s-0041-1729766. Epub 2021 May 23.

Demystifying Sacral Masses: A Pictorial Review

Affiliations

Demystifying Sacral Masses: A Pictorial Review

Julie Senne et al. Indian J Radiol Imaging. 2021 Jan.

Abstract

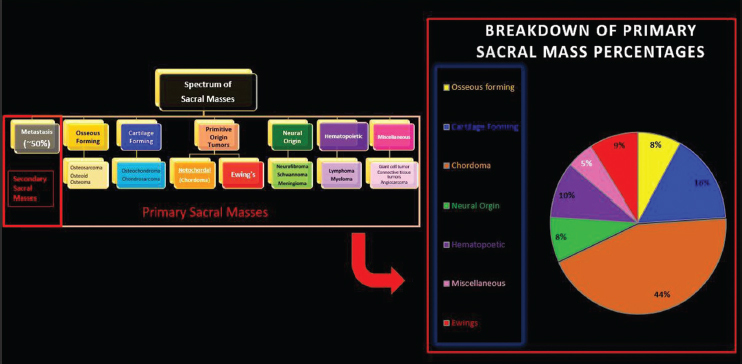
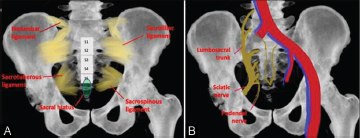
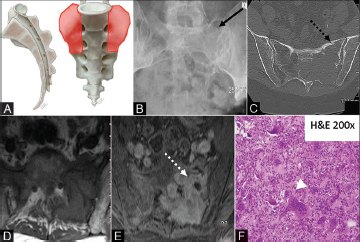
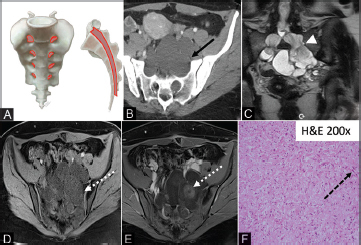
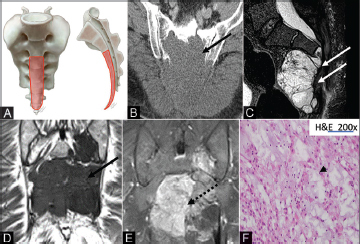
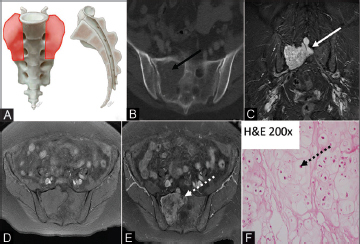
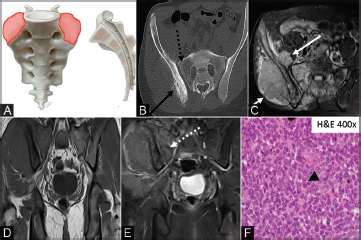
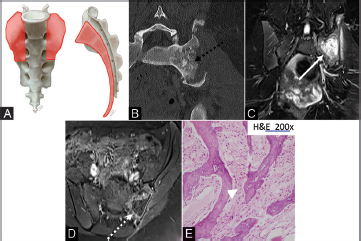
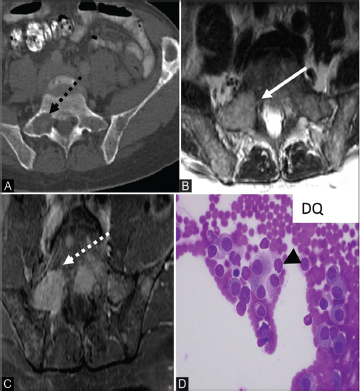
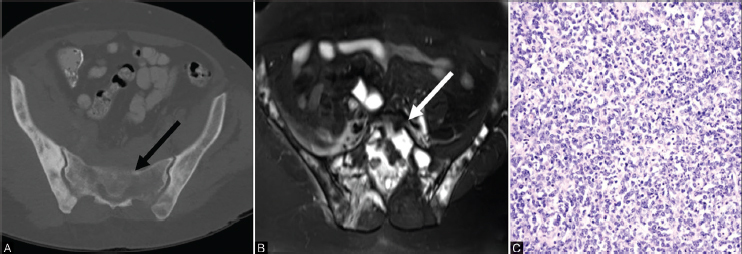
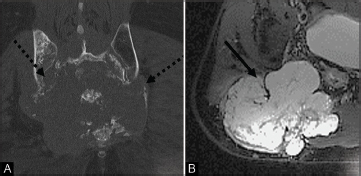
The sacrum is a triangular shaped bone made up of five fused vertebral bodies. It is composed of bone, cartilage, marrow elements as well as notochord remnants and is a common site for both benign and malignant (primary and secondary) tumors. Familiarity with the imaging features and clinical presentations of sacral bone tumors could be helpful in narrowing the differential diagnosis. Magnetic resonance imaging and computed tomography are the preferred imaging modalities for evaluating sacral masses. This pictorial review will highlight imaging features of common sacral tumors with pathologic correlation. Additionally, this article will review some critical principles and helpful tips to successfully biopsy these lesions.

Keywords: chondrosarcoma; chordoma; giant cell tumor; metastasis; osteosarcoma; sacrum.


Conflict of interest statement

Conflicts of InterestFinancial Support and Sponsorship There are no conflicts of interest. Nil.

Figures

Fig. 1
Fig. 1
Pie chart showing the relative incidence of various types of sacral masses.
Fig. 2
Fig. 2
( A and B ) Illustration of the sacrum showing the stabilizing ligaments (A), and vessels and nerves (B).
Fig. 3
Fig. 3
( A–F ) Illustration (A) showing the characteristic location for sacral giant cell tumor (orange shaded areas), most commonly arising eccentrically and frequently traversing the sacroiliac joint. Radiograph of the pelvis (B) demonstrating a lytic lucent lesion in the left hemisacrum (solid black arrow). Axial CT of the pelvis (C) demonstrates a lytic mass (dashed black arrow) with associated cortical thinning and pathologic fracture. Axial T1 nonenhanced image (D) shows a hypointense mass in the left sacrum with moderate postcontrast enhancement (E) (dashed white arrow). The photomicrograph (F) demonstrates a sheet of benign neoplastic mononuclear cells with indistinct cell border, scant eosinophilic cytoplasm, round to ovoid nuclei, admixed with numerous multinucleated osteoclast-like giant cells (white arrowhead). CT, computed tomography.
Fig. 4
Fig. 4
( A–F ) Illustration (A) showing the characteristic location of nerve sheath tumors. Intradural/extramedullary and/or extradural mass can arise from the lumbar nerve roots and extend along the course of the nerve through the neural foramina. Axial CT image (B) shows bilateral symmetric cystic masses (solid black arrow) extending through the enlarged neural foramen. Coronal T2 MRI (D) showing dumbbell configuration of nerve roots as they traverse the neural foramen (white arrowhead). The multiseptated T1 hypointense mass (D) demonstrates area of solid enhancement (E) (dashed white arrow). The photomicrograph (F) shows a benign neurofibroma featuring a diffuse proliferation of loosely arranged bland spindle cells with wavy elongated nuclei (dashed black arrow) and associated with shredded-carrot-like collagen fibers. CT, computed tomography; MRI, magnetic resonance imaging.
Fig. 5
Fig. 5
( A–F ) Illustration (A) showing the characteristic locations of chordomas. Chordomas arise in the lower sacral segments in the midline (orange shaded areas). Axial CT image (B) demonstrates lytic erosion through the sacrum (solid black arrow). Sagittal T2 images (C) demonstrate a heterogeneous hyperintense soft tissue mass arising from the S3 sacral body in midline (solid white arrows). Numerous characteristic T2 hypointense septa are seen with characteristic erosion of the lower sacrum and coccyx. Unenhanced coronal T1 image (D) shows a hypointense mass in the lower sacrum (solid black arrows) with avid postcontrast (E) enhancement (dashed black arrow). The photomicrograph (F) depicts large epithelioid cells some featuring physaliphorous cells with intracytoplasmic bubbly vacuoles (black arrowhead) embedded in a myxoid stroma. CT, computed tomography.
Fig. 6
Fig. 6
( A–F ) Illustration (A) showing the characteristic location for chondrosarcoma (orange shaded areas). Sacral chondrosarcoma is typically located eccentrically in the upper portion of the sacrum. Axial CT image (B) with an eccentrically located lytic lesion in the right hemisacrum. There is a subtle calcified chondroid matrix (solid black arrow). Coronal T2 MRI (C) showing a hyperintense mass invading through the neural foramina and extending into the epidural space (solid white arrow). The axial nonenhanced T1 image (D) demonstrates an iso/hypointense mass with heterogeneous enhancement (dashed white arrow) on the postcontrast images (E). The photomicrograph (F) shows an infiltrative proliferation of malignant chondrocytes featuring enlarged hyperchromatic nuclei with prominent nucleoli (dashed black arrow). CT, computed tomography; MRI, magnetic resonance imaging.
Fig. 7
Fig. 7
( A–F ) Illustration (A) showing the characteristic location of sacral Ewing’s (orange shaded areas). Ewing’s generally originates within the sacral ala, often with extension across the sacroiliac joint. On the axial CT image (B), there is a mixed sclerotic/lucent osseous lesion (dashed black arrow) in the right sacrum with aggressive sunburst periosteal reaction (solid black arrow). Axial T2 MRI (C) demonstrates a large hyperintense soft tissue mass that extends through both inner and outer tables of the ilium and sacrum (solid white arrow). Coronal nonenhanced T1 MRI (D) shows a hypointense mass which demonstrates enhancement (dashed white arrow) on the coronal postcontrast images (E). The photomicrograph (F) demonstrates a diffuse sheet of uniform malignant small round cells with finely dispersed chromatin and inconspicuous nucleoli, and scant cytoplasm (black arrowhead). CT, computed tomography; MRI, magnetic resonance imaging.
Fig. 8
Fig. 8
( A–E ) Illustration (A) showing the characteristic location of sacral osteosarcomas (orange shaded areas), which nearly always involve the sacral ala and body. Axial CT (B) image shows a large destructive lytic lesion centered within the left hemisacrum and obliterates the left SI joint to extend into the left ilium. Amorphous osteoid matrix deposition is seen (dashed black arrow). Coronal T2 MRI (C) shows a hyperintense mass (solid white arrow). Postcontrast T1 image (D) shows minimal peripheral enhancement (dashed white arrow). Photomicrograph (E) depicts irregular neoplastic woven bones lacking osteoblastic rimming (white arrowhead), which are produced by the malignant neoplastic polygonal, oval, and spindle osteosarcoma cells in the background. CT, computed tomography; MRI, magnetic resonance imaging.
Fig. 9
Fig. 9
( A–D ) Axial CT in a patient with multiple myeloma (A) demonstrates a punched out lytic lesion within the right sacrum (dashed black arrow) and left iliac bones. Axial T2 MRI (B) shows a hyperintense well-defined marrow replacing lesion (solid white arrow) in the right sacrum. Axial postcontrast (C) T1 image shows a well-defined enhancing lesion (dashed white arrow). The photomicrograph (D) depicts abnormal proliferation of malignant plasmacytic cells with enlarged “clock-face” eccentric nuclei, and basophilic cytoplasm as well as perinuclear hof (black arrowhead). CT, computed tomography; MRI, magnetic resonance imaging.
Fig. 10
Fig. 10
( A–C ) Axial CT image in a patient with lymphoma (A) shows a mixed lytic and sclerotic lesion in the sacrum (solid black arrow) and both iliac bones. T2 MRI image (B) demonstrates heterogeneous hyperintensity throughout the sacrum (solid white arrow), and mixed signal within the iliac bones bilaterally. Photomicrograph (C) depicts a diffuse proliferation of dis-cohesive malignant lymphocytes with enlarged round to lobulated nuclei with multiple prominent nucleoli, and minimal cytoplasm. CT, computed tomography; MRI, magnetic resonance imaging.
Fig. 11
Fig. 11
Coronal CT image (a) in a patient with metastasis, shows bone destruction and soft tissue mass extending to the sacroiliac joints bilaterally (dashed black arrows). Axial MRI T2 image (b) demonstrates an expansile T2 hyperintense mass (solid black arrow).

References

    1. Thornton E, Krajewski K M, O’Regan K N, Giardino A A, Jagannathan J P, Ramaiya N.Imaging features of primary and secondary malignant tumours of the sacrum Br J Radiol 201285(1011)279–286. - PMC - PubMed
    1. Junming M, Cheng Y, Dong C et al.Giant cell tumor of the cervical spine: a series of 22 cases and outcomes. Spine. 2008;33(03):280–288. - PubMed
    1. Llauger J, Palmer J, Amores S, Bagué S, Camins A. Primary tumors of the sacrum: diagnostic imaging. AJR Am J Roentgenol. 2000;174(02):417–424. - PubMed
    1. Varga P P, Bors I, Lazary A. Sacral tumors and management. Orthop Clin North Am. 2009;40(01):105–123, vii. - PubMed
    1. Disler D G, Miklic D. Imaging findings in tumors of the sacrum. AJR Am J Roentgenol. 1999;173(06):1699–1706. - PubMed