. 2021 Jul 20;12(15):1520-1539.
doi: 10.18632/oncotarget.28026.

JunD accentuates arecoline-induced disruption of tight junctions and promotes epithelial-to-mesenchymal transition by association with NEAT1 lncRNA

Affiliations

JunD accentuates arecoline-induced disruption of tight junctions and promotes epithelial-to-mesenchymal transition by association with NEAT1 lncRNA

Subarna Ghosh et al. Oncotarget. .

Abstract

Head and neck cancers are highly prevalent in south-east Asia, primarily due to betel nut chewing. Arecoline, the primary alkaloid is highly carcinogenic; however its role in promoting tumorigenesis by disrupting junctional complexes and increasing risk of metastasis is not well delineated. Subsequently, the effects of low and high concentrations of arecoline on the stability of tight junctions and EMT induction were studied. A microarray analysis confirmed involvement of a MAPK component, JunD, in regulating tight junction-associated genes, specifically ZO-1. Results established that although arecoline-induced phosphorylation of JunD downregulated expression of ZO-1, JunD itself was modulated by the lncRNA-NEAT1 in presence of arecoline. Increased NEAT1 in tissues of HNSCC patients significantly correlated with poor disease prognosis. Here we show that NEAT1-JunD complex interacted with ZO-1 promoter in the nuclear compartment, downregulated expression of ZO-1 and destabilized tight junction assembly. Consequently, silencing NEAT1 in arecoline-exposed cells not only downregulated the expression of JunD and stabilized expression of ZO-1, but also reduced expression of the EMT markers, Slug and Snail, indicating its direct regulatory role in arecoline-mediated TJ disruption and disease progression.

Keywords: JunD; arecoline; head and neck cancer; lncRNA-NEAT1; tight junction.


Conflict of interest statement

CONFLICTS OF INTEREST Authors have no conflicts of interest to declare.

Figures
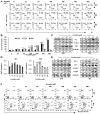
Figure 1
Figure 1. Arecoline induces apoptosis in HEp-2 cells at high concentrations and autophagy-mediated cell survival and proliferation at low concentrations.
(A) Effect of increasing concentrations (0, 25, 50, 100, 200, 400 and 800 μM) of arecoline on cell cycle progression of propidium iodide (PI)-labeled HEp-2 cells after 12, 24 and 48 h of exposure as demonstrated by flow cytometry. The percentages indicate population of cells in G2/M phase of cell cycle. The graphical representation of the results is presented in Supplementary Figure 1D. (B) Effect of various concentrations of arecoline on induction of autophagy in HEp-2 cells after 12, 24 and 48 h of exposure, as indicated by increased formation of AVOs as compared to the respective control sets (no arecoline treatment). The fluorescent intensities indicated by PI fluorescence (x-axis) versus the number of cells (y-axis) graph are represented in Supplementary Figure 2A. (C) Western blot analysis showing increased expression of autophagy-related proteins Atg7, LC3-II and Beclin1 in HEp-2 cells upon treatment with arecoline in dose-dependent manner (0, 25, 50, 200, 400 μM) for 24 h (left panel) and 48 h (right panel). β-tubulin was used as the loading control. (D) Effect of arecoline treatment for 24 h (left panel) and 48 h (right panel) on HEp-2 cell proliferation as indicated by increased Ki-67. The fluorescent intensity of FITC was determined by flow cytometry and plotted in the semi-logarithmic graph of FITC fluorescence (x-axis) versus the number of cells (y-axis) (Supplementary Figure 2B). (E) Western blot analysis of apoptosis-related proteins such as Bcl-2, Bax, cleaved caspase 3 (cl-caspase 3) and cleaved PARP (cl-PARP) in HEp-2 cells upon treatment with different concentrations of arecoline for 24 h (left panel) and 48 h (right panel). β-tubulin was used as an internal control. (F) Flow cytometric analysis of cell death following arecoline treatment after 24 h and 48 h of using Annexin V-FITC/PI staining. FITC-ve/PI-ve cells were designated as “live cells”, FITC+ve/PI-ve as “early apoptotic cells”, FITC+ve/PI+ as “late apoptotic cells” and FITC-ve/PI+ve as “necrotic cells”. The histogram is presented in Supplementary Figure 3C. All the experiments were performed three times. Each value is the mean ± S.D. of three different replicate experiments, each performed in triplicate. * p < 0.1, ** p < 0.01, and *** p < 0.001.
Figure 2
Figure 2. Arecoline induces EMT in a dose-dependent manner.
(A) Expression of mRNA transcripts of EMT-related genes Snail, Slug, Twist and N-cadherin in oral tumor tissues and adjacent normal tissues of HNSCC patients, as evaluated by semi-qPCR (left panel) and qPCR (right panel). (B) Expressions of Snail, Slug, Twist and N-cadherin protein in oral tumor tissues and adjacent normal tissues of HNSCC cancer patients. β-tubulin was used as an internal control. (C) Dose-dependent mRNA expression pattern of the aforementioned EMT-related genes in HEp-2 cells following arecoline treatment for 24 h, as determined by semi-qPCR. (D) Expression of mRNA transcripts of EMT-related genes in untreated and arecoline-treated (400 μM for 24 h) HEp-2 cells. (E) Expression of Snail, Slug, Twist and N-cadherin protein in untreated and arecoline-treated (400 μM for 24 h) HEp-2 cells. β-tubulin was used as an internal control. (F) The phase contrast images representing the rate of migration of HEp-2 cells incubated in the absence and presence of different arecoline concentrations (25, 50, 200 and 400 μM) for 0 hr, 24 h and 48 h (left panel). The images were captured by using 20X objective lenses. The graphical representation of the same experiment is shown on the right. All mRNA expressions were normalized using 18S rRNA as the internal control. Each value is the mean ± S.D. of three replicate experiments, each performed in triplicate. * p < 0.1, ** p < 0.01, and *** p < 0.001.
Figure 3
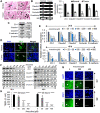
Figure 3. Arecoline disrupts tissue integrity and downregulates the expression of tight junction proteins in HNSCC.
(A) Hematoxylin and eosin staining of tissue sections from normal and HNSCC patients showing disrupted tissue organization in tumor tissues. Arrows indicate lamina propria (LP), organized squamous epithelium (SE), rete pegs/ridges (RP), serous glands (S) and mucous glands (M). Scale: 200 μm. (B) The semi-qPCR (left panel) and qPCR (right panel) of expression of tight junction-associated genes in tumors (n = 5) and adjacent normal tissues (n = 5). (C) Alterations in expression of tight junction-associated proteins in normal and oral tumor tissues. (D) Immunofluorescence micrographs of tumor tissue and adjacent normal tissue of HNSCC patients, stained with DAPI and FITC-conjugated anti-ZO-1 antibody. The arrows indicate continuous membrane staining in normal tissue and punctuate staining of ZO-1 in tumor sections. Scale bar: 100 μm. Effect of arecoline on transcripts of tight junction-associated genes (E) and proteins (F) in HEp-2 cells upon treatment with various concentrations of arecoline for 24 h (left panel) and 48 h (right panel). (G) Immunocytochemical analysis for ZO-1 expression in HEp-2 after 24 h (left panel) and 48 h (right panel) incubation. The arrows indicate membrane staining of ZO-1 in control cells and cytoplasmic accumulation in arecoline treated cells. Scale bar: 100 μm. 18S rRNA was used as internal control for the PCRs and the evaluated mRNA expressions were normalized using 18S rRNA. β-tubulin was used as an internal control for western blots. (H) TEER analysis to determine integrity of tight junctions in cell monolyers in response to arecoline treatment at 0, 50, 200 & 400 μM doses for 24 h and 48 h. All the experiments were performed thrice. Each value is the mean ± S.D. of three different replicate experiments, each performed in triplicate. * p < 0.1, ** p < 0.01, and *** p < 0.001.
Figure 4
Figure 4. Arecoline augments stemness acquisition in HNSCC.
(A) Flow cytometry analyses depicting enhancement of ALDH+ cells upon treatment of HEp-2 cells with arecoline (0, 50, 400 μM) for 24 h (upper panel) and 48 h (lower panel). (B) Expression of mRNA transcripts of stemness-related genes by semi-qPCR (left panel) and qPCR (right panel) in HEp-2 cells treated with arecoline for 24 h. (C) Percentage cell viability of HEp-2 spheroids upon treatment with different concentrations (0, 25, 50, 100, 200, 400, 800 μM) of arecoline for 24 and 48 h, as evaluated by MTT assay, indicating no significant toxicity. (D) mRNA expression of both EMT-related genes (left panel) and TJ-associated genes (right panel) of HEp-2 spheroids treated with 0, 50 and 400 μM arecoline for 24 h. 18S rRNA expression was used as internal control. All the experiments were performed thrice. Each value is the mean ± S.D. of three different replicate experiments, each performed in triplicate. * p < 0.1 and *** p < 0.001.
Figure 5
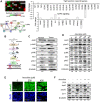
Figure 5. Arecoline-induced activation of the MAPK pathway mediators.
(A) Microarray analysis (representative of 3 independent experiments) of tissue biopsy samples shows differentially regulated genes in tumor as compare to adjoining normal tissues of the same patient. Upper left panel depicts the heat map. Upper right panel represents differentially expressed genes related to tight junction and adhesion molecules. Lower right panel depicts expression pattern of G-protein and protein kinase signaling molecules. Lower left panel shows string analysis of interaction of candidate genes of the protein kinase signaling pathway and adhesion molecules. (B) Schematic representation of the plausible pathway components, PI3K/AKT/JNK/JunD, steering the inhibitory effects of arecoline on ZO-1. (C) Expression of MAPK pathway regulator proteins in oral tumor tissues (n = 3) and adjacent normal tissues (n = 3). The blot is representative of 3 different paired tissues. (D) Protein expression of MAPK pathway regulators in HEp-2 cells in response to different concentrations of arecoline treatment for 24 h. (E) Immunofluorescence micrographs of HEp-2 cells treated with arecoline for 24 h and stained with anti-pJunD antibody. DAPI was used to stain the nuclei. Scale bar: 100 μm. (F) Expression of JunD, pJunD and ZO-1 in HEp-2 cells incubated with 50 μM (+) and 400 μM (++) arecoline in the absence (–) and presence (+) of 100 μg/ml cycloheximide (CHX). β-tubulin was used as an internal control for all western blot analyses. All the experiments were performed three times and each value is the mean ± S.D. of three different replicate experiments.
Figure 6
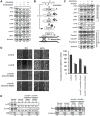
Figure 6. Arecoline mediates tight junction disruption by JunD phosphorylation and ZO-1 down regulation.
(A) Differential protein expression of the MAPK pathway regulators in HEp-2 cells in response to 50 μM (+) or 100 μM (++) arecoline and 100 μM wortmannin. (B) Presumptive upstream pathway components orchestrating the inhibitory effect of arecoline on ZO-1, leading to tight junction disruption. (C) Effect of silencing JunD on MAPK and tight junction components in HEp-2 cells in absence and presence of 50 μM (+) and 100 μM (++) arecoline. (D) Phase-contrast images of bidirectional wound healing assay illustrating the effects of silencing JunD on migration of HEp-2 cells in absence and presence of arecoline after 48 h of incubation. Graphical representations indicate % wound closure. *** p < 0.001 (E) Effect of JunD silencing followed by arecoline treatment on JunD, pJunD and ZO-1 in the cytoplasmic (C), nuclear (N) and membrane (M) fractions y. β-tubulin was used as an internal control for all western blots. All the experiments were performed thrice. Each value is the mean ± S.D. of three different replicate experiments.
Figure 7
Figure 7. NEAT1 interacts directly with JunD in the nuclear compartment.
(A) A putative schematic representation of arecoline-induced lncRNA-mediated activation of JunD and inhibition of ZO-1, leading to disruption of tight junctions. (B) Semi-qPCR (left) and qPCR assays (right) indicating differential expressions of lncRNAs in tumors and adjacent normal tissues of HNSCC patients. (C) Differential expressions of lncRNAs in HEp-2 cells treated without and with 50 and 400 μM concentrations of arecoline for 24 h. (D) Depiction of post-simulated NEAT1-JunD complex as evaluated from molecular docking using PatchDock software; NEAT1 lncRNA (pink ribbon model); JunD (green structure model). (E) Interaction of JunD and ZO-1 promoter (left) and NEAT1: pJunD: ZO-1 promoter (right) as evaluated from molecular docking studies using PatchDock. (F) Expression of NEAT1 and JunD mRNA in the cytosolic and nuclear fractions of HEp-2 cells treated without and with 50 and 400 μM arecoline. 18S rRNA expression was used as internal control for all PCRs. Each value is the mean ± S.D. of three different experiments. * p < 0.1, *** p < 0.001.
Figure 8
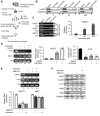
Figure 8. NEAT1 plays a pivotal role in JunD-mediated downregulation of ZO-1.
(A) Schematic representation of RNA immunoprecipitation (RIP) performed to determine the interaction between pJunD and NEAT1. (B) Expression of pJunD in absence and presence of 50 μM and 400 μM arecoline after immunoprecipitation with pJunD specific antibody. RIP with anti-IgG, indicating non-specific antibody binding, served as the negative control. (C) Expression of NEAT1 following RIP by semi-qPCR and RT-PCR. 18S served as control for non-specific amplification. (D) Expression of JunD and NEAT1 after silencing JunD in HEp-2 cells followed by treatment without and with 50 μM (+) and 100 μM (++) arecoline. The relative RNA expressions are represented for NEAT1 and JunD. (E) Expression of JunD and NEAT1 after silencing NEAT1 in HEp-2 cells followed by treatment without and with 50 μM (+) and 100 μM (++) arecoline. (F) Differential protein expression of tight junction and EMT markers in HEp-2 cells after silencing NEAT1 followed by treatment without and with 50 μM (+) and 100 μM (++) arecoline. β-tubulin was used as an internal control for all western blots. All the experiments were performed three times. Each value is the mean ± S.D. of three different replicate experiments, each performed in triplicate. * p < 0.1 and *** p < 0.001.

References

    1. Poddar A, Aranha RR, K Muthukaliannan G, Nachimuthu R, Jayaraj R. Head and neck cancer risk factors in India: protocol for systematic review and meta-analysis. BMJ Open. 2018; 8:e020014. 10.1136/bmjopen-2017-020014. - DOI - PMC - PubMed
    1. Shield KD, Ferlay J, Jemal A, Sankaranarayanan R, Chaturvedi AK, Bray F, Soerjomataram I. The global incidence of lip, oral cavity, and pharyngeal cancers by subsite in 2012. CA Cancer J Clin. 2017; 67:51–64. 10.3322/caac.21384. - DOI - PubMed
    1. Baugnon KL, Beitler JJ. Pitfalls in the staging of cancer of the laryngeal squamous cell carcinoma. Neuroimaging Clin N Am. 2013; 23:81–105. 10.1016/j.nic.2012.08.008. - DOI - PubMed
    1. Ferlay J, Soerjomataram I, Dikshit R, Eser S, Mathers C, Rebelo M, Parkin DM, Forman D, Bray F. Cancer incidence and mortality worldwide: sources, methods and major patterns in GLOBOCAN 2012. Int J Cancer. 2015; 136:E359–86. 10.1002/ijc.29210. - DOI - PubMed
    1. Chen YJ, Chang JT, Liao CT, Wang HM, Yen TC, Chiu CC, Lu YC, Li HF, Cheng AJ. Head and neck cancer in the betel quid chewing area: recent advances in molecular carcinogenesis. Cancer Sci. 2008; 99:1507–14. 10.1111/j.1349-7006.2008.00863.x. - DOI - PMC - PubMed