. 2021 Jan 29:7:161-177.
doi: 10.1016/j.xjtc.2021.01.023. eCollection 2021 Jun.

The role of diffuse correlation spectroscopy and frequency-domain near-infrared spectroscopy in monitoring cerebral hemodynamics during hypothermic circulatory arrests

Affiliations

The role of diffuse correlation spectroscopy and frequency-domain near-infrared spectroscopy in monitoring cerebral hemodynamics during hypothermic circulatory arrests

Alexander I Zavriyev et al. JTCVS Tech. .

Abstract

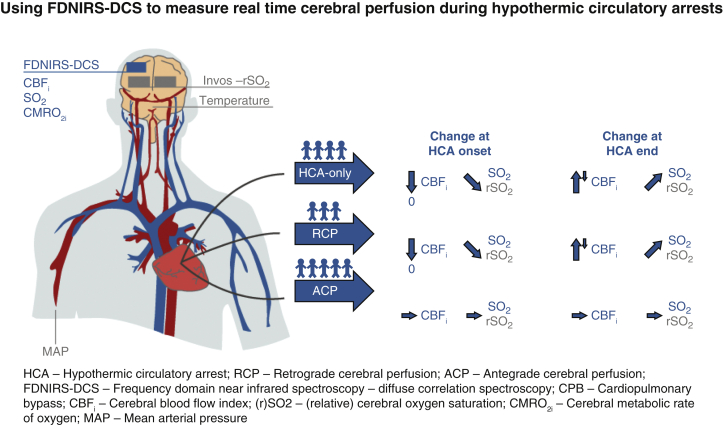
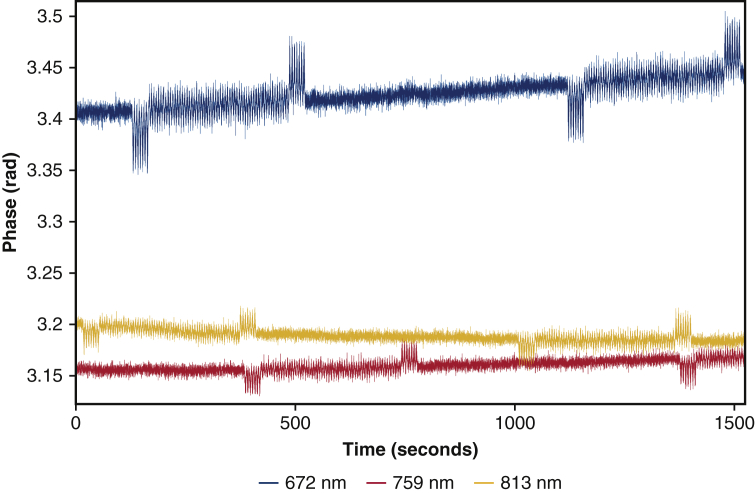
Objectives: Real-time noninvasive monitoring of cerebral blood flow (CBF) during surgery is key to reducing mortality rates associated with adult cardiac surgeries requiring hypothermic circulatory arrest (HCA). We explored a method to monitor cerebral blood flow during different brain protection techniques using diffuse correlation spectroscopy (DCS), a noninvasive optical technique which, combined with frequency-domain near-infrared spectroscopy (FDNIRS), also provides a measure of oxygen metabolism.

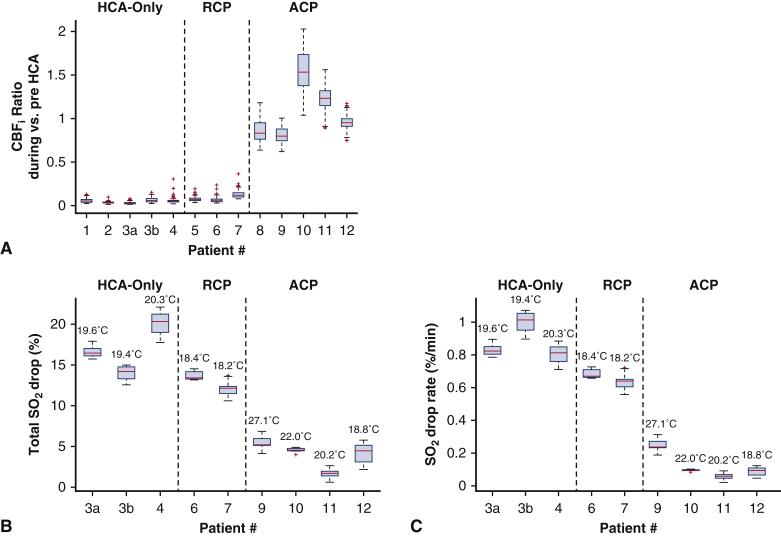
Methods: We used DCS in combination with FDNIRS to simultaneously measure hemoglobin oxygen saturation (SO2), an index of cerebral blood flow (CBFi), and an index of cerebral metabolic rate of oxygen (CMRO2i) in 12 patients undergoing cardiac surgery with HCA.

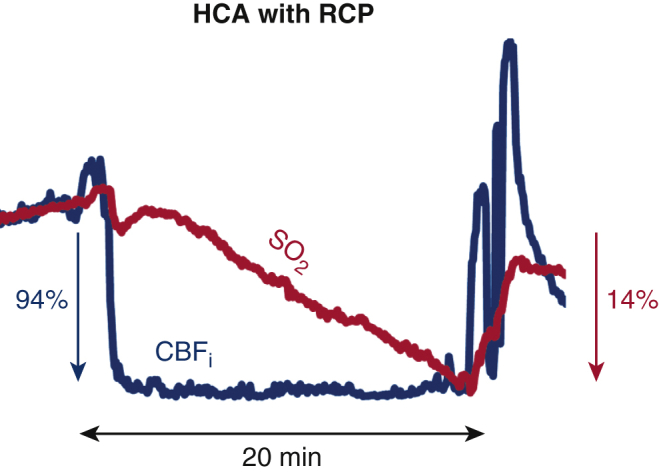
Results: Our measurements revealed that a negligible amount of blood is delivered to the cerebral cortex during HCA with retrograde cerebral perfusion, indistinguishable from HCA-only cases (median CBFi drops of 93% and 95%, respectively) with consequent similar decreases in SO2 (mean decrease of 0.6 ± 0.1% and 0.9 ± 0.2% per minute, respectively); CBFi and SO2 are mostly maintained with antegrade cerebral perfusion; the relationship of CMRO2i to temperature is given by CMRO2i = 0.052e0.079T.

Conclusions: FDNIRS-DCS is able to detect changes in CBFi, SO2, and CMRO2i with intervention and can become a valuable tool for optimizing cerebral protection during HCA.

Keywords: ACP, antegrade cerebral perfusion; CBFi, cerebral blood flow (index); CMRO2i, cerebral metabolic rate of oxygen (index); CPB, cardiopulmonary bypass; DCS, diffuse correlation spectroscopy; EEG, electroencephalography; FDNIRS, frequency-domain near-infrared spectroscopy; HCA, hypothermic circulatory arrest; NIRS, near-infrared spectroscopy; RCP, retrograde cerebral perfusion; SO2, hemoglobin oxygen saturation; TCD, transcranial Doppler ultrasound; antegrade cerebral perfusion; brain imaging; cerebral blood flow; diffuse correlation spectroscopy; hypothermic circulatory arrest; near-infrared spectroscopy; rSO2, regional oxygen saturation; retrograde cerebral perfusion.


Figures

None
Graphical abstract
None
Blood flow index drops to ∼0 at HCA with RCP. Oxygenation decreases 0.7% per minute.
Figure 1
Figure 1
Real-time noninvasive cerebral blood flow monitoring during cardiac surgery could help optimize neuroprotective measures and hence decrease rates of neurologic injury associated with HCA. We used combined FDNIRS-DCS to measure hemoglobin SO2, CBFi, and CMRO2i in 12 adults undergoing HCA (4 HCA-only, 3 RCP, 5 ACP). We coacquired rSO2 from a hospital oximeter (INVOS; Medtronic, Minneapolis, Minn), MAP, and nasopharyngeal temperature. Our measurements revealed that during HCA with RCP CBFi drops to almost zero and overshoots above baseline when circulation is restarted, similar to the CBFi behavior found during HCA-only. As a consequence of the low perfusion, with RCP and HCA-only SO2 decreases during HCA; on in contrast, both CBFi and SO2 are mostly maintained with ACP. FDNIRS-DCS, Frequency domain near-infrared spectroscopy and diffuse correlation spectroscopy; CBFi, cerebral blood flow index; SO2, oxygen saturation; CMRO2i, cerebral metabolic rate of oxygen; rSO2, regional oxygen saturation; HCA, hypothermic circulatory arrest; RCP, retrograde cerebral perfusion; ACP, antegrade cerebral perfusion; MAP, mean arterial blood pressure.
Figure 2
Figure 2
A, Photograph of our optical probe on a patient: A = FDNIRS-DCS optical probe, B = hospital INVOS oximeter probe, C = processed electroencephalogram probe. B, Schematic of the FDNIRS-DCS probe. NIRS and DCS light source fibers (dark red square) are colocalized and diffused over a 3.5-mm spot diameter to meet American National Standards Institute standard irradiance limits. A DCS short separation detector fiber (light blue) is located 5 mm from the source center and used to detect scalp blood flow. Remaining DCS detector fibers (green) were located at 25 and 30 mm from the source for greater sensitivity to cerebral blood flow. For patients that also had FDNIRS measurements, in addition to the colocalized 25- and 30-mm detector fibers, we had 2 detector fibers located at 20 and 35 mm from the source, except for patient 9, where the 2 extra detectors were at 15 and 20 mm from the source. Multiple separations in FDNIRS allow for application of the multidistance method to calculate SO2. Note: our probe is small and lightweight and doesn't requires special training to correctly operate. FDNIRS-DCS, Frequency domain near-infrared spectroscopy and diffuse correlation spectroscopy.
Figure 3
Figure 3
Full measurement of a patient (3) during a pulmonary thromboendarterectomy with 2 periods of HCA without any additional perfusion (HCA-only). CBFi, (A, blue, left axis), CMRO2i (A, red, right axis), and hemoglobin oxygenation (SO2, B) are measured by our combined FDNIRS-DCS device. The remaining 3 panels show the INVOS rSO2 measured in the left (C, blue) and right (C, red) forehead, MAP as measured via an arterial cannula in the arm (D), and temperature measured with a nasopharyngeal probe (E) throughout the surgery. In sections shaded in light green, the patient's heart is driving blood circulation. In all other sections, the patient is on CPB. Noteworthy trends include the high correlation between CBFi, CMRO2i, and temperature; the immediate measured drop to zero of the CBFi at the beginning of each HCA, followed by the sharp overshoots at the end of HCA; and finally, the high correlation between SO2 measurements taken via FDNIRS and the INVOS oximeter. CBFi, Cerebral blood flow index; CPB, cardiopulmonary bypass; HCA, hypothermic circulatory arrest; CMRO2i, cerebral metabolic rate of oxygen; SO2, oxygen saturation; rSO2, regional oxygen saturation; MAP, mean arterial pressure.
Figure 4
Figure 4
Log of the normalized CMRO2i versus temperature in 6 patients who had continuous FDNIRS-DCS measurements. Each patient is indicated by a different color. Open markers indicate cooling periods and filled markers indicate rewarming periods. Each patient's CMRO2i values are normalized with respect to average CMRO2i between 34.5°C and 36.5°C during patient rewarming. The red line is the linear fit, which demonstrates the expected temperature linear dependence. Pearson correlation coefficient r = 0.84, statistically significant at the .01 level. CMRO2i, Cerebral metabolic rate of oxygen; FDNIRS-DCS, frequency domain near-infrared spectroscopy and diffuse correlation spectroscopy.
Figure 5
Figure 5
CBFi (blue, left axis) and hemoglobin SO2 (red, right axis) measured by our combined FDNIRS-DCS device. A, Patient 3 during the second HCA with no extra perfusion (HCA-only). CBFi dropped 94 ± 3% within the first minute of HCA. The patient's SO2 decreased by 14 ± 1% over the 12-minute HCA (1.2 ± 0.1% per minute). B, Patient 6, who underwent HCA with RCP. CBFi dropped 93 ± 3% within the first minute of HCA. SO2 dropped at a slower rate (0.7% per minute) than the HCA-only patient and dropped by 23 ± 1% after 20 minutes of HCA. C, Patient 10, who underwent HCA with ACP. At the beginning of ACP, CBFi is at the pre-HCA level, but it increases throughout the procedure, ultimately reaching 2 times the initial level (mean increase of 57 ± 39%). SO2, in contrast, did not demonstrate this increase of perfusion, instead dropping through the procedure by 4.6% (SO2 drop-rate of 0.1 ± 0.2% per minute). It is notable that cerebral perfusion does not increase during an RCP procedure. This was indicated by CBFi more promptly than SO2 signal. Furthermore, HCA-only and RCP cases display a large overshoot at reperfusion that is identifiable only in the CBFi time trace. CBFi, Cerebral blood flow index; HCA, hypothermic circulatory arrest; SO2, oxygen saturation; RCP, retrograde cerebral perfusion; ACP, antegrade cerebral perfusion.
Figure 6
Figure 6
Relative changes in CBFi and hemoglobin SO2 during HCA versus pre-HCA baseline with different brain-protection procedures (HCA-only, RCP, ACP). All data are presented in box and whisker format. The red line indicates the median, the edges of the box indicate the 25th and 75th percentiles, the whiskers extend to the extreme nonoutlier data points, and outliers are represented as red addition symbols. A, The ratios of CBFi during versus pre-HCA measured with DCS. Pre-HCA interval was identified as 5-minute period immediately before HCA start (with one exception, patient 2, where we had to use a 2-minute period because of artifacts). During-HCA was defined as the average from 1 minute into HCA to the HCA stop time. B, Percent drop of SO2 measured with FDNIRS. Values were averaged for 60 seconds for both the pre-HCA baseline and end of HCA values. Numbers above bars indicate average temperature during HCA. C, Average drop-rate of SO2 through HCA. HCA durations were determined using electronic records and are precise to the minute time scale. Notice that for (A), there is no significant difference between CBFi drops in HCA-only and RCP cases, and both are significantly different from ACP cases. Furthermore, as we would expect, in (B) and (C) HCA-only and RCP have similar SO2 drops and drop rates, whereas ACP drops are significantly lower. These differences would likely be made even more striking when accounting for the differences in body temperatures, which are considerably greater in patients undergoing ACP than those who are undergoing HCA-only and RCP. CBFi, Cerebral blood flow index; HCA, hypothermic circulatory arrest; RCP, retrograde cerebral perfusion; ACP, antegrade cerebral perfusion; SO2, oxygen saturation.
Figure E1
Figure E1
FDNIRS raw phase data at 672, 759, and 813 nm and 3 cm source-detector separation in patient 6. The interference from the hospital INVOS oximeter lasts several minutes but is only strong enough to affect our data during the start and end small jumps that have an amplitude of approximately 0.05 radians in the raw signal. Each of these jumps is roughly 40 seconds wide, easy to analytically detect, and remove.
Figure E2
Figure E2
FDNIRS raw phase data at 672, 726, and 813 nm and detector at 2.5 cm from the source, from patient 12, showing the strong interference of the hospital INVOS oximeter. Here, the interference during the entire 5- to 7-minute long period is strong enough to affect our data. This combined with the overlap across wavelengths makes potential interpolation algorithms more difficult to standardize.
Figure E3
Figure E3
CBFi, hemoglobin SO2, and the hospital INVOS oximeter regional (r)SO2 time-traces around a HCA with ACP in patient #10. CBFi and FDNIRS SO2 are measured on the right side, whereas INVOS has bilateral measurements. Note that although the right-side FDNIRS and INVOS oxygen saturation report relatively steady levels, the left INVOS rSO2 drops throughout the HCA, suggesting decreased blood flow delivery to that hemisphere, similar to the RCP or HCA-only cases. This may be caused by an incomplete circle of Willis. CBFi measured on the right side supports this hypothesis since increasing perfusion pressure from the clinical team only served to increase CBFi through HCA, with the long separations CBFi increasing to more than 200% of the pre-HCA levels. Artifacts in CBFi through HCA are from a clinician pressing on the probe mid-procedure. CBFi, Cerebral blood flow index; HCA, hypothermic circulatory arrest; ACP, antegrade cerebral perfusion; FDNIRS, frequency domain near-infrared spectroscopy; SO2, oxygen saturation; rSO2, regional oxygen saturation.

References

    1. Mezrow C.K., Sadeghi A.M., Gandsas A., Dapunt O.E., Shiang H.H., Zappulla R.A., et al. Cerebral effects of low-flow cardiopulmonary bypass and hypothermic circulatory arrest. Ann Thorac Surg. 1994;57:532–539. - PubMed
    1. Wypij D., Newburger J.W., Rappaport L.A., duPlessis A.J., Jonas R.A., Wernovsky G., et al. The effect of duration of deep hypothermic circulatory arrest in infant heart surgery on late neurodevelopment: the Boston circulatory arrest trial. J Thorac Cardiovasc Surg. 2003;126:1397–1403. - PubMed
    1. Gaynor J.W., Nicolson S.C., Jarvik G.P., Wernovsky G., Montenegro L.M., Burnham N.B., et al. Increasing duration of deep hypothermic circulatory arrest is associated with an increased incidence of postoperative electroencephalographic seizures. J Thorac Cardiovasc Surg. 2005;130:1278–1286. - PMC - PubMed
    1. Czerny M., Fleck T., Zimpfer D., Dworschak M., Hofmann W., Hutschala D., et al. Risk factors of mortality and permanent neurologic injury in patients undergoing ascending aortic and arch repair. J Thorac Cardiovasc Surg. 2003;126:1296–1301. - PubMed
    1. Englum B.R., He X., Gulack B.C., Ganapathi A.M., Mathew J.P., Brennan J.M., et al. Hypothermia and cerebral protection strategies in aortic arch surgery: a comparative effectiveness analysis from the STS adult cardiac surgery database. Eur J Cardiothorac Surg. 2017;52:492–498. - PubMed

LinkOut - more resources