. 2021 Sep 27;61(9):4156-4172.
doi: 10.1021/acs.jcim.0c00993. Epub 2021 Jul 28.

Improving Measures of Chemical Structural Similarity Using Machine Learning on Chemical-Genetic Interactions

Affiliations

Improving Measures of Chemical Structural Similarity Using Machine Learning on Chemical-Genetic Interactions

Hamid Safizadeh et al. J Chem Inf Model. .

Abstract

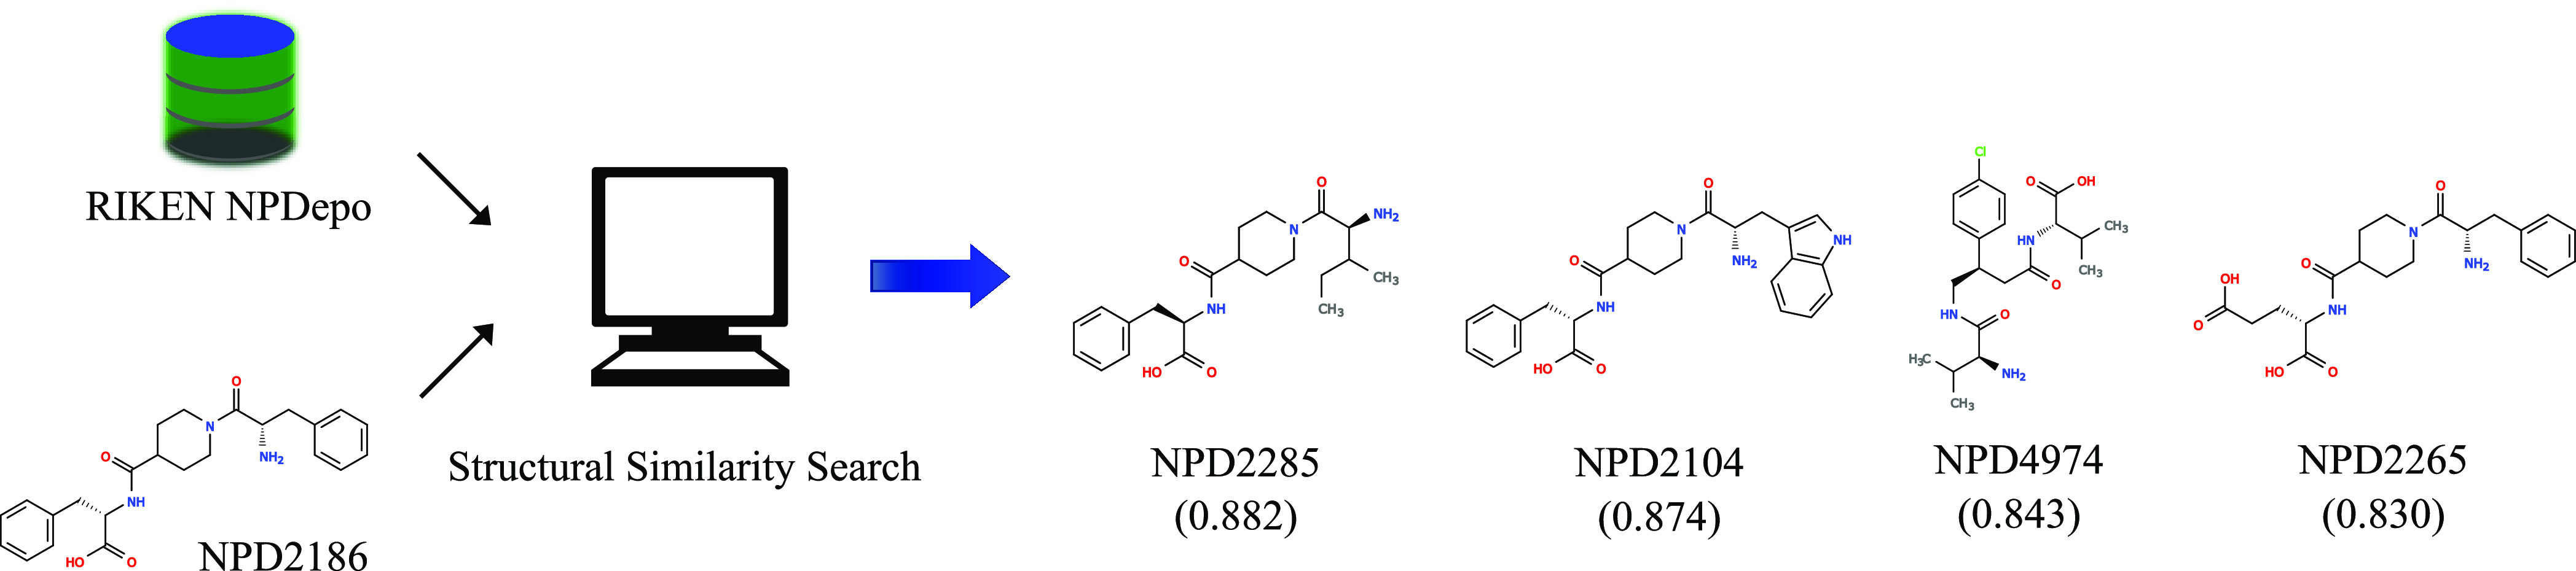
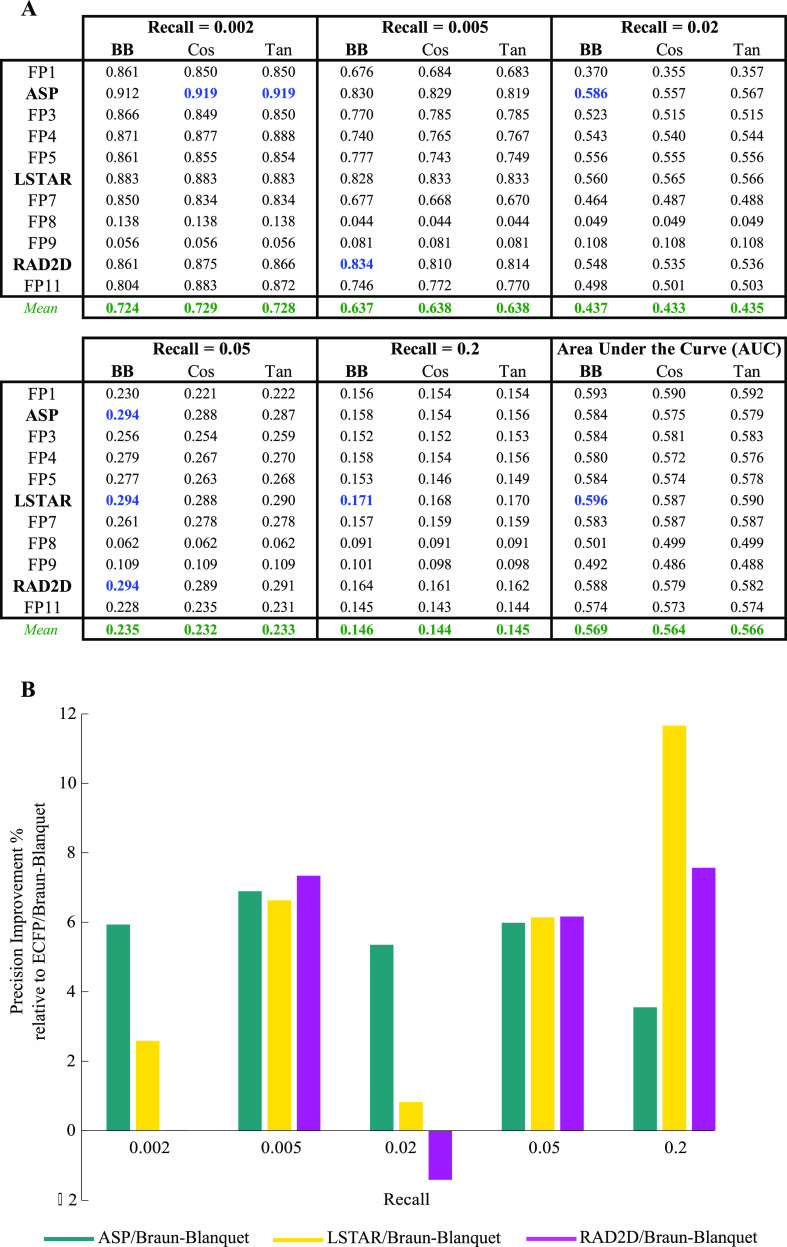
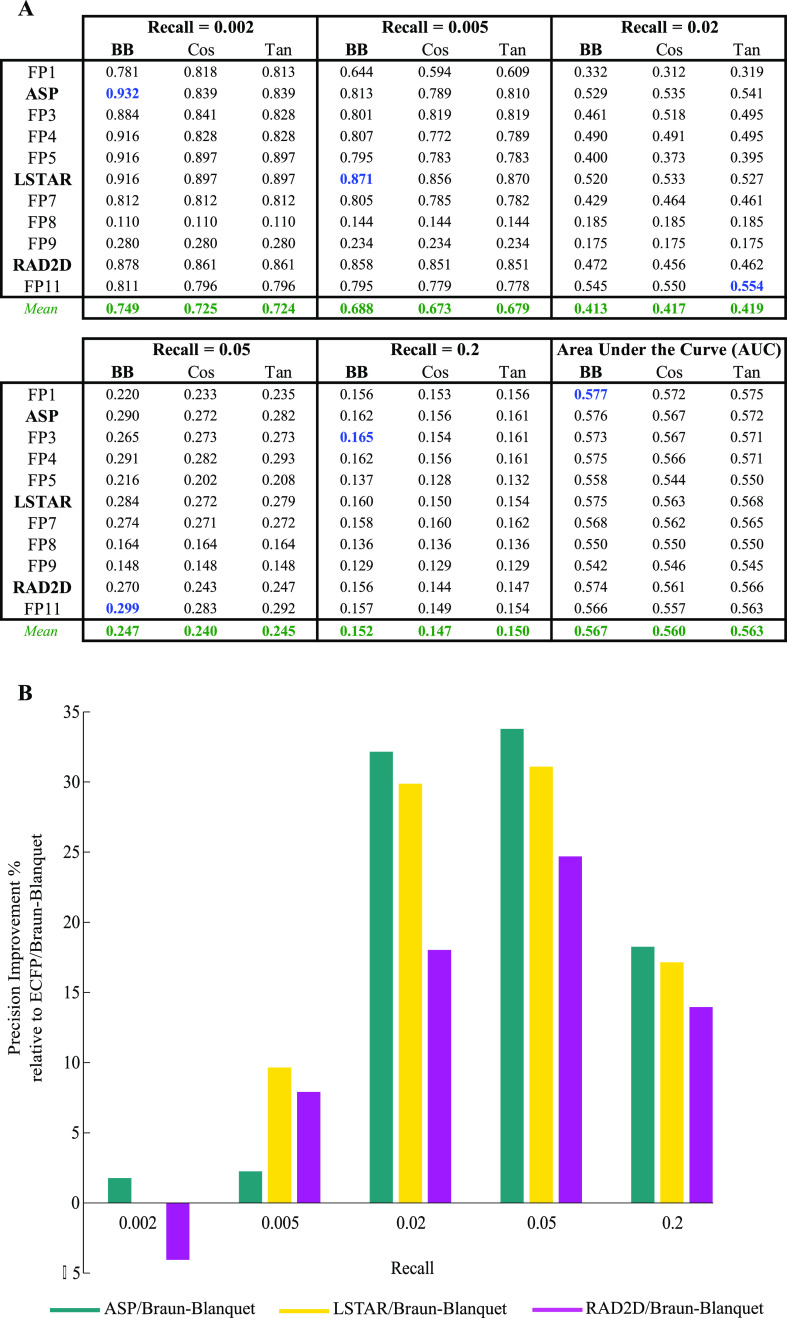
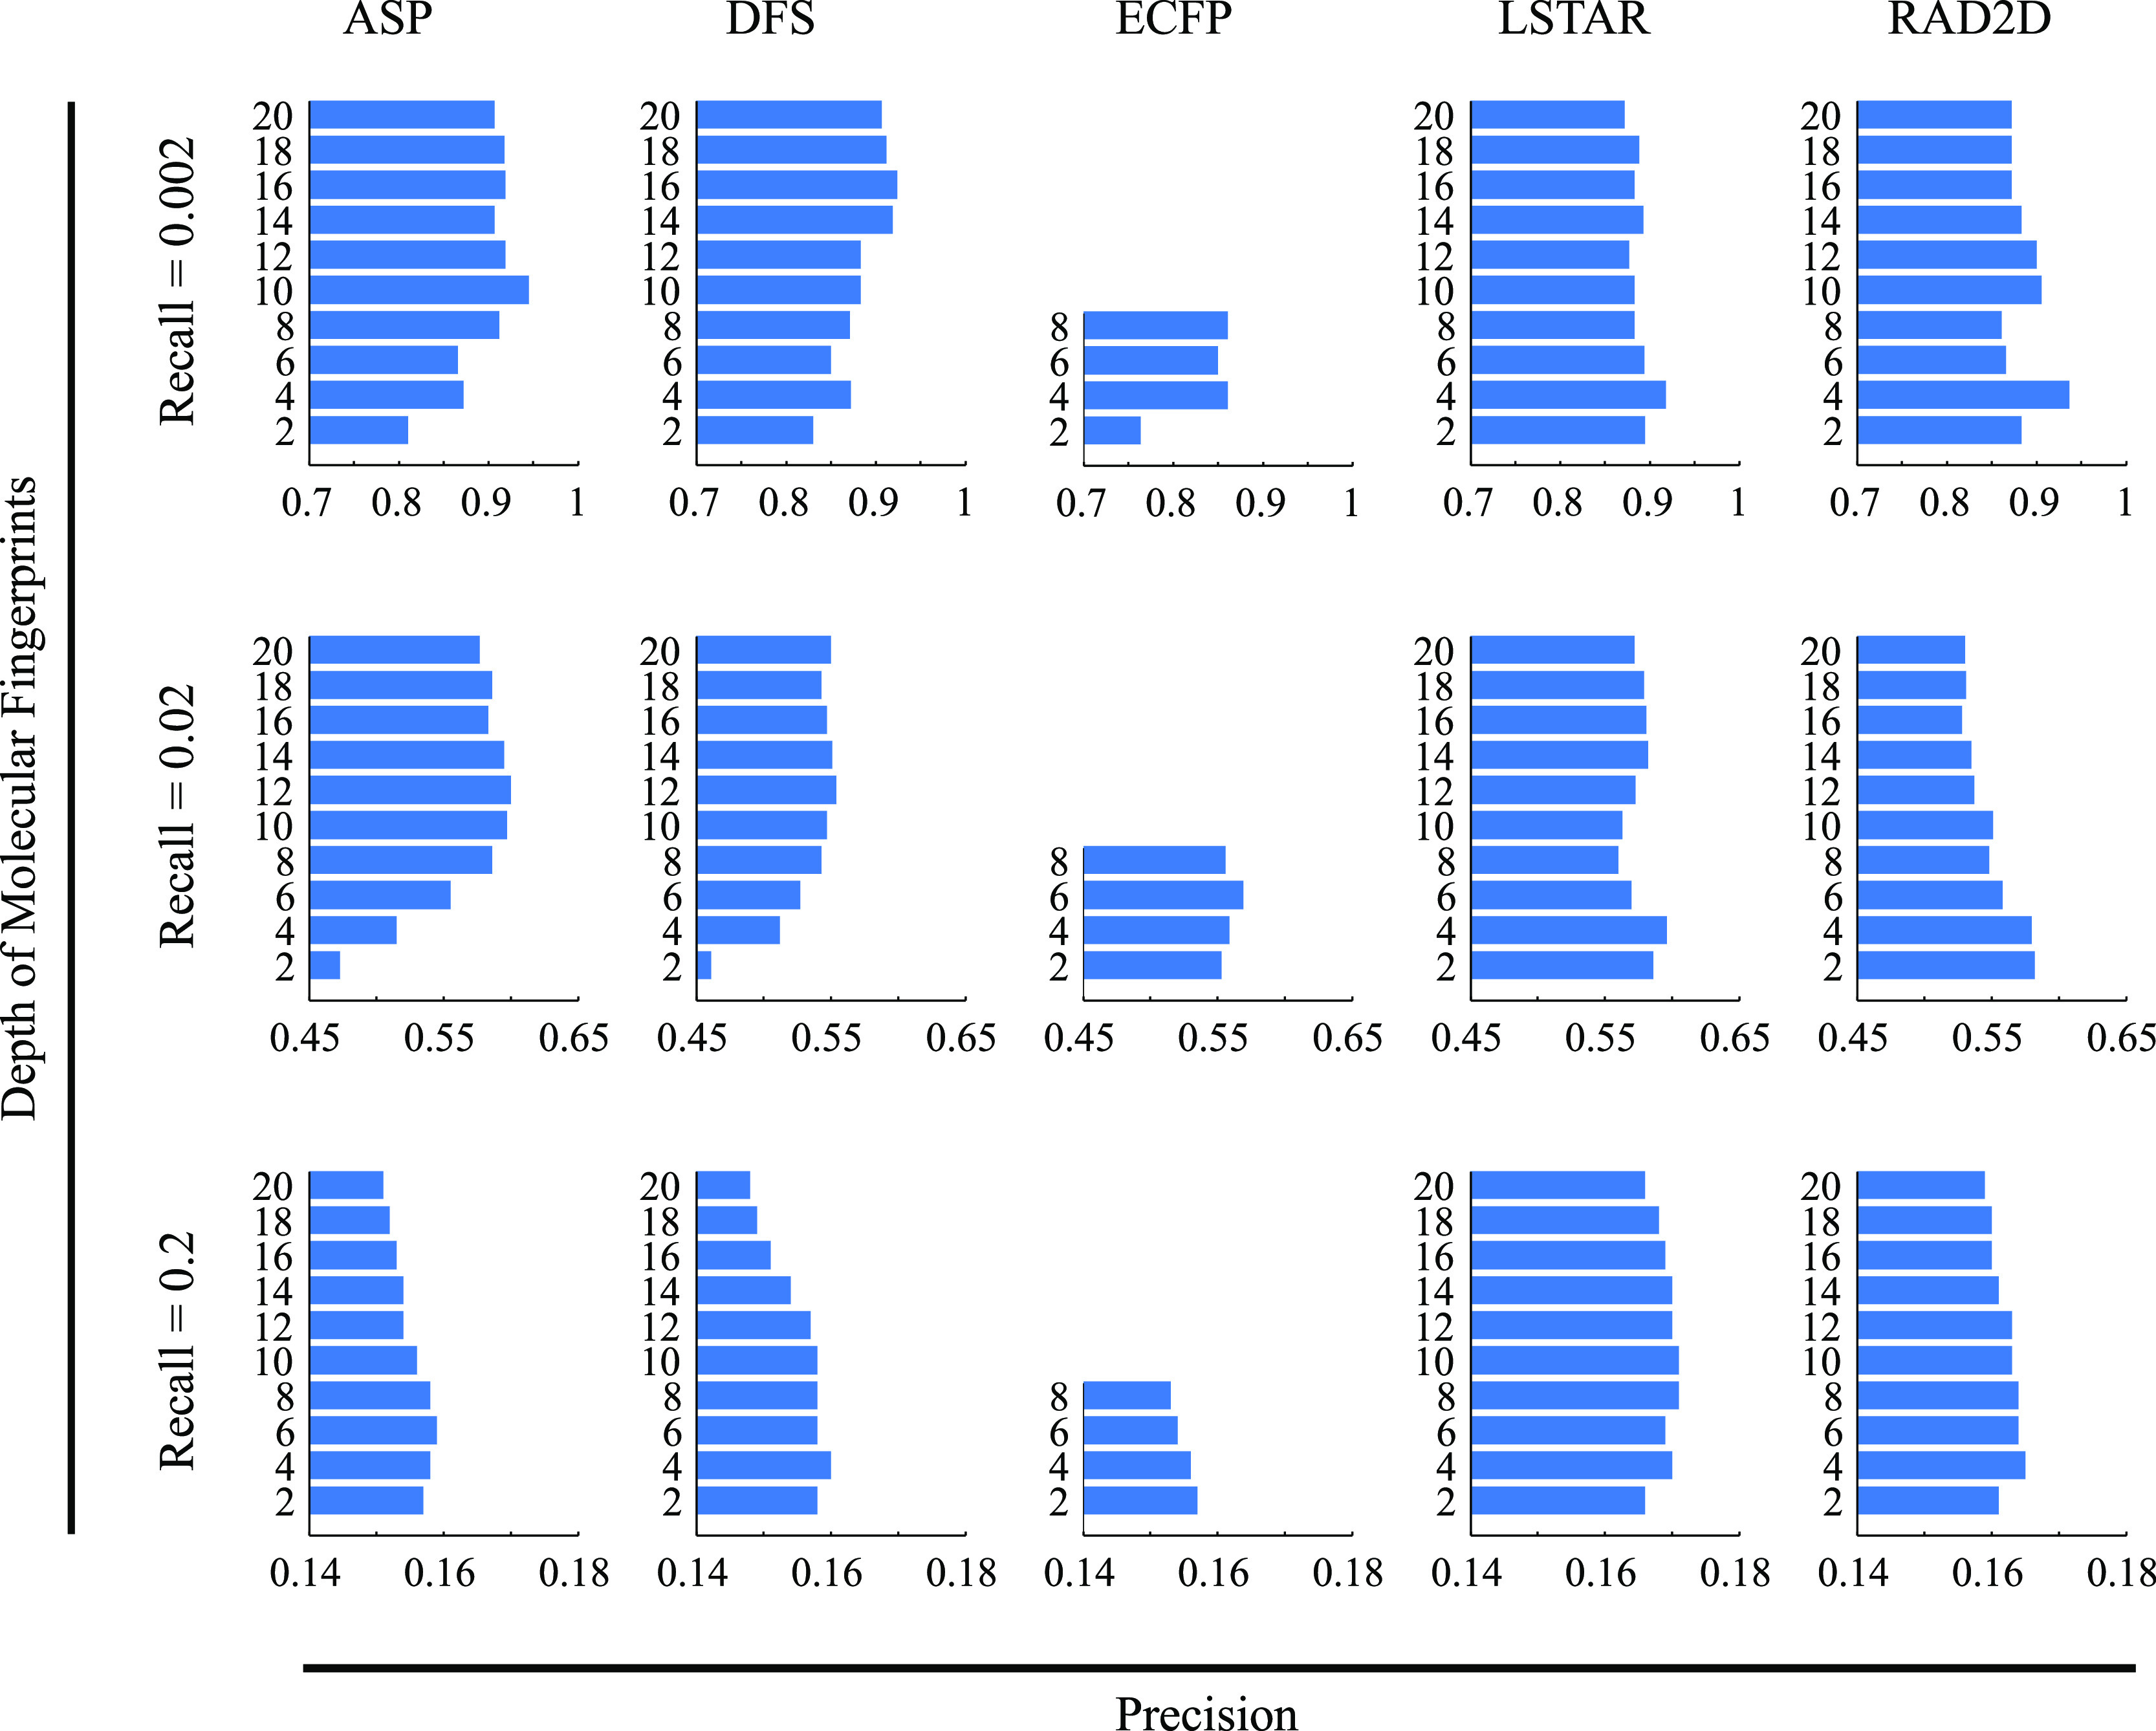
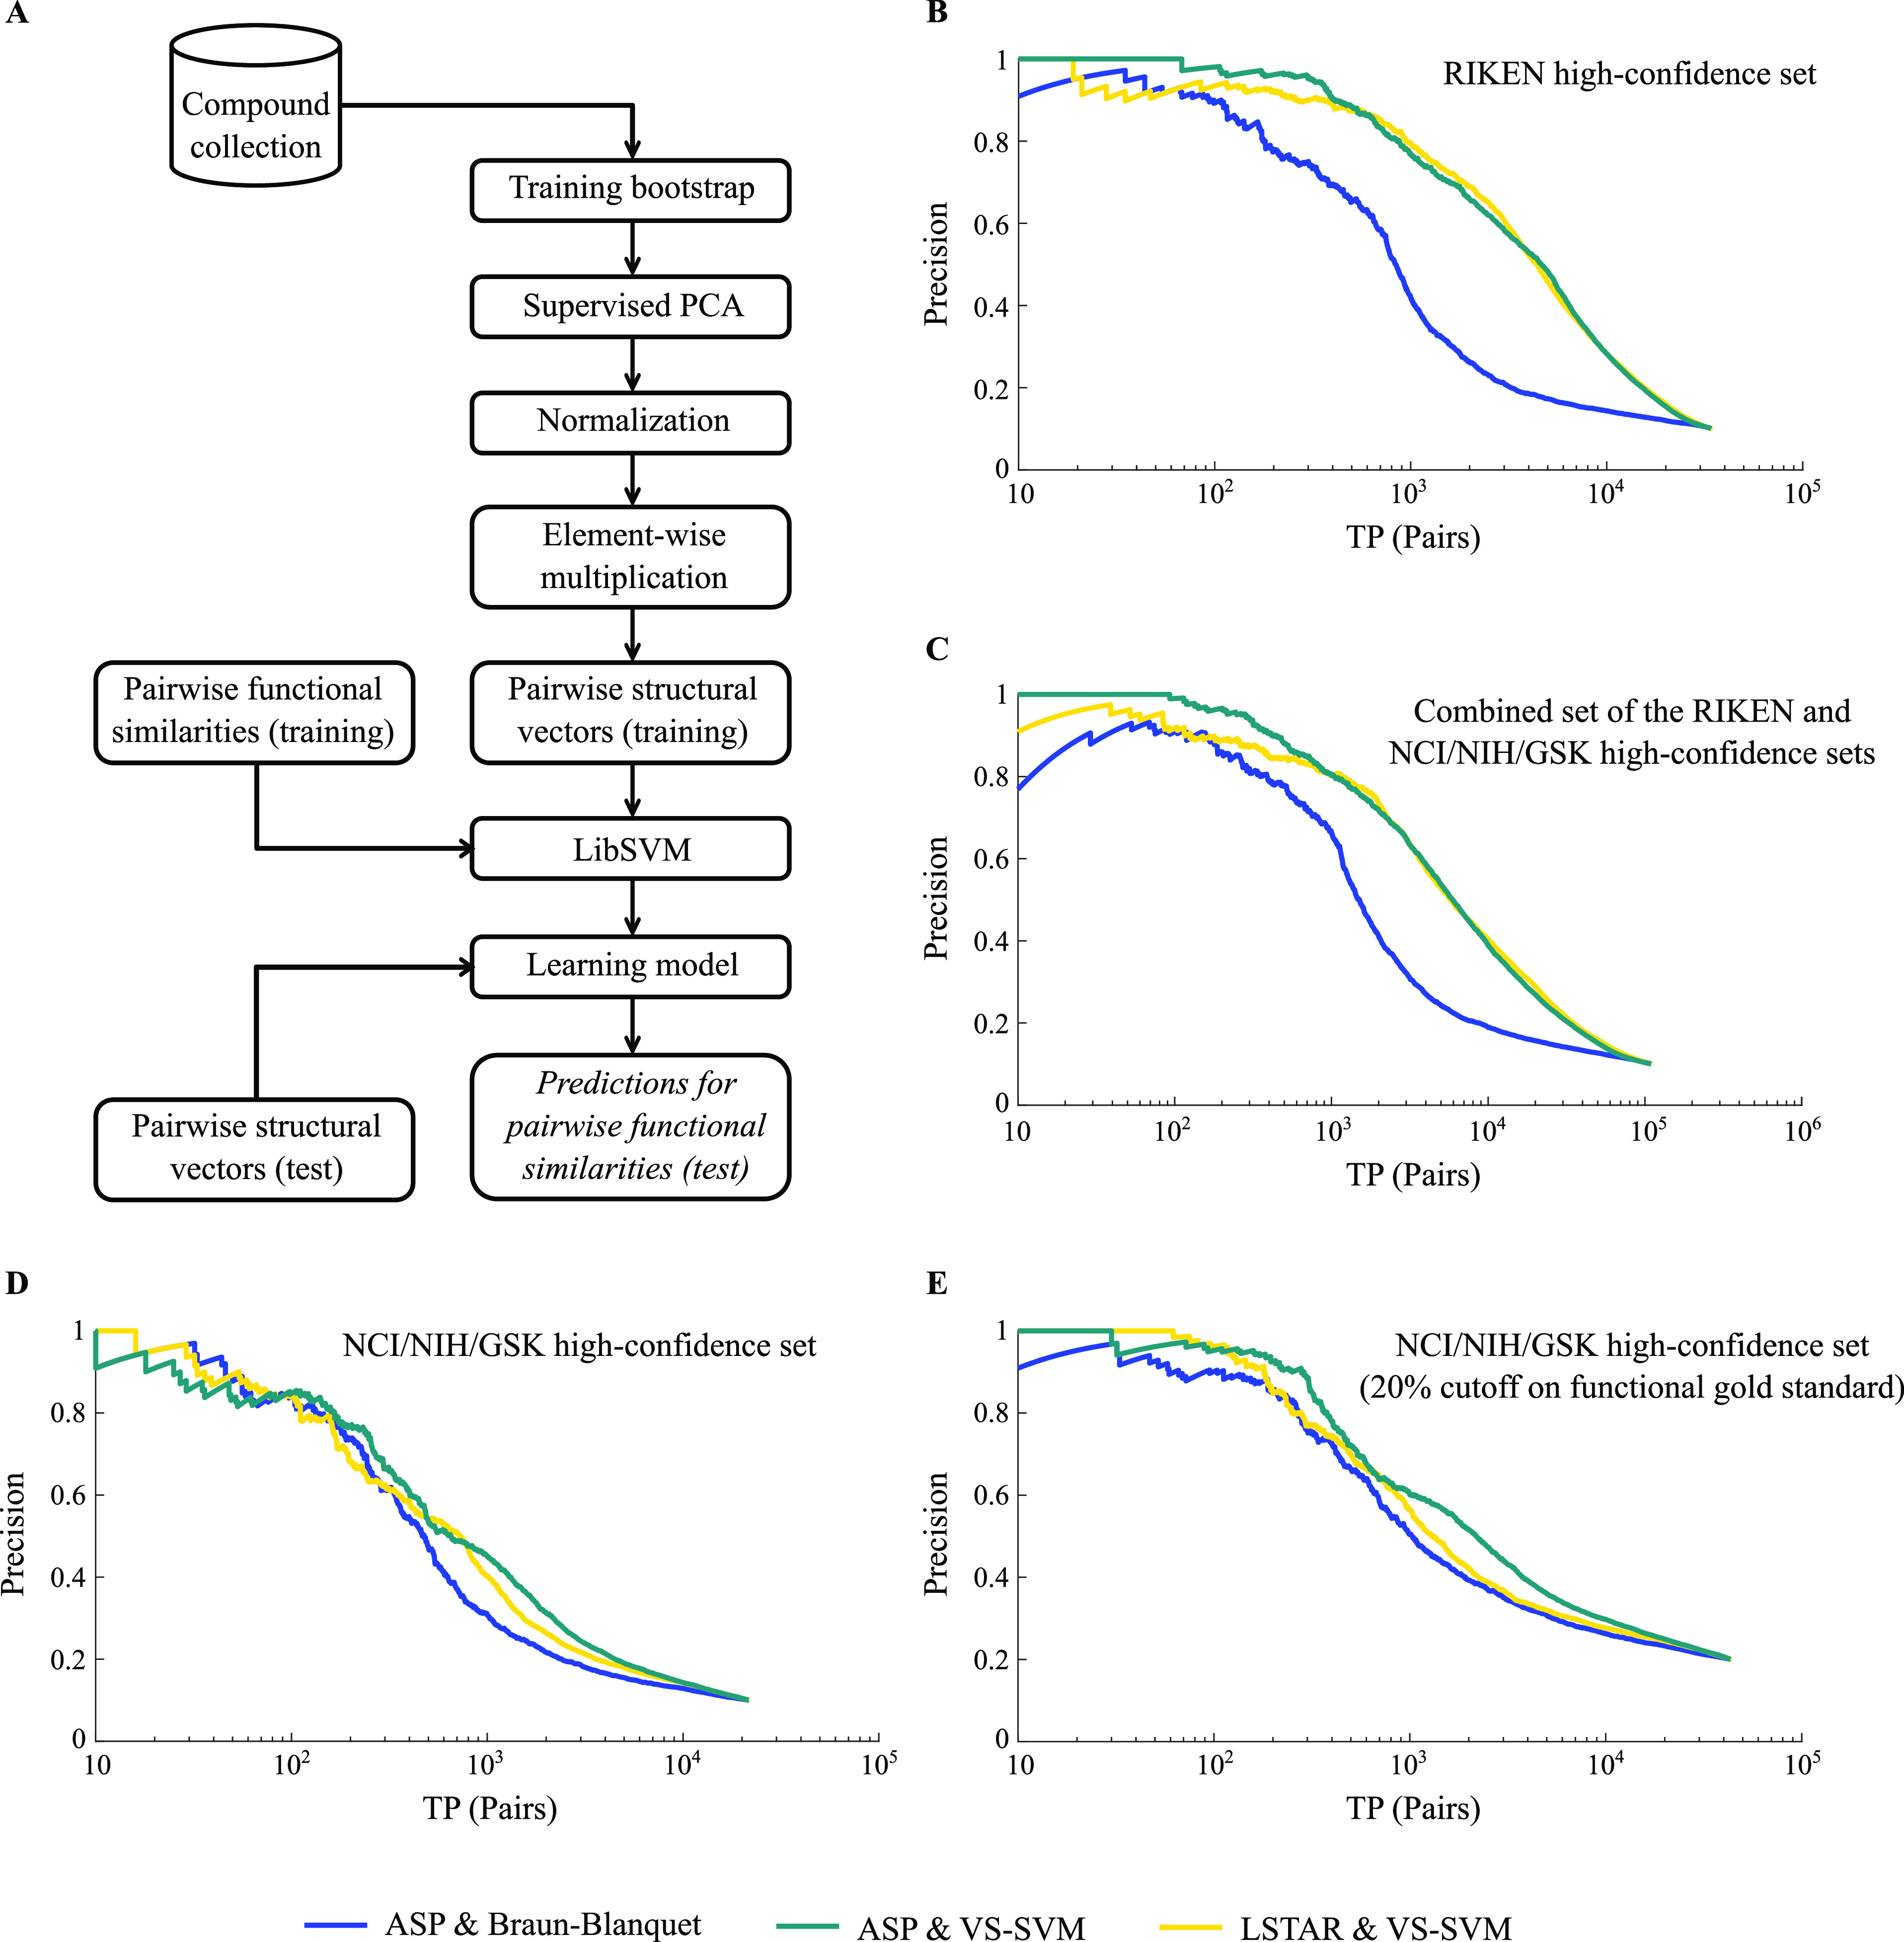
A common strategy for identifying molecules likely to possess a desired biological activity is to search large databases of compounds for high structural similarity to a query molecule that demonstrates this activity, under the assumption that structural similarity is predictive of similar biological activity. However, efforts to systematically benchmark the diverse array of available molecular fingerprints and similarity coefficients have been limited by a lack of large-scale datasets that reflect biological similarities of compounds. To elucidate the relative performance of these alternatives, we systematically benchmarked 11 different molecular fingerprint encodings, each combined with 13 different similarity coefficients, using a large set of chemical-genetic interaction data from the yeast Saccharomyces cerevisiae as a systematic proxy for biological activity. We found that the performance of different molecular fingerprints and similarity coefficients varied substantially and that the all-shortest path fingerprints paired with the Braun-Blanquet similarity coefficient provided superior performance that was robust across several compound collections. We further proposed a machine learning pipeline based on support vector machines that offered a fivefold improvement relative to the best unsupervised approach. Our results generally suggest that using high-dimensional chemical-genetic data as a basis for refining molecular fingerprints can be a powerful approach for improving prediction of biological functions from chemical structures.


Conflict of interest statement

The authors declare no competing financial interest.

Figures

Figure 1
Figure 1
Ligand-based virtual screening of a target (e.g., NPD2186 from RIKEN Natural Product Depository). We ranked all compounds (top four shown) of the MOSAIC database (http://mosaic.cs.umn.edu) in descending order of structural similarity to the target molecule based on the SPP. We described these compounds using all-shortest path (ASP) fingerprints (depth 8) and measured structural similarity using the Braun-Blanquet similarity coefficient. In this example rank list, three compounds except NPD4974 have a very similar chemical–genetic interaction profile to that of NPD2186.
Figure 2
Figure 2
Performance of selected prediction models using our RIKEN high-confidence set (Table S1 for the complete evaluation of all prediction models). (A) Precision at several recall thresholds and the area under the ROC curve for each model, where a molecular fingerprint was paired with the Braun-Blanquet, Cosine, or Tanimoto similarity coefficient, evaluated based on chemical–genetic similarity as the gold standard for biological activity. The blue values represent the highest precision achieved at a given recall, and the green values represent the average precision over all molecular fingerprints for a similarity coefficient at a specific recall threshold. (B) Relative performance of ASP, LSTAR, and RAD2D fingerprints to that of ECFP. For all the molecular fingerprints that required a depth of description, precision was measured at a depth of 8. With the exception of ASP, LSTAR, and RAD2D, the remaining molecular fingerprints are coded as FP1–FP11 (Table 1).
Figure 3
Figure 3
Performance of selected prediction models using our NCI/NIH/GSK high-confidence set (Table S2 for the complete evaluation of all prediction models). (A) Precision at several recall thresholds and the area under the ROC curve for each model, where a molecular fingerprint was paired with the Braun-Blanquet, Cosine, or Tanimoto similarity coefficient, evaluated based on chemical–genetic similarity as the gold standard for biological activity. The blue values represent the highest precision achieved at a given recall threshold, and the green values represent the average precision over all molecular fingerprints for a given similarity coefficient at a specific recall threshold. (B) Relative performance of ASP, LSTAR, and RAD2D fingerprints to that of ECFP. For all the molecular fingerprints that required a depth of description, precision was measured at a depth of 8. With the exception of ASP, LSTAR, and RAD2D, the remaining molecular fingerprints are coded as FP1–FP11 (Table 1).
Figure 4
Figure 4
Impact of the describing depth of molecular fingerprints on the RIKEN high-confidence set. We measured the precision of our prediction models at 10 molecular depths, ranging from 2 to 20, for five different molecular fingerprints. Similarities were calculated with the Braun-Blanquet similarity coefficient, and the precision at three different recall thresholds for each molecular depth is shown.
Figure 5
Figure 5
Prediction performance of machine learning models. (A) Learning pipeline for one bootstrap using pairwise structural vectors (Materials and Methods). (B) Model performance for our RIKEN high-confidence set. The blue precision–recall (PR) curve represents the prediction performance of our best structural similarity measure (ASP/Braun-Blanquet), whereas the teal and gold PR curves represent the performance of our machine learning models using ASP and LSTAR fingerprints, respectively. A prediction is considered a true positive if the compound pair is within the top 10% of functionally similar compound pairs using chemical–genetic interaction profiles. We used pairwise true positives or TP (pairs) as a general form of recall in our PR curves. (C) Model performance for the combined RIKEN and NCI/NIH/GSK high-confidence sets. (D) Model performance for the NCI/NIH/GSK high-confidence set. (E) Model performance for the NCI/NIH/GSK high-confidence set (as in panel (D)), except using top 20% of pairwise chemical–genetic similarities to define true positives.
Figure 6
Figure 6
Functional and structural clusters of top true positive pairs for our RIKEN high-confidence set. (A) Distribution of 10 functional clusters generated by the K-means clustering algorithm using our chemical–genetic interaction profiles. The blue cluster represents the largest functional cluster. (B,C) Contribution of these functional clusters to the top true positive pairs retrieved by (B) our machine learning model and (C) our best structural similarity measure (ASP/Braun-Blanquet). (D) Distribution of 10 structural clusters generated by the K-medoids clustering algorithm using ASP fingerprints. (E–F) Contribution of these structural clusters to the top true positive pairs introduced by (E) our machine learning model and (F) our best structural similarity measure.
Figure 7
Figure 7
Functional and structural clusters of top true positive pairs for our NCI/NIH/GSK high-confidence set. (A) Distribution of 10 functional clusters generated by the K-means clustering algorithm using our chemical–genetic interaction profiles. (B,C) Contribution of these functional clusters to the top true positive pairs retrieved by (B) our machine learning model and (C) our best structural similarity measure (ASP/Braun-Blanquet). (D) Distribution of 10 structural clusters generated by the K-medoids clustering algorithm using ASP fingerprints. (E,F) Contribution of these structural clusters to the top true positive pairs introduced by (E) our machine learning model and (F) our best structural similarity measure.
Figure 8
Figure 8
Reciprocal evaluation of the prediction performance of structural vs functional similarity and machine learning-based virtual screening of a target (e.g., NPD2186 from the RIKEN high-confidence set). Using (A) RIKEN and (B) NCI/NIH/GSK high-confidence sets, we measured the abilities of structural and chemical–genetic similarities to reciprocally predict each other. The blue curve represents the performance of structural similarity in predicting chemical–genetic similarity, whereas the red curve represents the performance of chemical–genetic similarity in predicting structural similarity. (C) Our machine learning model retrieved biologically similar but structurally dissimilar compounds (determined by the ASP/Braun-Blanquet structural similarity measure) for NPD2186 from our RIKEN high-confidence set. The information table provides the chemical–genetic similarities, ASP/Braun-Blanquet structural similarities, and machine learning-derived predicted similarities for a few of the compounds at the top of the predicted ranked list that are functionally analogous to NPD2186. The highest predictive score generated by our machine learning model was 0.716, retrieving NPD2366 as a functional analogue of NPD2186. The rank of each compound pair comes from the table of all pairwise compound similarities ranked in descending order of predicted machine learning-derived similarities (Table S7).

References

    1. Scannell J. W.; Blanckley A.; Boldon H.; Warrington B. Diagnosing the decline in pharmaceutical R&D efficiency. Nat. Rev. Drug Discovery 2012, 11, 191–200. 10.1038/nrd3681. - DOI - PubMed
    1. Munos B. Lessons from 60 years of pharmaceutical innovation. Nat. Rev. Drug Discovery 2009, 8, 959–968. 10.1038/nrd2961. - DOI - PubMed
    1. DiMasi J. A.; Grabowski H. G.; Hansen R. W. Innovation in the pharmaceutical industry: New estimates of R&D costs. J. Health Econ. 2016, 47, 20–33. 10.1016/j.jhealeco.2016.01.012. - DOI - PubMed
    1. Johnson M. A.; Maggiora G. M.. Concepts and Applications of Molecular Similarity; Wiley, 1990. (accessed July 17, 2020). https://agris.fao.org/agris-search/search.do?recordID=US201300674768.
    1. Bajorath J. Integration of virtual and high-throughput screening. Nat. Rev. Drug Discovery 2002, 1, 882–894. 10.1038/nrd941. - DOI - PubMed

Publication types

LinkOut - more resources