

Assay Harmonization and Use of Biological Standards To Improve the Reproducibility of the Hemagglutination Inhibition Assay: a FLUCOP Collaborative Study
- PMID: 34319129
- PMCID: PMC8530177
- DOI: 10.1128/mSphere.00567-21
Assay Harmonization and Use of Biological Standards To Improve the Reproducibility of the Hemagglutination Inhibition Assay: a FLUCOP Collaborative Study
Abstract
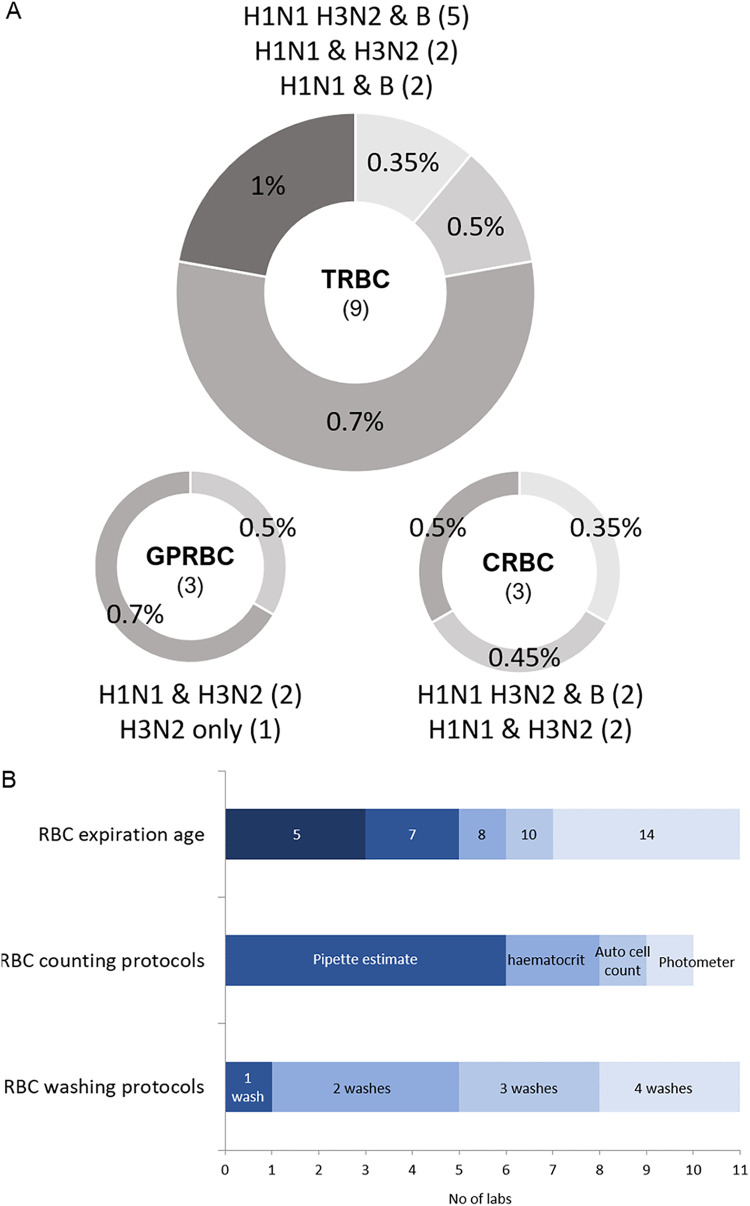
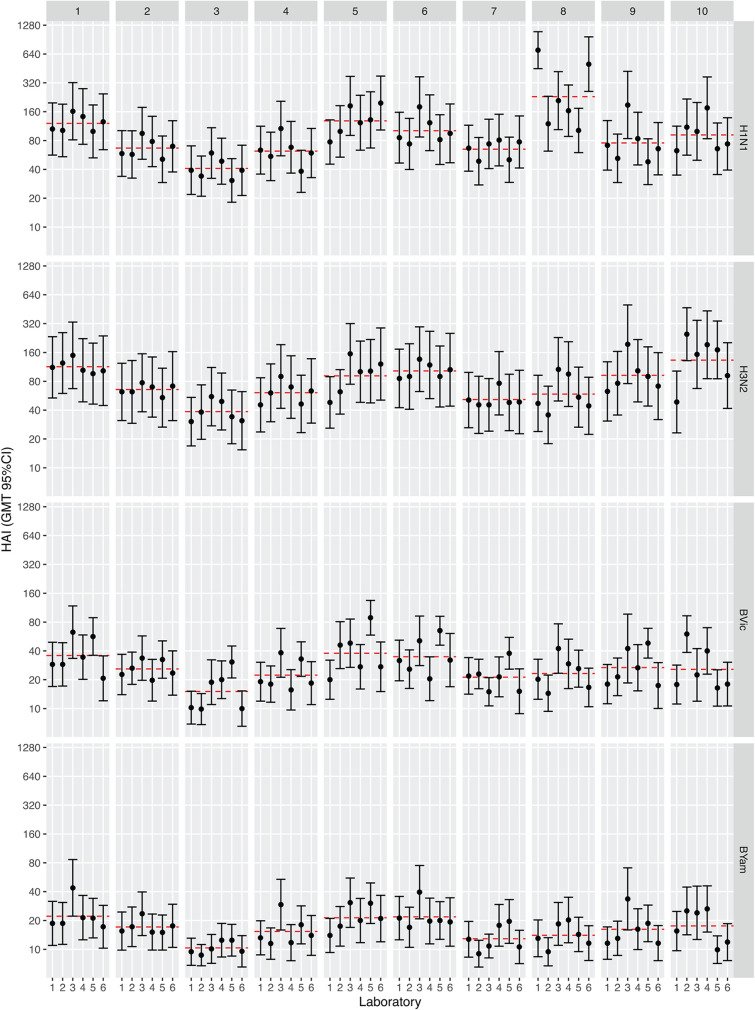
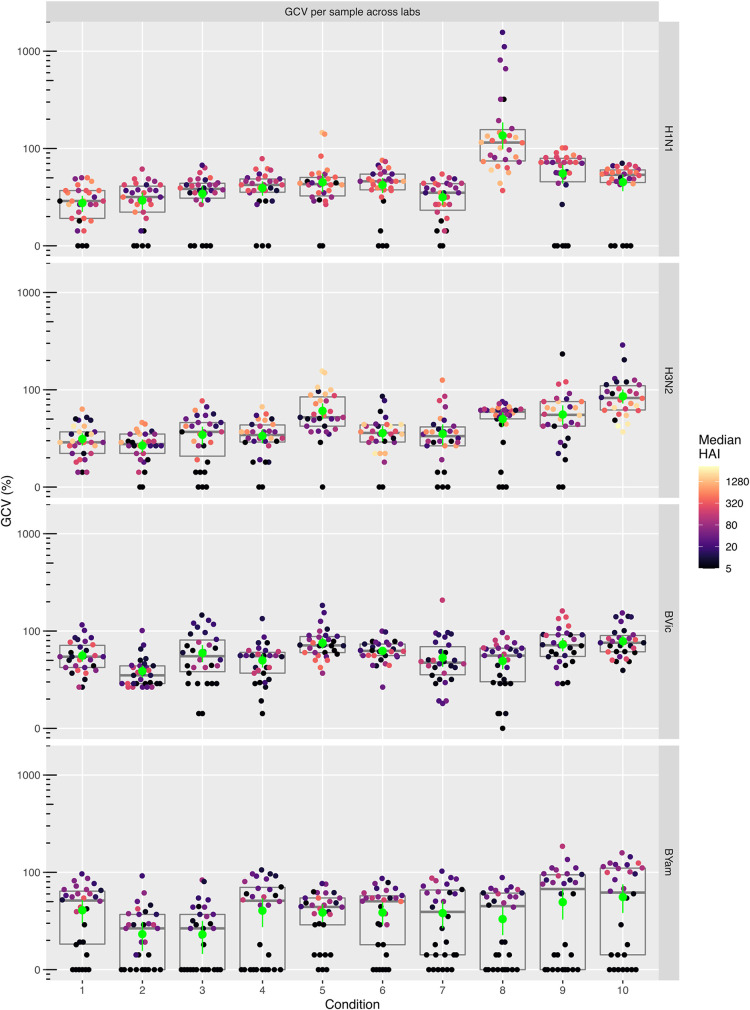
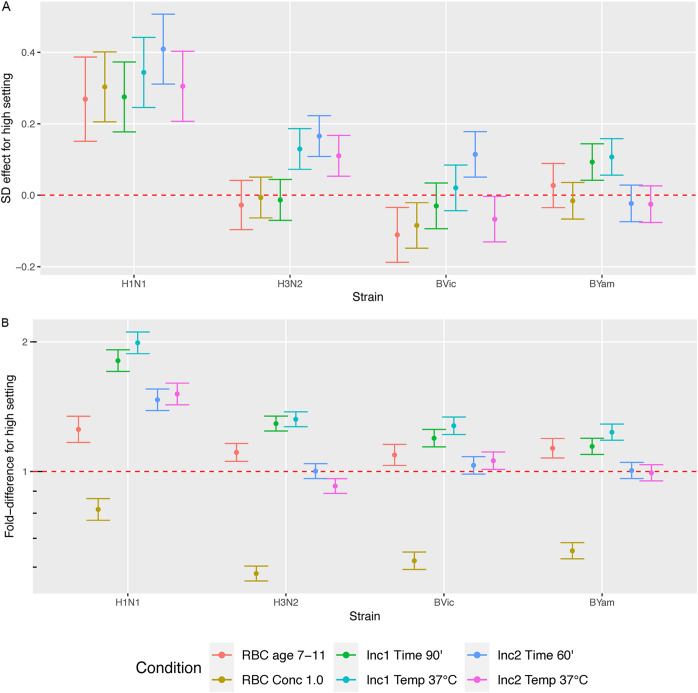
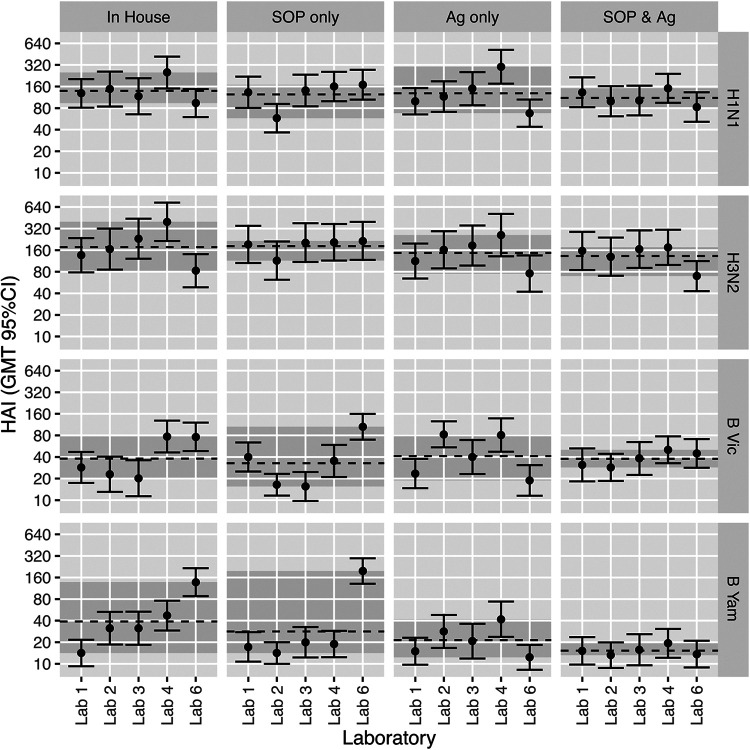
The hemagglutination inhibition (HAI) assay is an established technique for assessing influenza immunity, through measurement of antihemagglutinin antibodies. Improved reproducibility of this assay is required to provide meaningful data across different testing laboratories. This study assessed the impact of harmonizing the HAI assay protocol/reagents and using standards on interlaboratory variability. Human pre- and postvaccination sera from individuals (n = 30) vaccinated against influenza were tested across six laboratories. We used a design of experiment (DOE) method to evaluate the impact of assay parameters on interlaboratory HAI assay variability. Statistical and mathematical approaches were used for data analysis. We developed a consensus protocol and assessed its performance against in-house HAI testing. We additionally tested the performance of several potential biological standards. In-house testing with four reassortant viruses showed considerable interlaboratory variation (geometric coefficient of variation [GCV] range of 50% to 117%). The age, concentration of turkey red blood cells, incubation duration, and temperature were key assay parameters affecting variability. Use of a consensus protocol with common reagents, including viruses, significantly reduced GCV between laboratories to 22% to 54%. Pooled postvaccination human sera from different vaccination campaigns were effective as biological standards. Our results demonstrate that the harmonization of protocols and critical reagents is effective in reducing interlaboratory variability in HAI assay results and that pools of postvaccination human sera have potential as biological standards that can be used over multiple vaccination campaigns. Moreover, the use of standards together with in-house protocols is as potent as the use of common protocols and reagents in reducing interlaboratory variability. IMPORTANCE The hemagglutination inhibition (HAI) assay is the most commonly used serology assay to detect antibodies from influenza vaccination or influenza virus infection. This assay has been used for decades but requires improved standardization of procedures to provide meaningful data. We designed a large study to assess selected parameters for their contribution to assay variability and developed a standard protocol to promote consistent HAI testing methods across laboratories. The use of this protocol and common reagents resulted in lower levels of variability in results between participating laboratories than achieved using in-house HAI testing. Human sera sourced from vaccination campaigns over several years, and thus including antibody to different influenza vaccine strains, served as effective assay standards. Based on our findings, we recommend the use of a common protocol and/or human serum standards, if available, for testing human sera for the presence of antibodies against seasonal influenza using turkey red blood cells.
Keywords: hemagglutination inhibition assay; influenza; serology; standardization.
Figures


Similar articles
-
Haemagglutination inhibition and virus microneutralisation serology assays: use of harmonised protocols and biological standards in seasonal influenza serology testing and their impact on inter-laboratory variation and assay correlation: A FLUCOP collaborative study.Front Immunol. 2023 Apr 18;14:1155552. doi: 10.3389/fimmu.2023.1155552. eCollection 2023. Front Immunol. 2023. PMID: 37143658 Free PMC article.
-
Standardization of Hemagglutination Inhibition Assay for Influenza Serology Allows for High Reproducibility between Laboratories.Clin Vaccine Immunol. 2016 Jan 27;23(3):236-42. doi: 10.1128/CVI.00613-15. Clin Vaccine Immunol. 2016. PMID: 26818953 Free PMC article.
-
Interlaboratory Reproducibility of Standardized Hemagglutination Inhibition Assays.mSphere. 2022 Feb 23;7(1):e0095321. doi: 10.1128/msphere.00953-21. Epub 2022 Feb 23. mSphere. 2022. PMID: 35196123 Free PMC article.
-
H3N2 influenza viruses in humans: Viral mechanisms, evolution, and evaluation.Hum Vaccin Immunother. 2018;14(8):1840-1847. doi: 10.1080/21645515.2018.1462639. Epub 2018 May 14. Hum Vaccin Immunother. 2018. PMID: 29641358 Free PMC article. Review.
-
Priming with MF59 adjuvanted versus nonadjuvanted seasonal influenza vaccines in children - A systematic review and a meta-analysis.Vaccine. 2020 Jan 16;38(3):608-619. doi: 10.1016/j.vaccine.2019.10.053. Epub 2019 Nov 15. Vaccine. 2020. PMID: 31735505
Cited by
-
H3N2 influenza hemagglutination inhibition method qualification with data driven statistical methods for human clinical trials.Front Immunol. 2023 Apr 6;14:1155880. doi: 10.3389/fimmu.2023.1155880. eCollection 2023. Front Immunol. 2023. PMID: 37090729 Free PMC article.
-
Inno4Vac Workshop Report Part 1: Controlled Human Influenza Virus Infection Model (CHIVIM) Strain Selection and Immune Assays for CHIVIM Studies, November 2021, MHRA, UK.Influenza Other Respir Viruses. 2024 Nov;18(11):e70014. doi: 10.1111/irv.70014. Influenza Other Respir Viruses. 2024. PMID: 39496425 Free PMC article. Review.
-
Prevalence of Influenza B/Yamagata Viruses From Season 2012/2013 to 2021/2022 in Italy as an Indication of a Potential Lineage Extinction.Influenza Other Respir Viruses. 2024 Sep;18(9):e13359. doi: 10.1111/irv.13359. Influenza Other Respir Viruses. 2024. PMID: 39257041 Free PMC article.
-
Different antigenic distance metrics generate similar predictions of influenza vaccine response breadth despite moderate correlation.medRxiv [Preprint]. 2025 Jul 2:2025.07.01.25330674. doi: 10.1101/2025.07.01.25330674. medRxiv. 2025. PMID: 40630575 Free PMC article. Preprint.
-
First Among Equals: The Case for High-quality Clinical Data in Influenza Vaccines.Clin Infect Dis. 2025 Aug 1;81(1):7-9. doi: 10.1093/cid/ciaf290. Clin Infect Dis. 2025. PMID: 40662851 Free PMC article. No abstract available.
References
-
- World Health Organization. 2018. Influenza (seasonal). WHO fact sheet. World Health Organization, Geneva, Switzerland. https://www.who.int/news-room/fact-sheets/detail/influenza-(seasonal).
-
- Laurie KL, Huston P, Riley S, Katz JM, Willison DJ, Tam JS, Mounts AW, Hoschler K, Miller E, Vandemaele K, Broberg E, Van Kerkhove MD, Nicoll A. 2013. Influenza serological studies to inform public health action: best practices to optimise timing, quality and reporting. Influenza Other Respir Viruses 7:211–224. doi:10.1111/j.1750-2659.2012.0370a.x. - DOI - PMC - PubMed
Publication types
MeSH terms
Substances
LinkOut - more resources
Full Text Sources
Medical
