. 2021 Sep 27;95(20):e0083721.
doi: 10.1128/JVI.00837-21. Epub 2021 Jul 28.

IFITM Proteins That Restrict the Early Stages of Respiratory Virus Infection Do Not Influence Late-Stage Replication

Affiliations

IFITM Proteins That Restrict the Early Stages of Respiratory Virus Infection Do Not Influence Late-Stage Replication

Tina Meischel et al. J Virol. .

Abstract

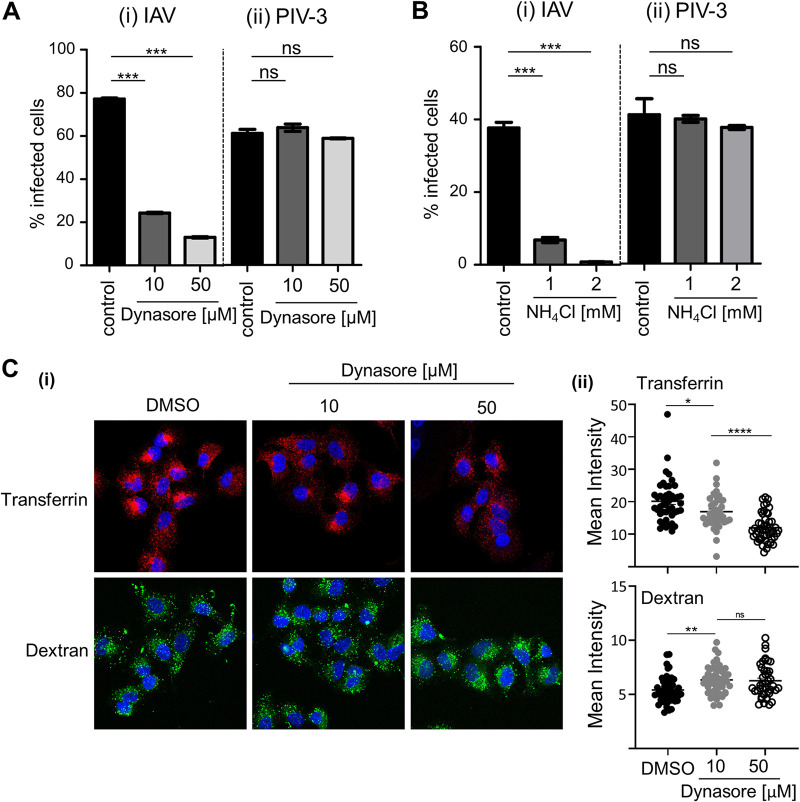
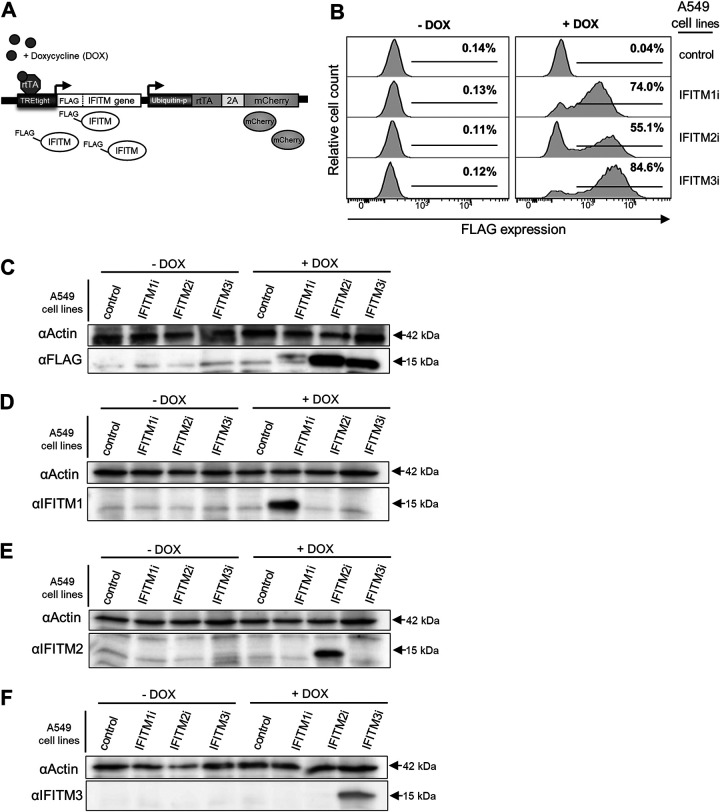
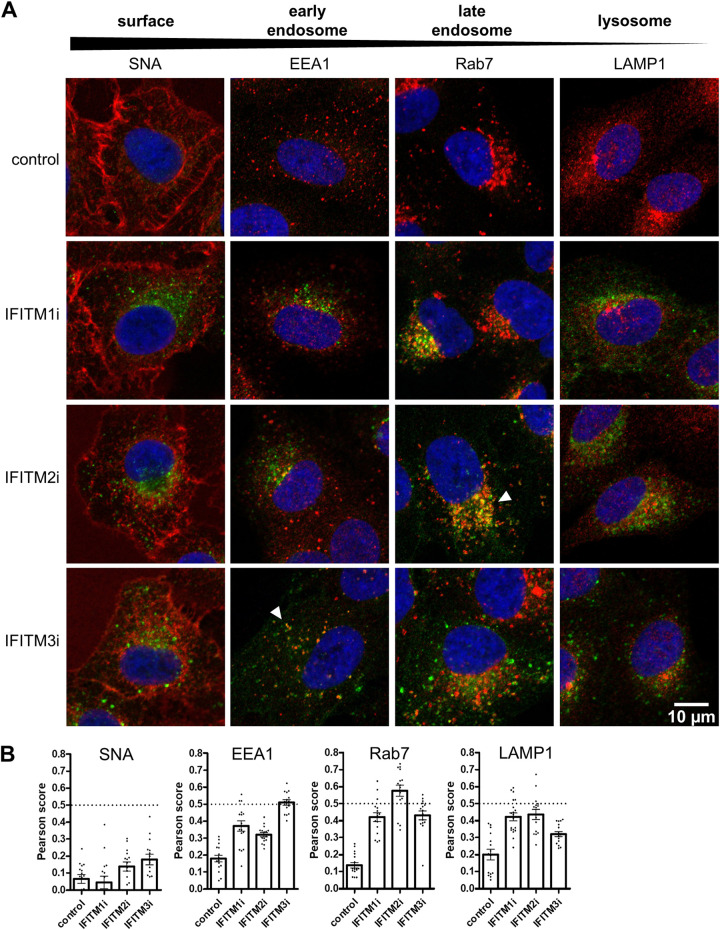
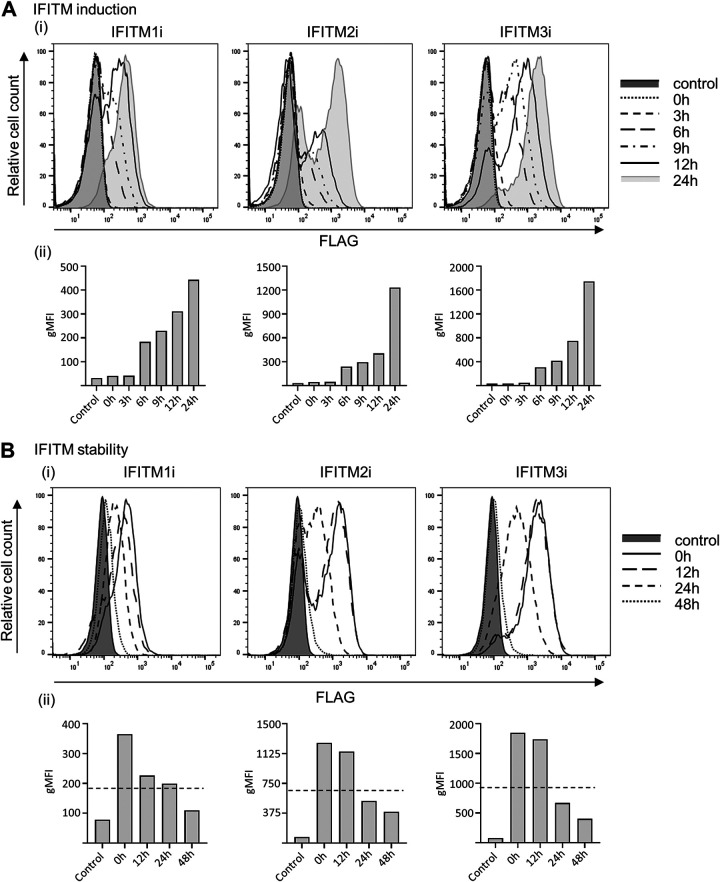
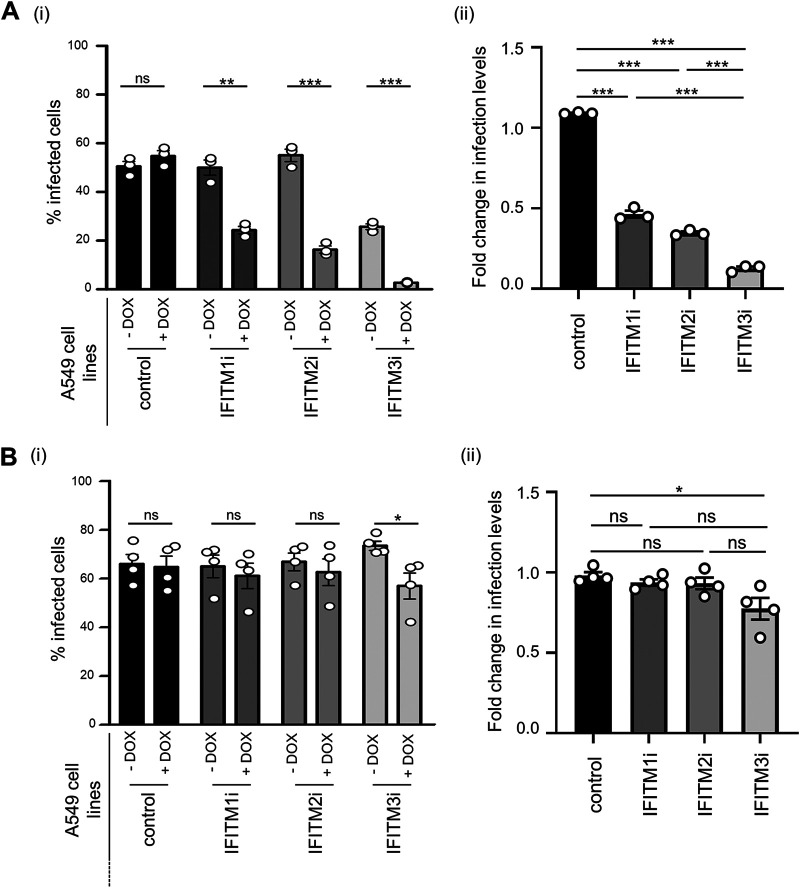
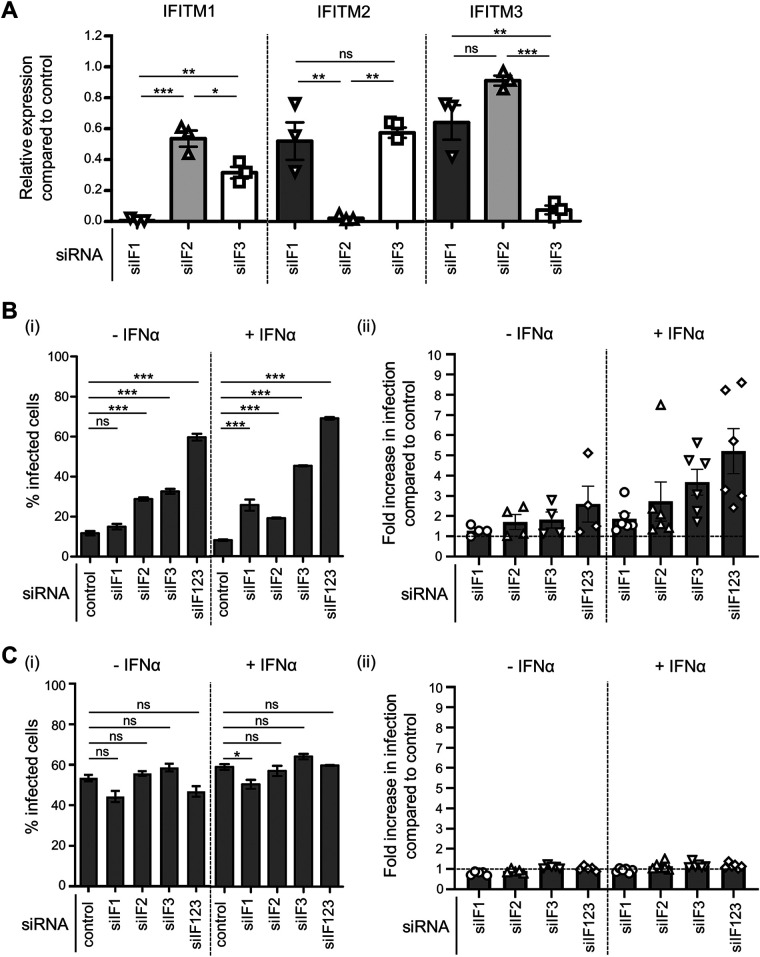
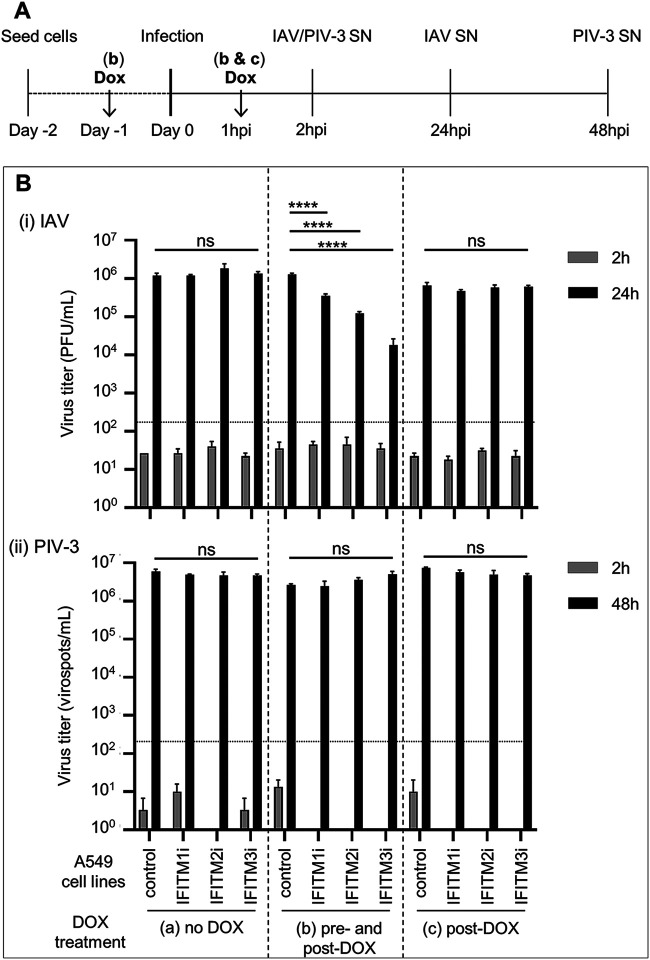
Interferon-induced transmembrane (IFITM) proteins inhibit a broad range of enveloped viruses by blocking entry into host cells. We used an inducible overexpression system to investigate if IFITM1, IFITM2, and IFITM3 could modulate early and/or late stages of influenza A virus (IAV) or parainfluenza virus 3 (PIV-3) infection in human A549 airway epithelial cells. IAV and PIV-3 represent respiratory viruses which utilize distinct cellular entry pathways. We verify entry by endocytosis for IAV, whereas PIV-3 infection was consistent with fusion at the plasma membrane. Following induction prior to infection, all three IFITM proteins restricted the percentage of IAV-infected cells at 8 hours postinfection. In contrast, prior induction of IFITM1 and IFITM2 did not inhibit PIV-3 infection, although a modest reduction was observed with IFITM3. Small interfering RNA (siRNA)-mediated knockdown of endogenous IFITM1, IFITM2, and IFITM3 expression, in the presence or absence of pretreatment with type I interferon, resulted in increased IAV, but not PIV-3, infection. This finding suggests that while all three IFITMs display antiviral activity against IAV, they do not restrict the early stages of PIV-3 infection. IAV and PIV-3 infection culminates in viral egress through budding at the plasma membrane. Inducible expression of IFITM1, IFITM2, or IFITM3 immediately after infection did not impact titers of infectious virus released from IAV- or PIV-3-infected cells. Our findings show that IFITM proteins differentially restrict the early stages of infection of two respiratory viruses with distinct cellular entry pathways but do not influence the late stages of replication for either virus. IMPORTANCE Interferon-induced transmembrane (IFITM) proteins restrict the initial stages of infection for several respiratory viruses; however, their potential to modulate the later stages of virus replication has not been explored. In this study, we highlight the utility of an inducible overexpression system to assess the impact of IFITM proteins on either early- or late-stage replication of two respiratory viruses. We demonstrate antiviral activity by IFITM1, IFITM2, and IFITM3 against influenza A virus (IAV) but not parainfluenza virus 3 (PIV-3) during the early stages of cellular infection. Furthermore, IFITM induction following IAV or PIV-3 infection does not restrict the late stages of replication of either virus. Our findings show that IFITM proteins can differentially restrict the early stages of infection of two viruses with distinct cellular entry pathways and yet do not influence the late stages of replication for either virus.

Keywords: IFITM; host restriction factors; influenza; parainfluenza virus.


Figures

FIG 1
FIG 1
Pathways of infectious entry of IAV and PIV into A549 cells. Monolayers of A549 cells were pretreated with dynasore prior to infection with IAV (MOI, 1) or PIV-3 (MOI, 2) (A) or pretreated and infected in the presence of NH4Cl with IAV (MOI, 1) or PIV-3 (MOI, 2) (B). The percentage of infected cells was determined by quantitation of IAV NP-positive cells at 8 hpi or PIV-3 HN-positive cells at 18 hpi using flow cytometry. Data from 1 of 3 independent experiments performed in triplicate is shown. (C) Alexa Fluor-647-conjugated transferrin (red) or FITC-conjugated high-molecular-weight (MW) dextran (70,000) (green) was used to validate the specificity of dynasore in blocking endocytic entry of transferrin into A549 cells via fluorescence microscopy. (C) (i) Representative merged images, including DAPI staining for the nucleus (blue) are shown. ×63 magnification. (C) (ii) Mean intensity of fluorescent signal for transferrin or dextran was measured across the cell area (area mean) using ImageJ. Each data point represents the mean fluorescence intensity of one cell (n ≥ 40 for each treatment). (A, B, and C) Error bars = SEM. (****, P ≤ 0.0001; ***, P ≤ 0.001; **, P ≤ 0.01; *, P ≤ 0.05; ns, P > 0.05; significance by one-way analysis of variance [ANOVA] with Tukey’s multiple comparative analysis).
FIG 2
FIG 2
Characterization of A549 cells with inducible IFITM1, IFITM2, or IFITM3 overexpression. (A) Lentiviral transduction was used to generate A549 cell lines with DOX-inducible expression of IFITM1, IFITM2, or IFITM3 proteins, each with an N-terminal FLAG tag (IFITM1i, IFITM2i, and IFITM3i cell lines). Constitutive expression of mCherry was used to determine transduction efficiency during the generation of each cell line. Control A549 cells express an irrelevant inducible protein without a FLAG-tag. (B) Flow cytometric analysis of FLAG expression in IFITM1i, IFITM2i, and IFITM3i A549 cell lines following culture for 24 hours in media supplemented with (+DOX) or without (−DOX) doxycycline. (C, D, E, and F) IFITMs were induced in A549 cells by DOX treatment for 24 hours, and expression of each specific IFITM (approximately 15 kDa in size) in cell lysates was confirmed by Western blotting. Proteins were detected using anti-FLAG antibody (C) or antibodies specific for IFITM1 (D), IFITM2 (E), or IFITM3 (F). Beta-actin (42 kDa) was used as a protein loading control.
FIG 3
FIG 3
Localization of inducible IFITM1, IFITM2, and IFITM3 proteins expressed in A549 cells. Control, IFITM1i, IFITM2i, or IFITM3i A549 cells were cultured in the presence of DOX for 24 hours to induce IFITM expression before cells were fixed and stained with an anti-FLAG antibody in conjunction with Alexa Fluor-488-conjugated antibody (green). (A) Cellular compartments were visualized by staining with SNA (cell surface), EEA1 (early endosomes), Rab7 (late endosomes), or LAMP1 (lysosomes) antibodies in conjunction with Alexa Fluor-647-conjugated antibody (red). White arrows indicate areas of colocalization between FLAG staining and SNA, EEA1, Rab7, or LAMP1 staining. Nuclei were stained with DAPI (blue). Images were acquired at ×63 magnification. (B) The Pearson’s coefficient (R) value was calculated between signals in the green and red channels (from at least 15 cells for each sample). The dotted line at 0.5 represents the threshold for colocalization. Mean values are presented as a bar graph, and error bars represent SEM. Control A549 cells express an irrelevant inducible protein without a FLAG-tag.
FIG 4
FIG 4
Kinetics of induction and stability of IFITM1, IFITM2, and IFITM3 expression in A549 cell lines. (A and B) FLAG expression in IFITM1i, IFITM2i, and IFITM3i A549 cell lines at different times (0 to 24 hours) post-DOX induction (IFITM induction) (A) and different times after withdrawal of DOX, where cells were DOX induced for 24 hours and then washed and cultured in DOX-free media (0 to 48 hours) (IFITM stability) (B). For both (A) and (B), representative histograms from 2 independent experiments are displayed in (i) and the geometric mean fluorescent intensity (gMFI) of each histogram is graphed in (ii). The dotted-line in (Bii) represents half-maximal IFITM expression.
FIG 5
FIG 5
Impact of inducible IFITM protein expression on IAV and PIV-3 infection of A549 cells. (A and B) A549 cells cultured for 24 hours in the absence (−DOX) or presence (+DOX) of doxycycline to induce IFITM expression were subsequently infected with IAV (MOI, 1) (A) or PIV-3 (MOI, 0.8) (B). (i) The percentage of virus-infected cells was determined by staining for IAV NP at 8 hpi or PIV-3 HN protein at 18 hpi, followed by flow cytometry. (***, P ≤ 0.001; **, P ≤ 0.01; *, P ≤ 0.05; ns, P > 0.05; unpaired, two-tailed t test). (ii) Fold change in the percentage of virus-infected cells in the presence or absence of each IFITM. (***, P ≤ 0.001; **, P ≤ 0.01; *, P ≤ 0.05; ns, P > 0.05; significance by one-way analysis of variance [ANOVA] with Tukey’s multiple comparative analysis). For IAV, data are representative of three independent experiments performed in triplicate. For PIV-3, data are pooled from four independent experiments performed in triplicate. Error bars represent the SEM. Control A549 cells express an irrelevant inducible protein.
FIG 6
FIG 6
siRNA knockdown of endogenous IFITM1, IFITM2, and IFITM3 in A549 cells. (A) Quantitation of IFITM1, IFITM2, and IFITM3 mRNA in A549 cells treated with siRNA targeting IFITM1 (siIF1), IFITM2 (siIF2), or IFITM3 (siIF3) or nontargeting siRNA (control). A549 cells were transfected with 5 nM siRNA for 72 hours, including during overnight treatment with IFN-α prior to RNA isolation. Expression of each IFITM gene was normalized to the expression of GAPDH. The relative expression levels of IFITM1, IFTIM2, and IFITM3 mRNA in siIF-treated A549 cells compared with those of control-siRNA treated A549 cells are shown. Data are pooled from three independent experiments performed in triplicate. (Bi) A549 cells were treated with siIF1, siIF2, siIF3, pooled siRNA (siIF123), or control siRNA and 48 hours later were incubated in the presence (+IFN-α) or absence (−IFN-α) of IFN-α for an additional 18 to 24 hours. After being washed, cells were then infected with IAV at an MOI of 1 in the absence of IFN-α or at an MOI of 10 in the presence of IFN-α, such that similar baseline levels of infection were obtained in the presence or absence of IFN-α. The percentage of infected cells was determined by staining with anti-IAV NP at 8 hpi. Data are representative of four independent experiments performed in triplicate. Error bars depict SEM. (***, P ≤ 0.001; **, P ≤ 0.01; *, P ≤ 0.05; ns, P > 0.05; significance by one-way analysis of variance [ANOVA] with Tukey’s multiple comparative analysis). (Bii) Fold increase in IAV infection between A549 cells treated with IFITM-specific siRNA compared with infection levels in cells treated with control siRNA (dotted line). Data were pooled from four independent experiments performed in triplicate. Error bars represent SEM. (Ci) A549 cells were treated with siIF1, siIF2, siIF3, pooled siRNA (siIF123), or control siRNA and 48 hours later were incubated in the presence (+IFN-α) or absence (−IFN-α) of IFN-α for an additional 18 to 24 hours. After washing, cells were then infected with PIV-3 at an MOI of 0.8 in the absence of IFN-α or at an MOI of 8 in the presence of IFN-α, such that similar baseline levels of infection were obtained in the presence or absence of IFN-α. The percentage of infected cells was determined by staining with anti-PIV-3 HN antibody at 18 hpi. Data are representative of four independent experiments performed in triplicate. Error bars depict SEM. (***, P ≤ 0.001; **, P ≤ 0.01; *, P ≤ 0.05; ns, P > 0.05; significance by one-way analysis of variance [ANOVA] with Tukey’s multiple comparative analysis). (Cii) Fold increase in PIV-3 infection between A549 cells treated with IFITM-specific siRNA compared with infection levels in cells treated with control siRNA (dotted line). Data were pooled from four independent experiments performed in triplicate. Error bars represent SEM.
FIG 7
FIG 7
Effect of IFITM expression on the late stages of IAV and PIV-3 replication. Control A549 cells or A549 cells with inducible expression of IFITM1, IFITM2, or IFITM3 were cultured and infected with IAV (MOI, 1) (i) or PIV-3 (MOI, 0.5) (ii) in various experimental conditions, namely, in DOX-free media before and after virus infection (no DOX; group a), pretreated with DOX and with DOX retained in the media throughout the experiment (pre- and post-DOX; group b), or in DOX-free media during incubation with virus before the addition of DOX after washing at 1 hpi (post-DOX, group c). (A) Experimental design. (B) Cell-free supernatants (SNs) were harvested at 2 and 24 hpi for IAV or at 2 and 48 hpi for PIV-3. Titers of infectious virus were determined by plaque assay (IAV) or virospot assay (PIV-3) and expressed as PFU/ml or virospots/ml, respectively. In undiluted supernatant, a minimum of 10 plaques per well (133.4 PFUs/ml) or a minimum of 15 spots per well (150 virospots/ml) were required for an accurate determination of viral titers (limit of detection for the assay, represented as a dotted line). Data are representative of at least two independent experiments performed in triplicate. Error bars are SEM. (****, P ≤ 0.0001; ns, P > 0.05; one-way analysis of variance [ANOVA] with Tukey’s multiple comparative analysis).

Similar articles

Cited by

References

    1. Bailey CC, Zhong G, Huang IC, Farzan M. 2014. IFITM-family proteins: the cell’s first line of antiviral defense. Annu Rev Virol 1:261–283. 10.1146/annurev-virology-031413-085537. - DOI - PMC - PubMed
    1. Perreira JM, Chin CR, Feeley EM, Brass AL. 2013. IFITMs restrict the replication of multiple pathogenic viruses. J Mol Biol 425:4937–4955. 10.1016/j.jmb.2013.09.024. - DOI - PMC - PubMed
    1. McMichael TM, Zhang Y, Kenney AD, Zhang L, Zani A, Lu M, Chemudupati M, Li J, Yount JS. 2018. IFITM3 restricts human metapneumovirus infection. J Infect Dis 218:1582–1591. 10.1093/infdis/jiy361. - DOI - PMC - PubMed
    1. Brass AL, Huang IC, Benita Y, John SP, Krishnan MN, Feeley EM, Ryan BJ, Weyer JL, van der Weyden L, Fikrig E, Adams DJ, Xavier RJ, Farzan M, Elledge SJ. 2009. The IFITM proteins mediate cellular resistance to influenza A H1N1 virus, West Nile virus, and dengue virus. Cell 139:1243–1254. 10.1016/j.cell.2009.12.017. - DOI - PMC - PubMed
    1. Feeley EM, Sims JS, John SP, Chin CR, Pertel T, Chen LM, Gaiha GD, Ryan BJ, Donis RO, Elledge SJ, Brass AL. 2011. IFITM3 inhibits influenza A virus infection by preventing cytosolic entry. PLoS Pathog 7:e1002337. 10.1371/journal.ppat.1002337. - DOI - PMC - PubMed

Publication types

MeSH terms