. 2021 Jul 28:10:e67115.
doi: 10.7554/eLife.67115.

Structure and analysis of nanobody binding to the human ASIC1a ion channel

Affiliations

Structure and analysis of nanobody binding to the human ASIC1a ion channel

Yangyu Wu et al. Elife. .

Abstract

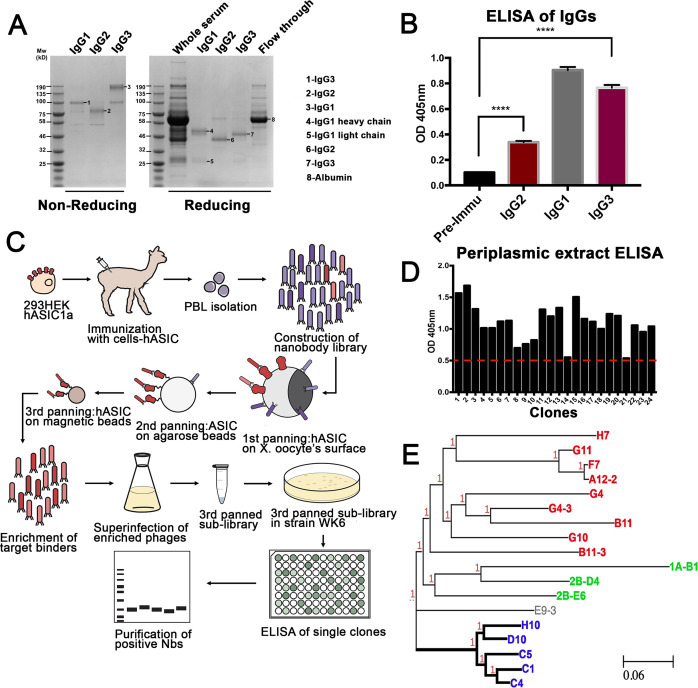
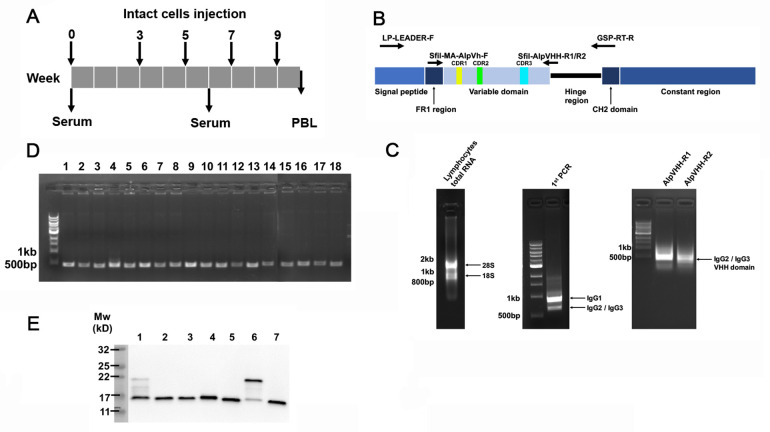
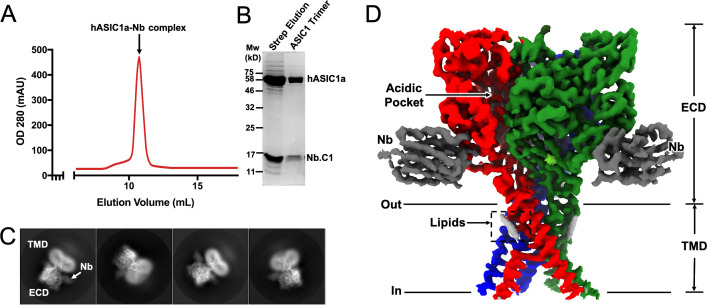
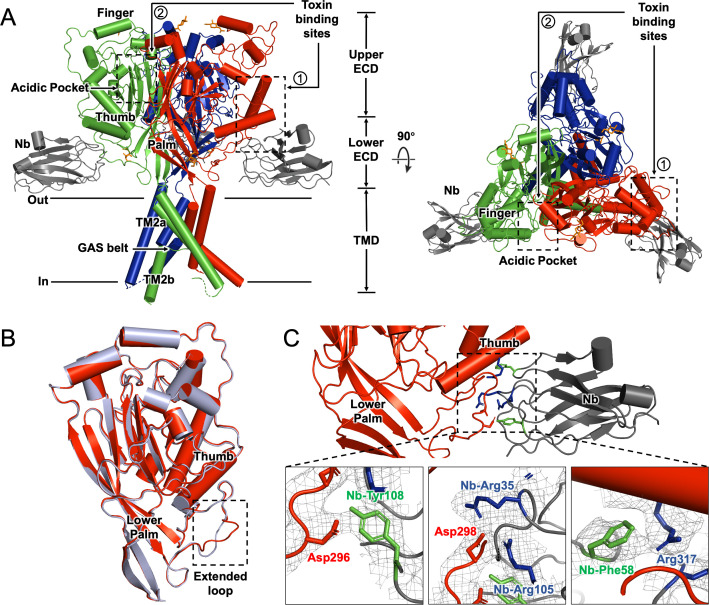
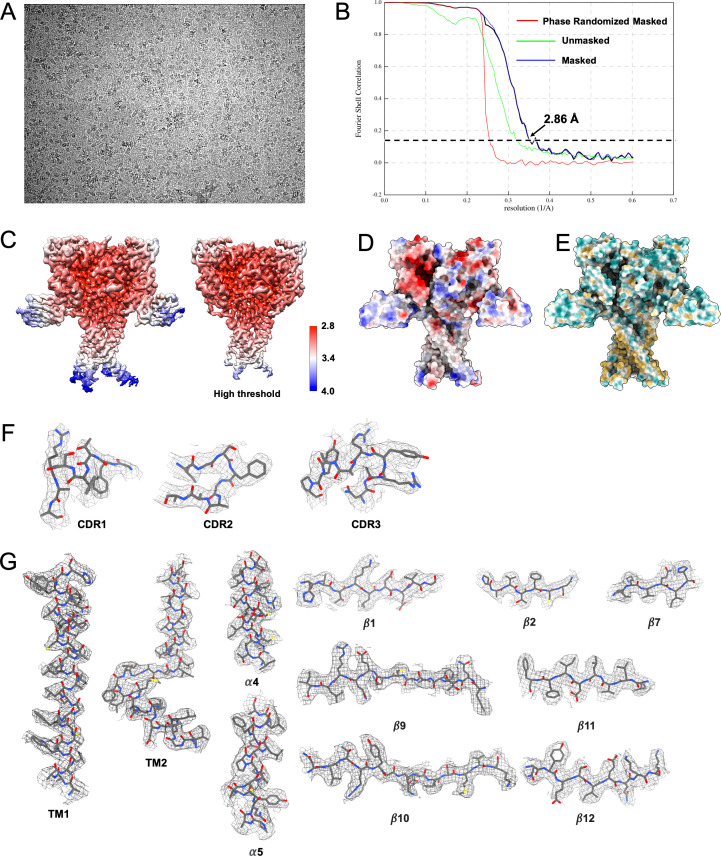
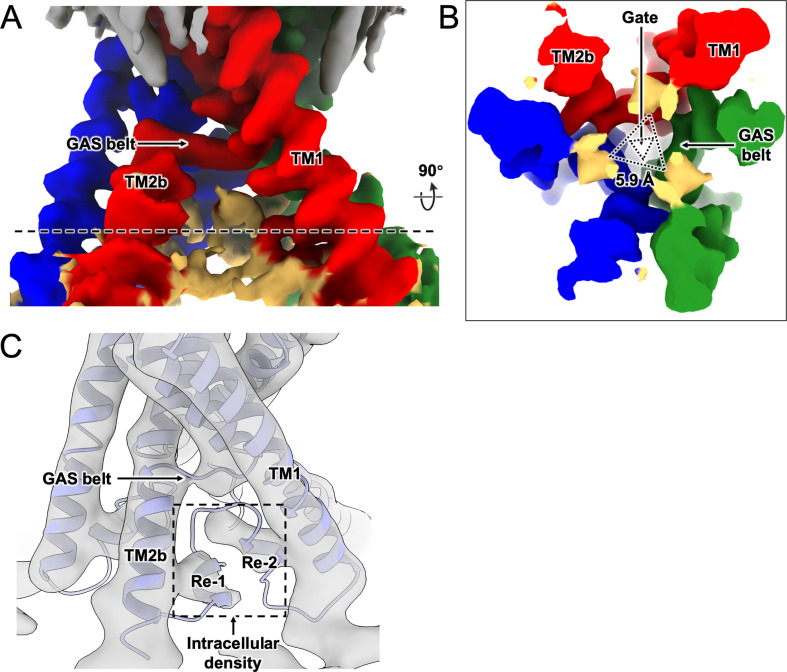
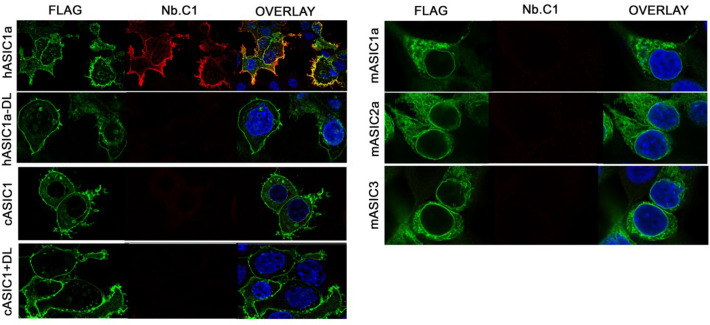
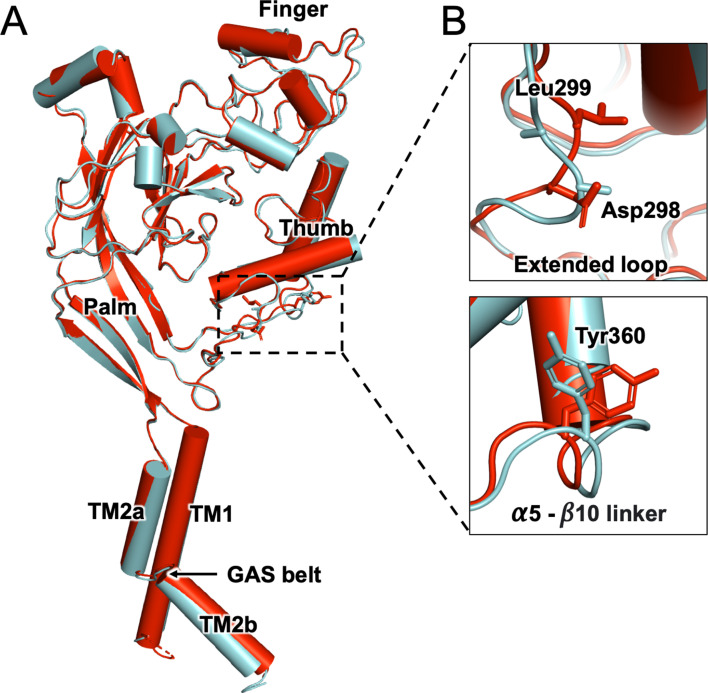
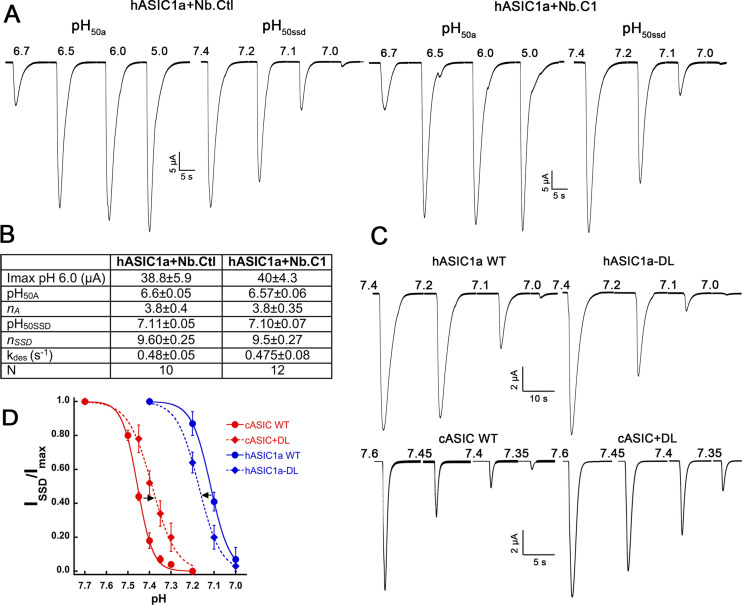
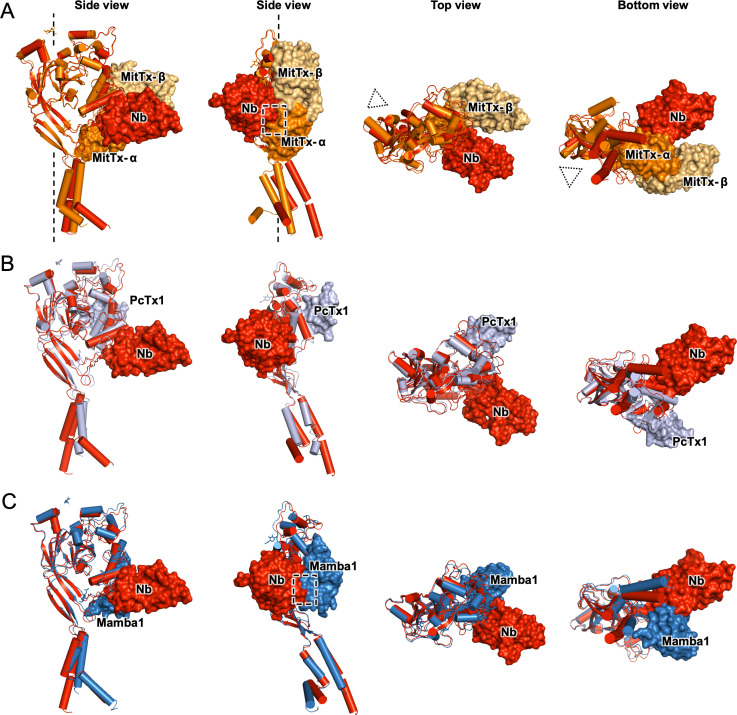
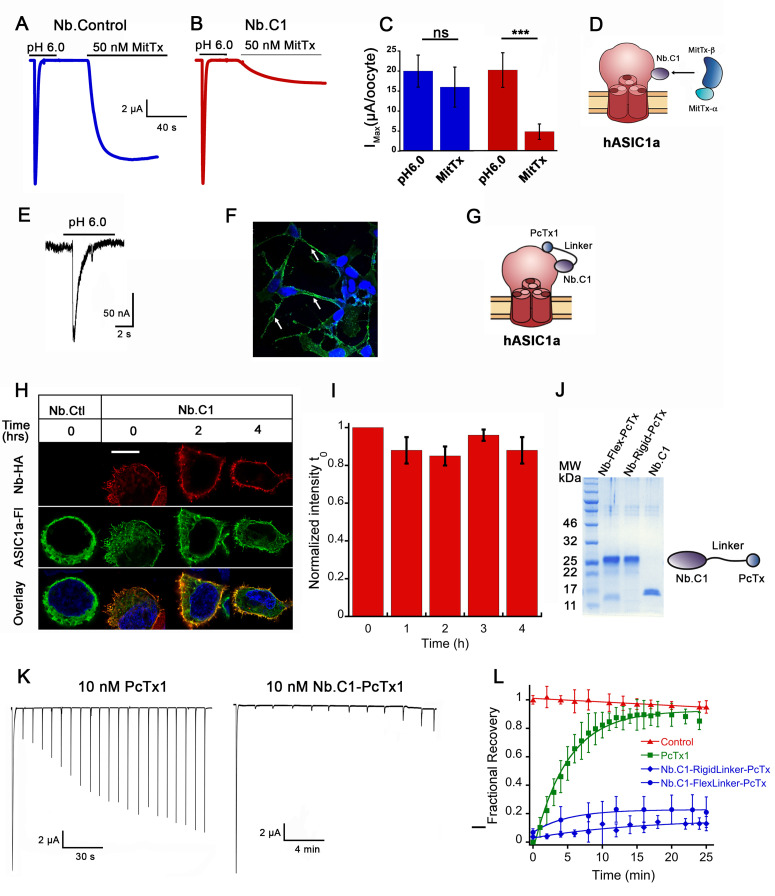
ASIC1a is a proton-gated sodium channel involved in modulation of pain, fear, addiction, and ischemia-induced neuronal injury. We report isolation and characterization of alpaca-derived nanobodies (Nbs) that specifically target human ASIC1a. Cryo-electron microscopy of the human ASIC1a channel at pH 7.4 in complex with one of these, Nb.C1, yielded a structure at 2.9 Å resolution. It is revealed that Nb.C1 binds to a site overlapping with that of the Texas coral snake toxin (MitTx1) and the black mamba venom Mambalgin-1; however, the Nb.C1-binding site does not overlap with that of the inhibitory tarantula toxin psalmotoxin-1 (PcTx1). Fusion of Nb.C1 with PcTx1 in a single polypeptide markedly enhances the potency of PcTx1, whereas competition of Nb.C1 and MitTx1 for binding reduces channel activation by the toxin. Thus, Nb.C1 is a molecular tool for biochemical and structural studies of hASIC1a; a potential antidote to the pain-inducing component of coral snake bite; and a candidate to potentiate PcTx1-mediated inhibition of hASIC1a in vivo for therapeutic applications.

Keywords: ASIC1; MitTx antagonism; Pctx1 potentiation; cryo-electron microscopy; molecular biophysics; nanobody; structural biology.


Conflict of interest statement

YW, ZC, FS, CC No competing interests declared

Figures

Figure 1.
Figure 1.. Generation of nanobodies (Nbs) specific to hASIC1a.
(A) Fractionation of IgG (immunoglobulin G) classes from serum after completion of immunization schedule of alpaca. (B) Each fraction was tested for antibodies against hASIC1a by ELISA. All three immunoglobulin fractions, including single-domain antibodies Ig2 and IgG3 shown in red columns, are significantly higher than the pre-immune serum, t-test p-value < 0.001. (C) Overall method for generation of a phage display library, panning strategy for selection of highly reactive phages, and final purification of Nbs. (D) Example of ELISA results from 24 out of 600 selected clones. Only clones with signal above the red-dashed line were selected for further characterization. (E) The DNA of those clones was sequenced and analyzed by similarity. A phylogenetic tree made with those clones shows that they distribute into three groups. Thick lines mark the branch encoding Nbs with high reactivity and specificity. Nb C1 was chosen for further studies.
Figure 1—figure supplement 1.
Figure 1—figure supplement 1.. Construction of phage library.
(A) Schedule of immunization of an alpaca against intact cells expressing hASIC1a. Arrows indicate the weeks of injection and serum collection. PBL=peripheral blood lymphocytes collected from 100 mL blood. (B) Schematic representation of alpaca IgG structure with relevant domains indicated. The three complementary-determining regions (CDR1-2-3) that encode hypervariable segments and constitute epitope binding sites of the single-domain IgG (immunoglobulin G) molecule are indicated in yellow, green, and teal, respectively. Arrows mark the position of primers used for first amplification using primers LP-LEADER-F and GSP-RT-R, which amplify all three IgG types. Template for this amplification was single-stranded DNA made from total RNA of lymphocytes primed with oligo-dT. The second PCR amplification consisted of two reactions conducted with primers SflI-AM-AlpVh-F and SflI-AlpVHH-R1 or SflI-AlpVHH-R2. The template for this reaction was the lower band of the first PCR. These reactions selectively amplify the variable domains of IgG2 and IgG3. (C) Agarose gels of total RNA extracted from lymphocytes, DNA products of the first PCR, and DNA products of the second PCR reactions. The bands were extracted from the gel and ligated to pADL-22c phagemid vector to make the library. (D) Efficiency of the ligation of the PCR fragment of the second amplification ligated to pADL-22c was assessed by PCR of 18 randomly selected bacterial colonies with vector-specific primers. All colonies had an insert of the correct size. (E) Western blot of periplasmic extracts from clones positive in ELISA were used to verify the expression of nanobodies. Signals were obtained with HA monoclonal and anti-mouse secondary antibodies conjugated with HRP. LP-LEADER-F: 5-CGCCATCAATRTACCAGTTGA GSP-RT-R: 5-GTGGTCCTGGCTGCTCTW SflI-MA-AlpVh-F: 5-cGGCCCAGCCGGCCATGGCCcAGKTGCAGCTCGTGGAGTCNGGNGG SflI-AlpVHH-R1: 5-cGGCCTCCCGGGCCGGGGTCTTCGCTGTGGTGCG SflI-AlpVHH-R2: 5-cGGCCTCCCGGGCCTTGTGGTTTTGGTGTCTTGGG.
Figure 1—figure supplement 2.
Figure 1—figure supplement 2.. Amino acid sequence of highly reactive nanobodies to hASIC1a.
The alignment shows amino acid sequences of the group of nanobodies in the phylogeny tree highlighted by thick lines in Figure 1E. CDR1, CDR2, and CDR3 are colored in yellow, green, and teal, respectively, as in Figure 1—figure supplement 1. Names of the nanobodies are on the right and colored accordingly to the phylogenetic tree. The top sequence corresponds to Nb.C1.
Figure 2.
Figure 2.. Structural determination of human ASIC1a in complex with Nb.C1.
(A) Size exclusion chromatography (SEC) purification of the hASIC1a-Nb.C1 complex elutes as a single monodispersed peak. (B) Coomassie blue-stained SDS-PAGE shows two bands corresponding to the molecular weights of hASIC1a and Nb.C1, indicating stable association of the complex that persists after SEC. (C) Representative 2D classes of hASIC1a-Nb.C1 complex particles show distribution in various orientations. The extracellular domain (ECD) and transmembrane domain (TMD) can be readily distinguished as well as Nb.C1 attached to the ECD. (D) Representative view of the 3D density map shows the Nb.C1 in complex with hASIC1a. The three hASIC1a subunits are shown in green, red, and blue; Nb.C1s are shown in dark gray. Lipids are seen attached to the TMD (light gray).
Figure 2—figure supplement 1.
Figure 2—figure supplement 1.. Representative examples of size exclusion chromatography (SEC) profiles of hASIC1a purified in 1% dodecylmaltoside (DDM) or 1% Fos-choline14 in the absence of nanobody.
Shown also is a western blot of proteins contained in the SEC peaks from the sample in 1% DDM. The band at the top of the gel represents aggregated protein. Several differences in production and purification of hASIC1a protein could account for the difference in outcome compared to the well-behaved protein of Sun et al., 2020. (i) Our construct was hASIC1a with a 50 a.a. carboxyl terminal deletion rather than a 60 amino acid deletion. (ii) We used HEK293F cells transfected with pCDNA3.1 plasmid rather than baculovirus-infected sf9 cells. (iii) For affinity purification we used a Strep-tag at the N-terminus of ASIC1a and Strep Tactin XT resin, whereas Sun et al. used an 8-His tag and nickel resin for purification.
Figure 2—figure supplement 2.
Figure 2—figure supplement 2.. Cryo-electron microscopy (cryo-EM) data processing pipeline for hASIC1a-Nb complex at pH 7.4.
Particles from two Titan Krios datasets were separately picked; bad particles were removed by rounds of 2D classification. Particle images were combined for the subsequent rounds of 3D classification, 3D refinement and Bayesian polishing. Except for the automatic particle picking, all steps were carried out in Relion 3.1.
Figure 3.
Figure 3.. Cryo-electron microscopy (cryo-EM) structure of hASIC1a-Nb.C1 complex in the closed conformation.
(A) Overall structure of hASIC1a-Nb complex in side and top views. Trimeric hASIC1a subunits are shown in red, green, and blue. Nanobodies Nb.C1 attached to the thumb domain of each hASIC1a subunit are shown in dark gray. General location of the overlapping binding sites of MitTx and Mambalgin-1 is indicated by the dashed rectangle (1) while the binding site of PcTx-1 is indicated by dashed rectangle (2). (B) Superposition of hASIC1a secondary structure (red) with cASIC1 (6vtl) (light blue) shows substantial differences only in the extended loop of thumb domain. (C) Detailed interactions between hASIC1a and Nb.C1 are Asp296-Tyr108 (lower left panel), Asp298-Arg35 and Arg105 (lower middle panel), Arg317-Phe58 (lower right panel). Map densities shown as a mesh. The negatively charged residues are in red, positively charged residues in blue, and aromatic residues are in green.
Figure 3—figure supplement 1.
Figure 3—figure supplement 1.. Cryo-electron microscopy (cryo-EM) imaging of hASIC1a-Nb complex at pH 7.4 and 4 mM Ca2+.
(A) Representative micrograph. Image size: 478×340 nm2. (B) Gold standard FSC resolution estimation. (C) Local resolution estimation, with colorbar labeled in angstroms. (D) Surface electrostatic view of the hASIC1a-Nb complex. Positively and negatively charged areas are shown in blue and red, respectively. (E) View of hydrophobicity of hASIC1-Nb.C1 complex. Hydrophobic and hydrophilic areas are shown in cantaloupe and teal. (F) Representative density of the CDR1, CDR2, and CDR3 regions of Nb.C1. (G) Representative densities of secondary structures in hASIC1a.
Figure 3—figure supplement 2.
Figure 3—figure supplement 2.. Intracellular densities in the hASIC1a-Nb electron microscopy (EM) map.
(A) Side view of the transmembrane domain shows weak intracellular density (yellow) that occupies the lower part of the pore. (B) Top-down view of hASIC1a channel pore shows the intracellular density forming a lower pore constriction in the permeation pathway. (C) Densities of the two helixes Re-1/2 in the reentrant loop of cASIC1 are seen in the hASIC1a-Nb EM map filtered to 7 Å resolution. The cASIC1 model (6vtl, light blue) is shown fitted into the map.
Figure 3—figure supplement 3.
Figure 3—figure supplement 3.. Immunoreactivity of HA-tagged Nb.C1 with various species and isoforms of ASIC.
Confocal images of cells transfected with human ASIC1a-Flag (hASIC1a) and six mutants or isoforms: the same construct with deletion of D298 and L299 (hASIC1a-DL); chicken ASIC1-Flag (cASIC1); the same construct with insertion of DL (cASIC1+DL); mouse ASIC1a-Flag (mASIC1a); mouse ASIC2a-Flag (mASIC2a); and mouse ASIC3-Flag (mASIC3). In each case, cells were first incubated with Nb.C1 for 1 hr followed by washes to remove the Nb. A second incubation was conducted with anti-Flag mouse monoclonal together with anti-HA rabbit monoclonal for 1 hr. After extensive washes, anti-mouse IgG Alexa Fluor 488 and anti-rabbit IgG Alexa Fluor 594 were incubated for 1 hr. Nuclei are shown in blue (DAPI staining). Top left panel shows strong signal of Nb.C1 colocalized with hASIC1a wild type; all other ASIC constructs do not react with Nb.C1.
Figure 3—figure supplement 4.
Figure 3—figure supplement 4.. Structural comparison of hASIC1-Nb.C1 complex with hASIC1 at high pH.
(A) Superposition of hASIC1a-Nb.C1 complex (red, Nb not shown) with hASIC1a (7CFS, Sun et al., 2020) (cyan) shows the overall similar structures between two human ASIC1a models. The RMSD value between the two models is 1.29 Å. (B) Upper panel: the extended loop of hASIC1-Nb model is well resolved compared to 7CFS. Lower panel: there is a slight displacement of α5-β10 linker with flipped side chain of Tyr360.
Figure 3—figure supplement 5.
Figure 3—figure supplement 5.. Functional characterization of hASIC1a-Nb.C1 and channels with or without DL residues.
(A) Representative traces of hASIC1a recorded with control (anti-GFP) Nb or Nb.C1 by TEVC of oocytes pre-incubated with 10 nM of the respective nanobodies (Nbs) for 15 min at room temperature. Measurements of pH50a were conducted by perfusing a solution of pH 7.4 for 30 s followed by activating pH of values indicated above the current traces. Measurements of steady-state desensitization midpoint pH50ssd were conducted by perfusing solutions indicated above traces for 30 s and activated with pH 6.0. (B) Table is a summary of results collected from experiments as in (A). The following parameters are listed: Peak current Imax elicited by pH 6.0 estimates the average magnitude of proton-induced current; activation pH50A value and Hill coefficient nA; steady-state desensitization pH50ssd and Hill coefficient nssd; rate of desensitization from the open state measured after activation with pH 6.0. Total number of oocytes=N. Values are the mean ± SD. To allow comparison, all recordings were made on the same day from the same batch of oocytes. (C) Representative recordings from hASIC1a wild type and hASIC1a-DL, and cASIC1 wild type and cASIC1+DL. Peak currents were elicited by pH 6.0 in response to progressively lower preconditioning pH applied for 30 s. (D) Proton concentration response curves of the four indicated channels. Curves are fits of the Hill equation. Values of pH50ssd: hASIC1a wild type=7.11±0.02, hASIC1a-DL=7.18±0.02, t-test p=0.008; cASIC1 wild type=7.45±0.01, cASIC1+DL=7.38±0.01, t-test p=0.005. Each data point represents the mean± SD of four experiments conducted with different batches of oocytes; each experiment accounts for five to seven independent cell measurements (total number of cells 24–32 for each data point). In all experiments, wild type and mutant were measured the same day with the same solutions. The arrows indicate the direction of pH shift induced by the DL insertion. Raw data are provided as Excel files in Source data 3.
Figure 4.
Figure 4.. Structural comparison of hASIC1a-Nb.C1 complex to toxin-bound ASICs.
Two side, top and bottom views of superimposed structures of hASIC1a-NbC1 complex (red) with (A) MitTx-bound to chicken ASIC1 (4ntw) in open conformation (orange). In side views, the threefold axis of the channel is indicated by a dashed vertical line; in top and bottom views it is indicated by dotted triangles. (B) PcTx1-bound chicken ASIC1 (3s3x) (gray). (C) Mambalgin-1-bound human ASIC1 (7ctf) (blue). Only one subunit is shown for simplicity. Surface clashes are indicated by dashed rectangles. Nb.C1, MitTx- α, MitTx- β, PcTx1, Mambalgin-1 are shown as red, orange, light-orange, light-purple, marine respectively.
Figure 5.
Figure 5.. Effects of Nb.C1 on MitTx and PcTx1 binding to hASIC1a.
(A) Representative currents of an oocyte expressing hASIC1a activated with pH 6.0 followed by a second activation with 50 nM MitTx at pH 7.4. (B) Same experiment after pre-incubation of the oocyte with 50 nM Nb.C1 for 15 min. (C) Summary of the peak currents from pH 6.0 and MitTx activations. In this and all traces, the conditioning pH is 7.4. The bars represent the mean±SD of currents, n=8 Nb control and n=6 Nb.C1. Asterisks indicate statistical significance in t-test, p<0.001. (D) Cartoon of the proposed mechanism of how Nb.C1 associated with hASIC1a may interfere with MitTx binding. (E) Whole-cell patch clamp of SH-SY5Y cells activated with pH 6.0 generates typical hASIC1a currents. Proton-induced currents are inhibited by PcTx and amiloride. (F) Immunofluorescence confocal image of SH-SY5Y cells incubated with Nb.C1-PcTx1-HA fusion and anti-HA antibody (green) shows cells decorated on the periphery. Nuclei were stained with DAPI (blue). Scale bar, 5 µm. (G) Cartoon representation showing the Nb.C1-PcTx1 polypeptide binding to two distinct sites on the surface of hASIC1a, accounting for a possible mechanism of toxin potentiation. (H) Confocal images of live HEK-293 cells transfected with hASCIC1a-Flag on coverslips incubated with Nb.C1-HA for 30 min and followed for 0, 1, 2, 3, and 4 hr at 18°C in DMEM containing HEPES. Three of the five time points are shown. At each 1 hr interval, all cells were washed except for the one dish of cells removed for fixation. All cells were processed for immunofluorescence with HA and Flag monoclonals to visualize Nb.C1-HA and hASIC1a-Flag, respectively. Nb.C1-HA labels only the cell surface whereas hASIC1a distributes in the plasma membrane and intracellular endoplasmic reticulum and perinuclear membrane. Scale bar, 5 µm. (I) Quantification of fluorescence intensity of Nb.C1 (red channel) normalized to time 0 hr (t0). For each time point 300 cells were analyzed. Columns are the mean ± SEM. (J) Coomassie blue SDS-PAGE of purified fusion proteins (Nb.C1-FlexLinker-PcTx and Nb.C1-RigidLinker-PcTx) and Nb.C1 alone. On the right a cartoon representation of the fusion proteins. (K) Representative examples of oocytes expressing hASIC1a exposed to 10 nM of PcTx1 or 10 mM of Nb.C1-Rigid-PcTx1 fusion for 60 s prior to serial activations with a change of pH from 7.35 to 6.0. Cells remained in the perfusion chamber throughout the experiment. (L) Time course of recovery of acid-induced currents in control (no pretreatment), and pretreatment with PcTx1, Nb.C1-Flex-PcTx, or Nb.C1-Rigid-PcTx1. Preconditioning pH 7.35, activation pH 6.0. Data were fit with a single exponential a(1et/τ) where τ is 220 s for PcTx, 350 and 880 s for Nb.C1-Flex-PcTx and Nb.C1-Rigid-PcTx; a = 0.90 for PcTx, and 0.16 and 0.14 for the fusions, respectively. Data points represent the mean ± SD of 7–12 cells. Values of currents from each cell are shown in Source data 3.

Similar articles

Cited by

References

    1. Alijevic O, Kellenberger S. Subtype-specific modulation of Acid-sensing ion channel (ASIC) Function by 2-Guanidine-4-methylquinazoline. Journal of Biological Chemistry. 2012;287:36059–36070. doi: 10.1074/jbc.M112.360487. - DOI - PMC - PubMed
    1. Baconguis I, Bohlen CJ, Goehring A, Julius D, Gouaux E. X-ray structure of acid-sensing ion channel 1-snake toxin complex reveals open state of a na(+)-selective channel. Cell. 2014;156:717–729. doi: 10.1016/j.cell.2014.01.011. - DOI - PMC - PubMed
    1. Baconguis I, Gouaux E. Structural plasticity and dynamic selectivity of acid-sensing ion channel–spider toxin complexes. Nature. 2012;489:400–405. doi: 10.1038/nature11375. - DOI - PMC - PubMed
    1. Bohlen CJ, Chesler AT, Sharif-Naeini R, Medzihradszky KF, Zhou S, King D, Sánchez EE, Burlingame AL, Basbaum AI, Julius D. A heteromeric Texas coral snake toxin targets acid-sensing ion channels to produce pain. Nature. 2011;479:410–414. doi: 10.1038/nature10607. - DOI - PMC - PubMed
    1. Chassagnon IR, McCarthy CA, Chin YK-Y, Pineda SS, Keramidas A, Mobli M, Pham V, De Silva TM, Lynch JW, Widdop RE, Rash LD, King GF. Potent neuroprotection after stroke afforded by a double-knot spider-venom peptide that inhibits acid-sensing ion channel 1a. PNAS. 2017;114:3750–3755. doi: 10.1073/pnas.1614728114. - DOI - PMC - PubMed

Publication types

MeSH terms

Substances