

Analytical and Clinical Performance of Droplet Digital PCR in the Detection and Quantification of SARS-CoV-2
- PMID: 34319580
- PMCID: PMC8316104
- DOI: 10.1007/s40291-021-00547-1
Analytical and Clinical Performance of Droplet Digital PCR in the Detection and Quantification of SARS-CoV-2
Erratum in
-
Correction to: Analytical and Clinical Performance of Droplet Digital PCR in the Detection and Quantification of SARS-CoV-2.Mol Diagn Ther. 2021 Nov;25(6):811. doi: 10.1007/s40291-021-00557-z. Epub 2021 Sep 18. Mol Diagn Ther. 2021. PMID: 34536201 Free PMC article. No abstract available.
Abstract
Background and objective: Since the initial coronavirus disease outbreak in late 2019 (COVID-19), reverse-transcription real-time polymerase chain reaction (RT-qPCR) has become the gold standard test to detect severe acute respiratory syndrome-related coronavirus 2 (SARS-CoV-2). However, a more sensitive and accurate diagnostic tool was required. Therefore, droplet digital polymerase chain reaction (ddPCR) was suggested as an alternative method. Here, we evaluated the performance of ddPCR to detect SARS-CoV-2 and compared it to the performance of RT-qPCR.
Methods: The analytical performances, including limit of blank and limit of detection, were established using positive and negative SARS-CoV-2 reference materials. A total of 366 RNA extracts (173 positive and 193 negative by RT-qPCR) were collected from four institutions and tested with a Bio-Rad SARS-CoV-2 ddPCR kit that detects the SARS-CoV-2 genome using primers for N1 and N2.
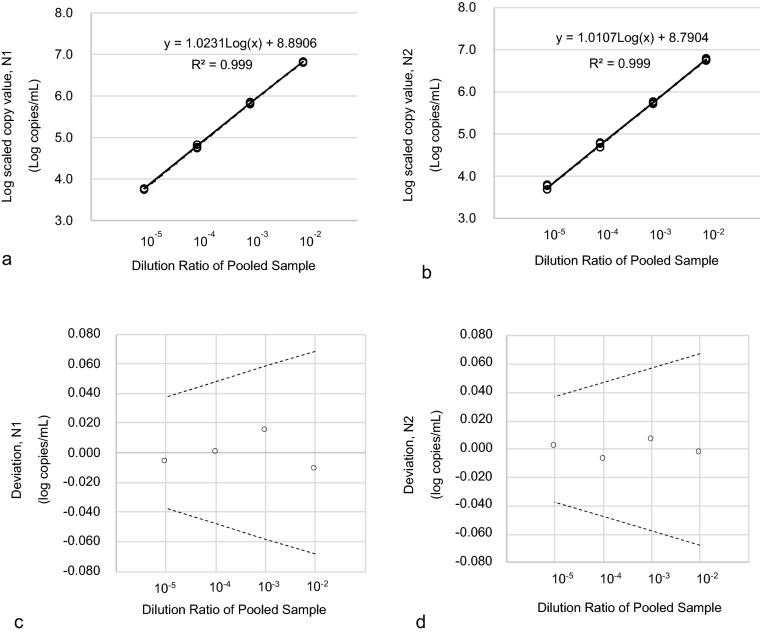
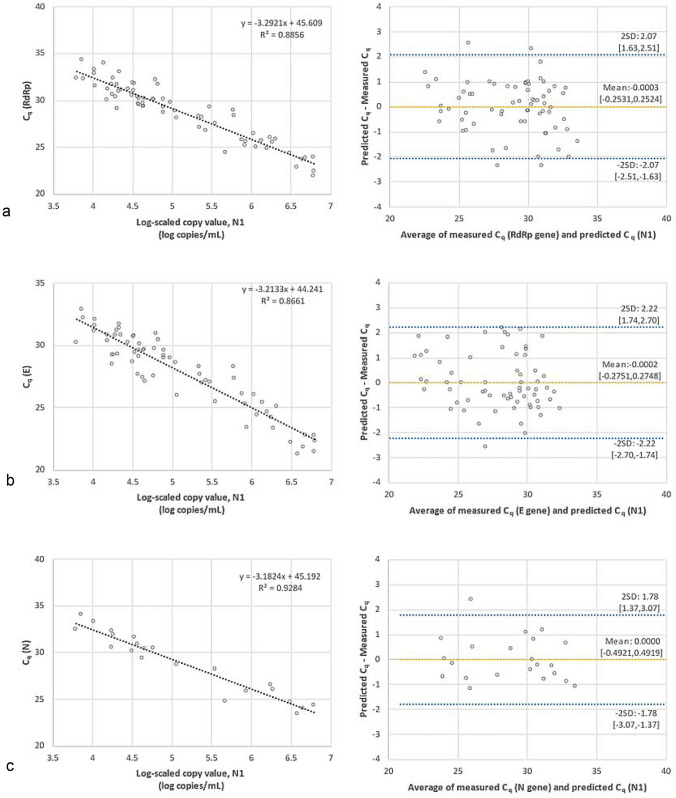
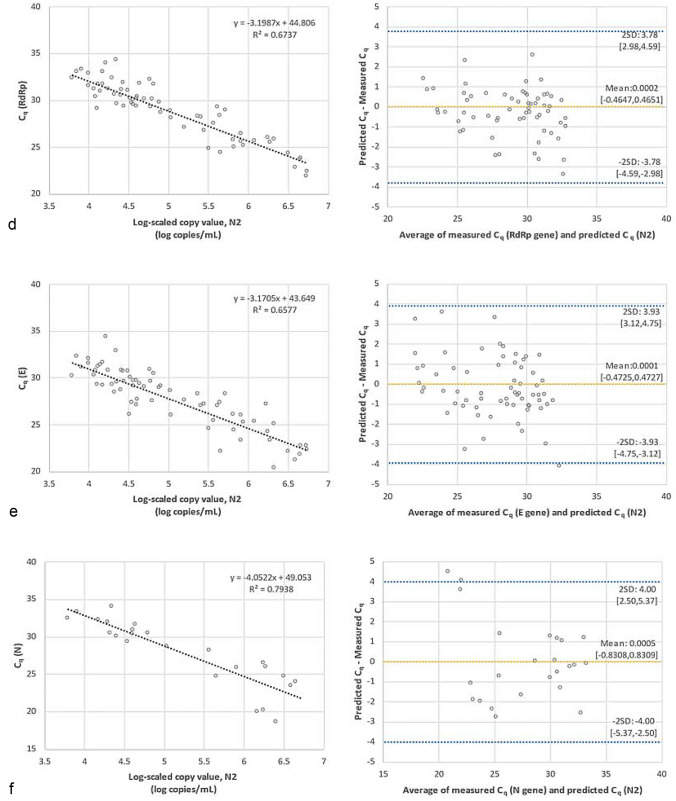
Results: Limit of blank was set at 0, and the limits of detection of N1 and N2 were 1.99 copies/μL and 5.18 copies/μL, respectively. Linearity was evaluated using serial dilution samples, which demonstrated good results (R2: 0.999, linear range: 5.88-6825.25 copies/μL for N1 and R2: 0.999, 5.53-5855.47 copies/μL for N2). The results of ddPCR and RT-qPCR revealed substantial agreement (Cohen's kappa: 0.639, p < 0.01). The 63 samples with positive ddPCR but negative RT-qPCR showed low copy numbers, and 55% of them had COVID-19-related symptoms.
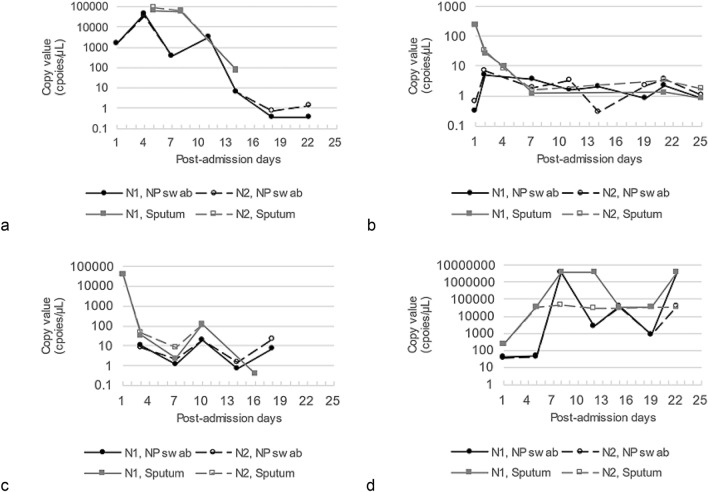
Conclusions: Droplet digital polymerase chain reaction demonstrated excellent sensitivity for SARS-Cov-2 detection and consistently agreed with the results from conventional RT-qPCR. Furthermore, ddPCR provided quantitative data that can be used to monitor changes in the viral load of patients with COVID-19.
© 2021. The Author(s), under exclusive licence to Springer Nature Switzerland AG.
Conflict of interest statement
Kyoung Bo Kim, Hayoung Choi, Gun Dong Lee, Jaewoong Lee, Seungok Lee, Yonggoo Kim, Sung-Yeon Cho, Dong-Gun Lee, and Myungshin Kim have no conflicts of interest that are directly relevant to the content of this article.
Figures
Similar articles
-
Surfaces environmental monitoring of SARS-CoV-2: Loop mediated isothermal amplification (LAMP) and droplet digital PCR (ddPCR) in comparison with standard Reverse-Transcription quantitative polymerase chain reaction (RT-qPCR) techniques.PLoS One. 2025 Feb 3;20(2):e0317228. doi: 10.1371/journal.pone.0317228. eCollection 2025. PLoS One. 2025. PMID: 39899502 Free PMC article.
-
Comparison of Different Reverse Transcriptase-Polymerase Chain Reaction-Based Methods for Wastewater Surveillance of SARS-CoV-2: Exploratory Study.JMIR Public Health Surveill. 2024 Aug 19;10:e53175. doi: 10.2196/53175. JMIR Public Health Surveill. 2024. PMID: 39158943 Free PMC article.
-
SARS-CoV-2 RNA Quantification Using Droplet Digital RT-PCR.J Mol Diagn. 2021 Aug;23(8):907-919. doi: 10.1016/j.jmoldx.2021.04.014. Epub 2021 May 29. J Mol Diagn. 2021. PMID: 34062285 Free PMC article.
-
Digital PCR Applications in the SARS-CoV-2/COVID-19 Era: a Roadmap for Future Outbreaks.Clin Microbiol Rev. 2022 Sep 21;35(3):e0016821. doi: 10.1128/cmr.00168-21. Epub 2022 Mar 8. Clin Microbiol Rev. 2022. PMID: 35258315 Free PMC article. Review.
-
Progress of the Detection Methods for SARS-CoV-2.Clin Lab. 2024 Aug 1;70(8). doi: 10.7754/Clin.Lab.2024.231148. Clin Lab. 2024. PMID: 39193975 Review.
Cited by
-
Digital PCR in Virology: Current Applications and Future Perspectives.Mol Diagn Ther. 2025 Jan;29(1):43-54. doi: 10.1007/s40291-024-00751-9. Epub 2024 Nov 2. Mol Diagn Ther. 2025. PMID: 39487879 Review.
-
COVID-19 Diagnosis: Current and Future Techniques.Int J Biol Macromol. 2021 Dec 15;193(Pt B):1835-1844. doi: 10.1016/j.ijbiomac.2021.11.016. Epub 2021 Nov 12. Int J Biol Macromol. 2021. PMID: 34774862 Free PMC article. Review.
-
Optimization and application of digital droplet PCR for the detection of SARS-CoV-2 in saliva specimen using commercially available kit.Biol Methods Protoc. 2024 Sep 23;9(1):bpae068. doi: 10.1093/biomethods/bpae068. eCollection 2024. Biol Methods Protoc. 2024. PMID: 39355137 Free PMC article.
-
Diagnostic, Prognostic, and Therapeutic Value of Droplet Digital PCR (ddPCR) in COVID-19 Patients: A Systematic Review.J Clin Med. 2021 Dec 6;10(23):5712. doi: 10.3390/jcm10235712. J Clin Med. 2021. PMID: 34884414 Free PMC article. Review.
-
A rapid water bath PCR combined with lateral flow assay for the simultaneous detection of SARS-CoV-2 and influenza B virus.RSC Adv. 2022 Jan 25;12(6):3437-3444. doi: 10.1039/d1ra07756b. eCollection 2022 Jan 24. RSC Adv. 2022. PMID: 35425347 Free PMC article.
References
MeSH terms
Substances
LinkOut - more resources
Full Text Sources
Medical
Miscellaneous
