. 2021 Oct 1;32(20):ar12.
doi: 10.1091/mbc.E21-06-0303. Epub 2021 Jul 28.

Tracheal motile cilia in mice require CAMSAP3 for the formation of central microtubule pair and coordinated beating

Affiliations

Tracheal motile cilia in mice require CAMSAP3 for the formation of central microtubule pair and coordinated beating

Hiroko Saito et al. Mol Biol Cell. .

Abstract

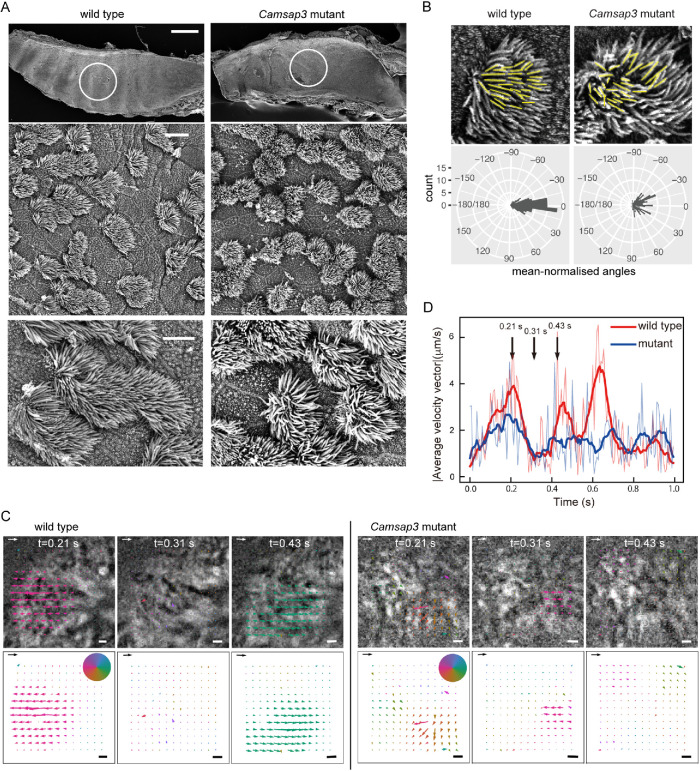
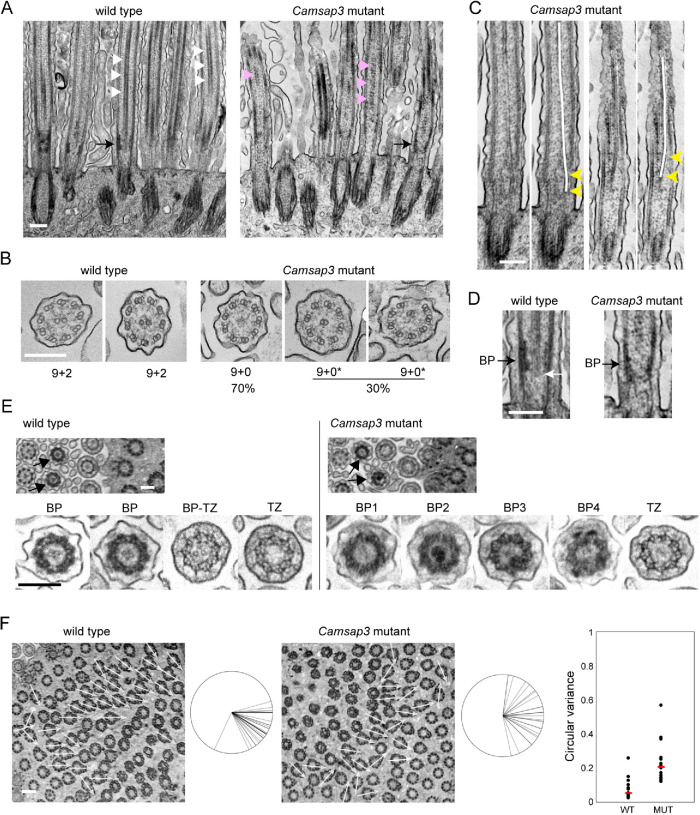
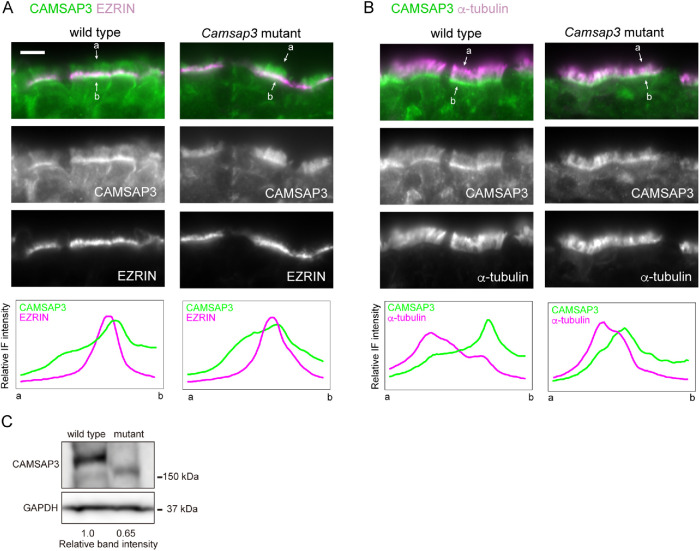
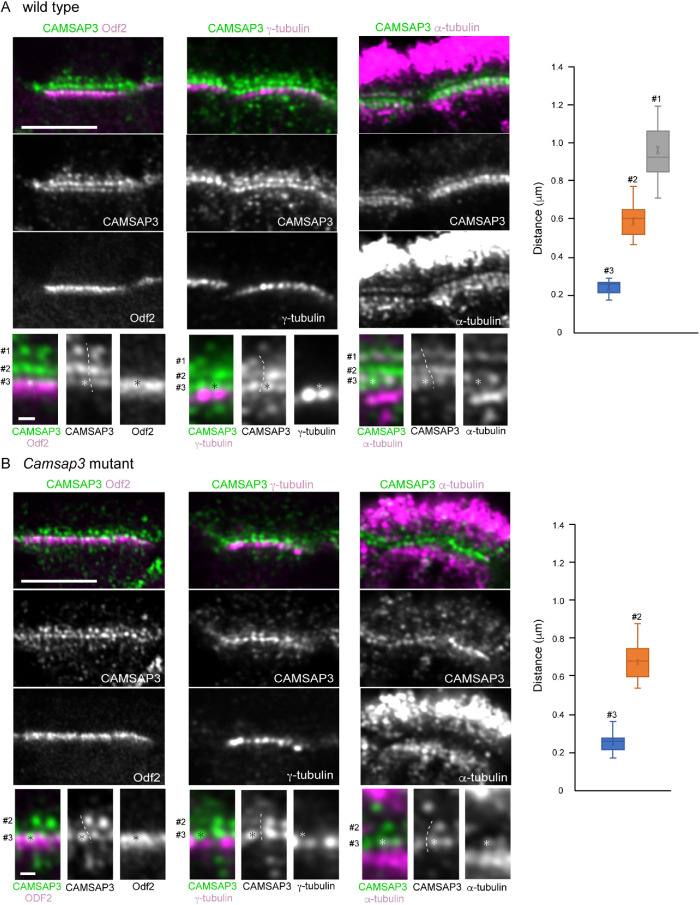
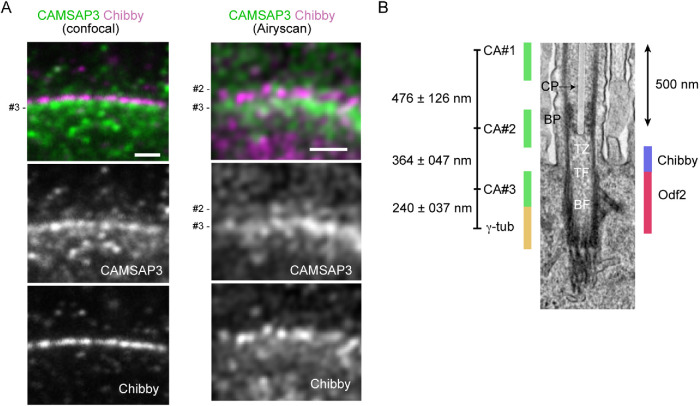
Motile cilia of multiciliated epithelial cells undergo synchronized beating to produce fluid flow along the luminal surface of various organs. Each motile cilium consists of an axoneme and a basal body (BB), which are linked by a "transition zone" (TZ). The axoneme exhibits a characteristic 9+2 microtubule arrangement important for ciliary motion, but how this microtubule system is generated is not yet fully understood. Here we show that calmodulin-regulated spectrin-associated protein 3 (CAMSAP3), a protein that can stabilize the minus-end of a microtubule, concentrates at multiple sites of the cilium-BB complex, including the upper region of the TZ or the axonemal basal plate (BP) where the central pair of microtubules (CP) initiates. CAMSAP3 dysfunction resulted in loss of the CP and partial distortion of the BP, as well as the failure of multicilia to undergo synchronized beating. These findings suggest that CAMSAP3 plays pivotal roles in the formation or stabilization of the CP by localizing at the basal region of the axoneme and thereby supports the coordinated motion of multicilia in airway epithelial cells.


Figures

FIGURE 1:
FIGURE 1:
Morphology and movement of motile cilia in airway epithelial cells. (A) Scanning electron microscopical observation of the luminal surface of the trachea. The trachea was isolated from P21 wild-type or Camsap3 mutant male mice. The top row shows a whole-mount trachea, in which the luminal surface is exposed. Part of the encircled region was enlarged in the middle and bottom rows. A representative image of three wild-type and five mutant samples is shown. The oral side is at the right. Scale bars: 500 μm, top; 10 μm, middle; and 5 μm, bottom. (B) Quantitative analysis of ciliary orientation. Cilia were traced with yellow lines for angle measurement, and polar plots for the distribution of ciliary angles were obtained. The ciliary angles were normalized by the average angle in each cell. Angles of 30 cilia in five cells were measured and aggregated for the polar plots (p < 2.2 × 10⁻¹⁶). (C) Quantitative analysis of the collective motion of multicilia, which has been recorded in Videos S1 and S2, for a wild-type and Camsap3-mutated cell, respectively. These videos were used for PIV analysis (see Videos S3 and S4). Three snapshots, chosen from each video, are overlaid with the flow vector field calculated by PIV analysis, and only the vectors, which represent the velocity vectors, are shown at the bottom row. The color of the vectors indicates the angle of the velocity vector, and the colormap is shown as a pie chart. The scale arrow and scale bar on each image are 20 μm/s and 1 μm, respectively. (D) Time-evolution of the magnitude of average velocity vector of ciliary motion plotted for wild-type (red curves) and mutant (blue curves) cells, respectively. The thin curves are the raw data, while the bold curves are the data smoothed by a moving average. The time points shown in B are indicated by black vertical arrows.
FIGURE 2:
FIGURE 2:
TEM analysis of cilia and basal bodies. (A) Longitudinal section of a multiciliated cell, which yields a longitudinal view of axonemes and basal bodies. White triangles indicate examples of the CP in a wild-type cell; magenta triangles point to intermittent structures at the central position of axoneme in a Camsap3-mutated cell. Black arrows point to the “basal plate” and a corresponding position in the Camsap3 mutant sample. A representative image of more than 50 sections is shown for each genotype. (B) Transverse section of cilia. In the mutant samples, 218 cilia from two independent sections were used for analysis. The mutant axonemes did not contain a CP; instead, some of them (marked as 9+0*) had a doublet microtubule that was mislocalized to central or semicentral positions. (C) Longitudinal section of cilia in Camsap3-mutated cells. A centrally located microtubule structure tilts toward the peripheral zone at basal portions of axoneme, as indicated by yellow arrowheads. Two examples are shown, each of which is duplicated to trace the central microtubule with a white line over the image. (D) Part of the image in A is enlarged. The white arrow points to the proximal end of the CP. BP, BP. (E) Slightly oblique, transverse sections of a multiciliated cell showing cross-sectional views of axoneme and BB at various longitudinal levels, in which arrows point to BPs that are characterized by a dense peripheral ring. Typical examples of ciliary sections at the level of BP and TZ are enlarged at the bottom. The image labeled BP-TZ likely represents a section at the boundary between BP and TZ. In the mutant sections, all of the BPs show some abnormality, including loss or overcondensation of the central structure, and partial deformation of the peripheral ring. Typical examples are shown. More than 20 sections, each of which contains more than 50 cilia, were examined for each genotype. (F) Slightly oblique, transverse section of a multiciliated cell, focusing on the basal foot of basal bodies. The direction of individual basal feet is shown with white arrows on the image, and these are aggregated at the right of each image. The range of orientation of basal feet on the cell varied from 26° to 108° in the wild type, with one exceptional case, and 13° to 172° in the mutant sample. We counted 33 and 26 basal bodies for the wild-type and mutant samples, respectively. The graph shows the variation in basal foot polarity in 13 wild-type or 14 mutant cells, which was quantified using circular variance (CV) that was defined previously (Shi et al., 2014), where cells with lower CV represent uniform BB orientation. Red bar, median. WT, wild type; MUT, Camsap3 mutant. Age of mice used, P126. Thickness of sections, 50 to 70 nm. Scale bars, 200 nm in A–E; 400 nm in F.
FIGURE 3:
FIGURE 3:
Immunostaining localization of CAMSAP3 in tracheal epithelium. (A, B) Trachea derived from P176 mice were fixed with 2% PFA and processed for coimmunostaining for CAMSAP3 and EZRIN (A) or α-tubulin (B). Images were recorded by conventional IF microscopy. IF signals were scanned along the line (not shown) drawn between the two arrows, across the cilia–BB complex from its apical (a) to basal (b) side. A typical image of three to five sections is shown for each set of immunostaining. Scale bars, 10 μm. (C) Western blots for CAMSAP3 in the trachea isolated from P172 wild-type or Camsap3dc/dc mice.
FIGURE 4:
FIGURE 4:
Airyscan microscopic analysis of CAMSAP3 distribution in wild-type and Camsap3-mutated multiciliated cells. Longitudinal section of multiciliated cells in wild-type (A) or Camsap3-mutated (B) trachea, which were coimmunostained for the molecules indicated and recorded by Airyscan microscopy. Part of each image was enlarged at the bottom, in which the numbers indicate three different sites of CAMSAP3 puncta. Asterisks mark an example of CAMSAP3 puncta (or their positions) at the #3 site in each image. Dotted lines indicate a putative boundary between the two or three sets of CAMSAP3 puncta aligned along the apicobasal axis. A typical image was selected from 8 to 10 sections of tissues, each of which contain several cells that can be analyzed, for each set of immunostaining. The samples were fixed with methanol. The graphs show the distance of CAMSAP3 puncta at different rows from γ-tubulin puncta. P91, P86,s and P176 mice were used for immunostaining for Odf2, γ-tubulin, and α-tubulin, respectively. Scale bars, 5 and 0.5 μm in the original and enlarged images, respectively.
FIGURE 5:
FIGURE 5:
CAMASP3 localization in the TZ. (A) Longitudinal section of a wild-type multiciliated cell, coimmunostained for CAMSAP3 and Chibby, and recorded by confocal or Airyscan microscopy. In these samples, the relative IF intensity of #3 CAMSAP3 puncta is high. Trachea were collected from P180 mice and fixed with methanol. Scale bar, 1 μm. (B) A putative map of CAMSAP3 puncta in relation to the ultrastructure of the axoneme, TZ, and BB. The relative position of each CAMSAP3 punctum was determined by measuring the distances between the puncta, and then the position of the entire CAMSAP3 puncta relative to the ultrastructure was adjusted by placing the #3 punctum at the level of the upper half of Odf2 distribution, as observed in Figure 4. The positions of Chibby, Odf2 and γ-tubulin were estimated referring to previous publications, although γ-tubulin localization needs further confirmation. The scale of the ultrastructure image is shown by a 500 nm bar. The CP is overlaid with a semitransparent white color. CP, the central pair of microtubules; BP, basal plate; TZ, transition zone; TF, transition fiber; BF, basal foot; γ-tub, γ-tubulin; CA, CAMSAP3.

Similar articles

Cited by

References

    1. Baines AJ, Bignone PA, King MD, Maggs AM, Bennett PM, Pinder JC, Phillips GW (2009). The CKK domain (DUF1781) binds microtubules and defines the CAMSAP/ssp4 family of animal proteins. Mol Biol Evol 26, 2005–2014. - PubMed
    1. Bautista-Harris G, Julia-Serda G, Rodriguez de Castro F, Santana-Benitez I, Cabrera-Navarro P (2000). Absence of central microtubules and transposition in the ciliary apparatus of three siblings. Respiration 67, 449–452. - PubMed
    1. Berryman M, Franck Z, Bretscher A (1993). Ezrin is concentrated in the apical microvilli of a wide variety of epithelial cells whereas moesin is found primarily in endothelial cells. J Cell Sci 105 (Pt 4), 1025–1043. - PubMed
    1. Brooks ER, Wallingford JB (2014). Multiciliated cells. Curr Biol 24, R973–R982. - PMC - PubMed
    1. Burgoyne T, Lewis A, Dewar A, Luther P, Hogg C, Shoemark A, Dixon M (2014). Characterizing the ultrastructure of primary ciliary dyskinesia transposition defect using electron tomography. Cytoskeleton (Hoboken) 71, 294–301. - PubMed

Publication types

Substances

LinkOut - more resources