. 2021 Sep 27;95(20):e0101021.
doi: 10.1128/JVI.01010-21. Epub 2021 Jul 28.

Kinetic Multi-omic Analysis of Responses to SARS-CoV-2 Infection in a Model of Severe COVID-19

Affiliations

Kinetic Multi-omic Analysis of Responses to SARS-CoV-2 Infection in a Model of Severe COVID-19

Angelene M Cantwell et al. J Virol. .

Abstract

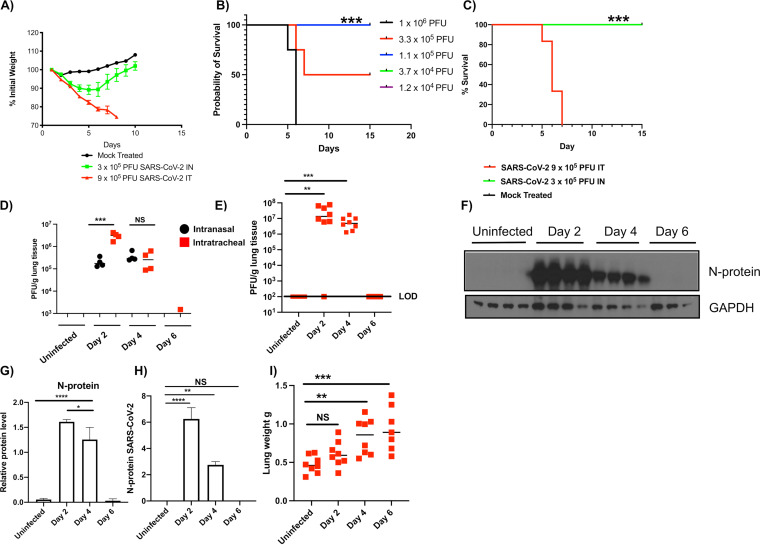
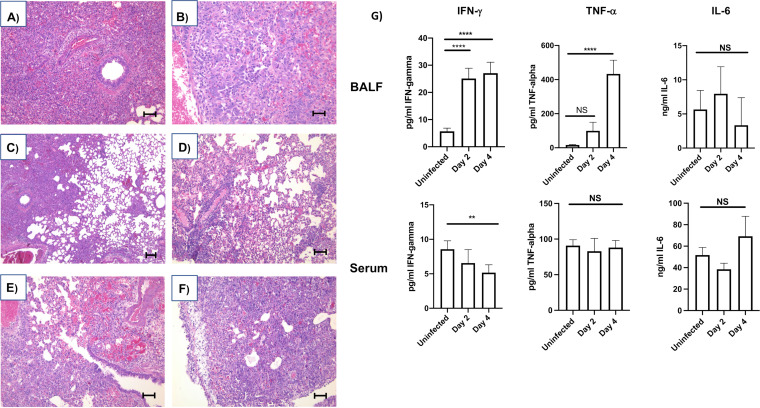
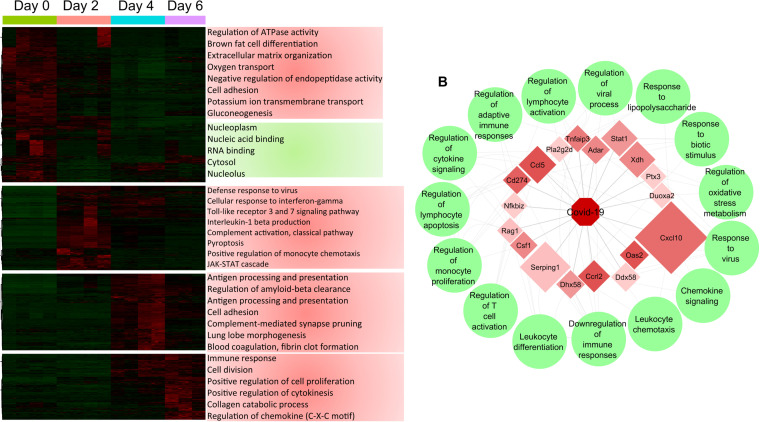
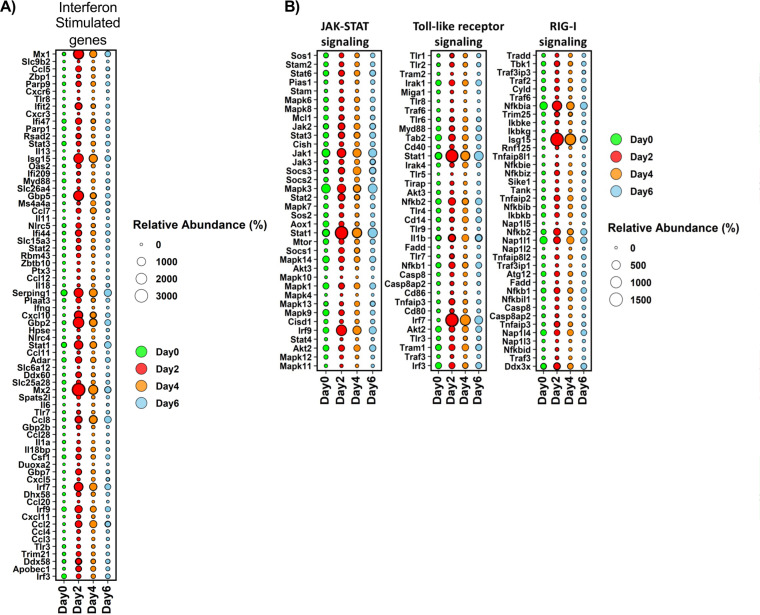
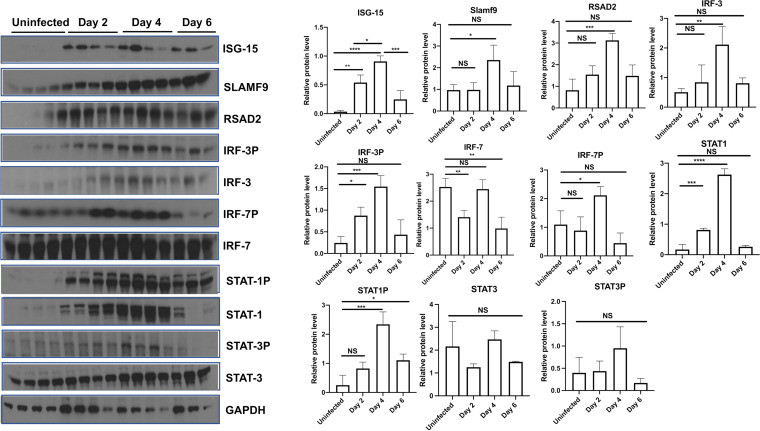
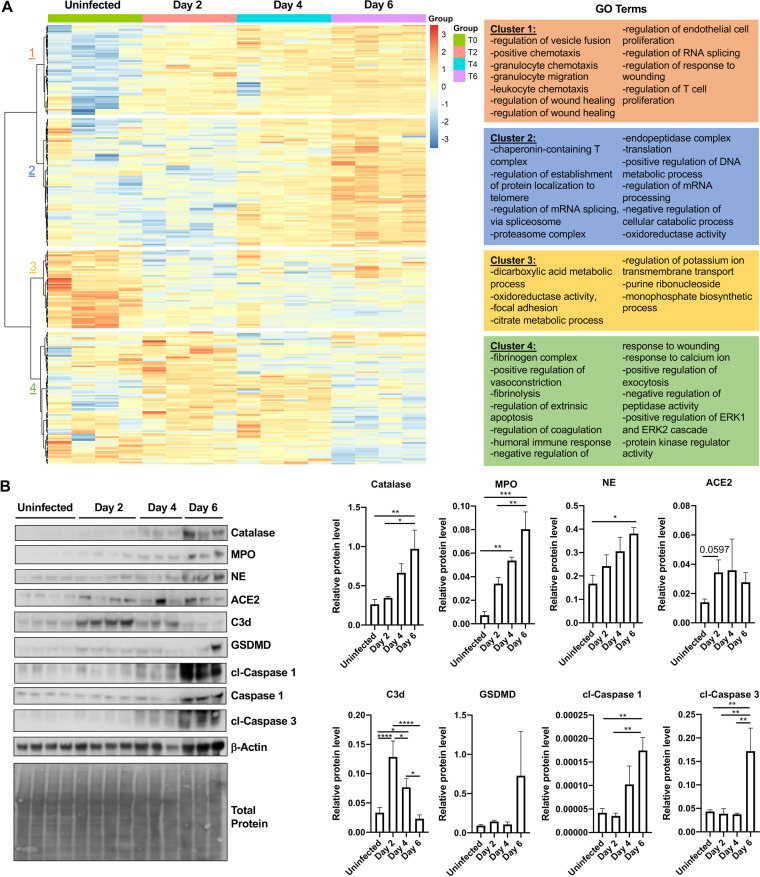
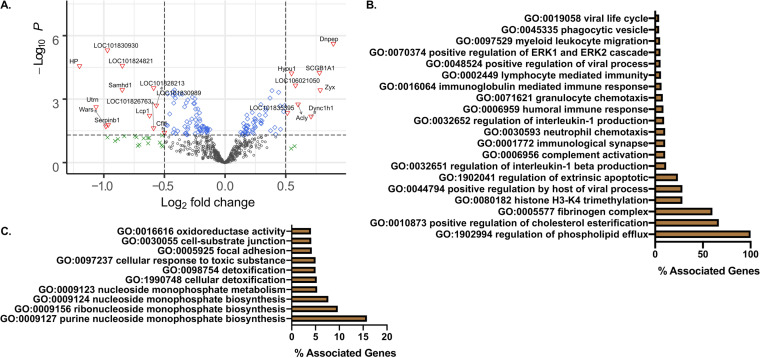
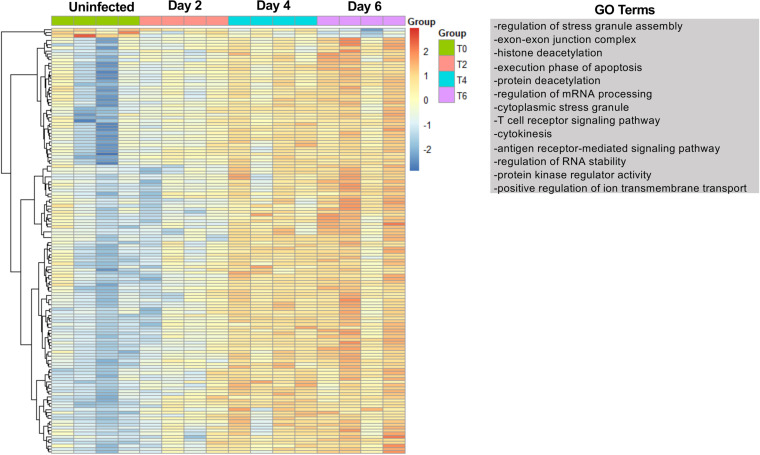
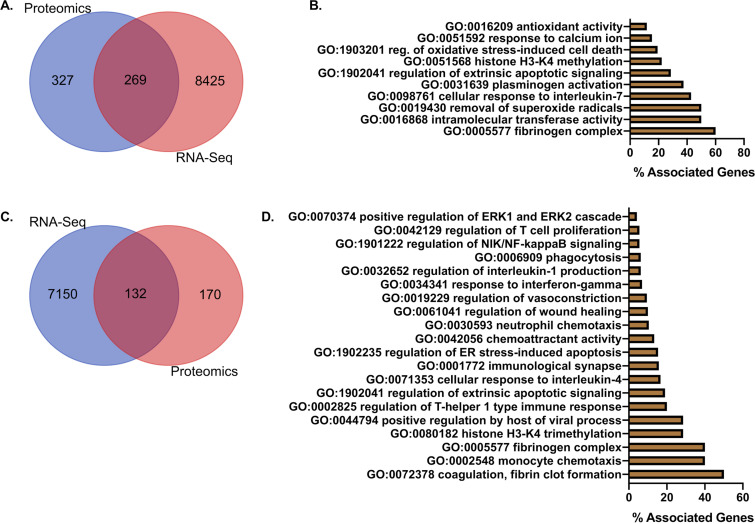
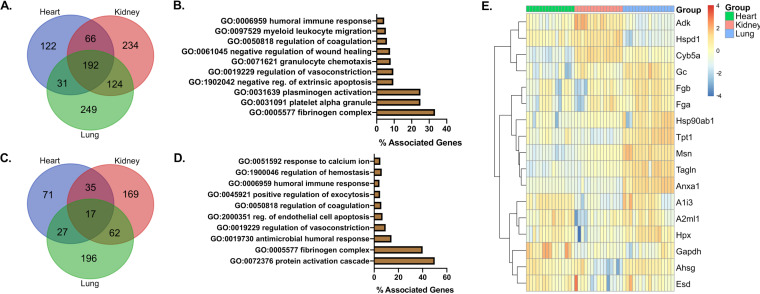
The host response to severe acute respiratory syndrome coronavirus 2 (SARS-CoV-2) is poorly understood due to a lack of an animal model that recapitulates severe human disease. Here, we report a Syrian hamster model that develops progressive lethal pulmonary disease that closely mimics severe coronavirus disease 2019 (COVID-19). We evaluated host responses using a multi-omic, multiorgan approach to define proteome, phosphoproteome, and transcriptome changes. These data revealed both type I and type II interferon-stimulated gene and protein expression along with a progressive increase in chemokines, monocytes, and neutrophil-associated molecules throughout the course of infection that peaked in the later time points correlating with a rapidly developing diffuse alveolar destruction and pneumonia that persisted in the absence of active viral infection. Extrapulmonary proteome and phosphoproteome remodeling was detected in the heart and kidneys following viral infection. Together, our results provide a kinetic overview of multiorgan host responses to severe SARS-CoV-2 infection in vivo. IMPORTANCE The current pandemic caused by severe acute respiratory syndrome coronavirus 2 (SARS-CoV-2) infection has created an urgent need to understand the pathogenesis of this infection. These efforts have been impaired by the lack of animal models that recapitulate severe coronavirus disease 2019 (COVID-19). Here, we report a hamster model that develops severe COVID-19-like disease following infection with human isolates of SARS-CoV-2. To better understand pathogenesis, we evaluated changes in gene transcription and protein expression over the course of infection to provide an integrated multiorgan kinetic analysis of the host response to infection. These data reveal a dynamic innate immune response to infection and corresponding immune pathologies consistent with severe human disease. Altogether, this model will be useful for understanding the pathogenesis of severe COVID-19 and for testing interventions.

Keywords: COVID-19; RNA-seq; SARS-CoV-2; hamster; phosphoproteomics; proteomics.


Figures

FIG 1
FIG 1
Intratracheal SARS-CoV-2 infection in golden Syrian hamsters leads to severe pulmonary inflammation that mimics human responses. Male 5- to 6-week-old golden Syrian hamsters were intranasally or intratracheally infected with SARS-CoV-2 isolate USA-WA-1/2020 or mock challenged with vehicle (DMEM), and lungs were excised at days 2, 4, and 6 postinfection. (A) Percent weight change. (B) LD50 analysis (note green, purple, and blue lines denoting 100% survival are superimposed). (C) Survival. (D) Lung viral burden measured via plaque assays following infection with 3 × 105 PFU; black symbols, intranasal; red symbols, intratracheal. (E) Lung viral burden measured via plaque assays following i.t. infection with 9 × 105 PFU (LOD, level of detection). (F) SARS-CoV-2 nucleoprotein immunoblots. (G) Relative quantitation of results in F. (H) Mass spectrometry analysis targeting SARS-CoV-2 nucleoprotein. (I) Wet lung weight; NS, not significant. (B, C) ***, P = 0.0005; log-rank analysis. (D to I) *, P = 0.05; **, P = 0.005; ***, P = 0.0005; ****, P = 0.00005; analysis of variance (ANOVA) with multiple comparisons posttest. n = 8 to 10 (A, C), 3 to 4 (B, D to G), and 7 to 8 (I).
FIG 2
FIG 2
Inflammation of the SARS-CoV-2-infected hamster lung. Male 5- to 6-week-old golden Syrian hamsters were intratracheally infected with SARS-CoV-2 isolate USA-WA-1/2020 or mock challenged with vehicle (PBS), and lungs were excised at days 2, 4, and 6 postinfection. (A and B) Hematoxylin and eosin staining of lung sections on days 2 and 6 postinfection, respectively (A, 100×, scale bar is 100 mm; B, 200×, scale bar is 50 mm). (C) Histology with low magnification shows the mixture of dilated air space in alveoli (right side) and solid part (left side) filled with mononuclear inflammatory cells in intra-alveolar space, alveolar septa, and peribronchial and perivascular areas. Day 2 postinfection, H&E, 40×. (D) Pulmonary edema and pneumocyte desquamation with inflammatory cells infiltration were commonly observed. Dilated alveoli, perivasculitis, and thickening of alveolar septa with inflammatory cells infiltration were also presented. Some cases showed the mononuclear cell aggregation and adherence to endothelial cells in the vessels. Day 4 postinfection, H&E, 100×. (E) Different degrees of congestion were commonly observed, and intra-alveolar hemorrhage was often associated in the area where prominent congestion occurred. Bronchial epithelial hyperplasia, perivascular inflammation and edema, organized pneumonia-like lesion with inflammatory cells, and giant cells were also presented. Day 6 postinfection, H&E, 100×. (F) Reactive mesothelial hyperplasia with inflammatory cell infiltration and subpleural edema were observed in the advanced stages. Alveolar space and septa were filled by inflammatory cells and giant cells with interstitial thickening, which resembles organized pneumonia. Day 6 postinfection, H&E, 100×. (G) Inflammatory cytokine expression. ELISA determined the concentration of IFN-γ, TNF-α, and interleukin-6 (IL-6) in the BALF or serum of uninfected controls or hamsters infected i.t. with 9 × 105 PFU SARS-CoV-2 for 2 or 4 days. Data were evaluated by Kruskal-Wallis test with Dunn’s multiple-comparison posttest. Asterisks denote the level of significance observed, as follows: **, P ≤ 0.005; ****, P ≤ 0.00005. n= 6 hamsters per time point.
FIG 3
FIG 3
Transcriptomic analysis of hamster lungs reveals kinetic modulation of host responses after SARS-CoV-2 infection. Male 5- to 6-week-old golden Syrian hamsters were infected intratracheally with SARS-CoV-2 isolate USA-WA-1/2020 or mock challenged with vehicle (PBS), and lungs were excised at days 2, 4, and 6 postinfection. (A) Heatmap of RNA-seq expression changes and main gene ontology terms for each cluster. (B) Correlation plot showing highly correlated transcripts with SARS-CoV-2 genome abundance. The size of a transcript represents the relative abundance, and the color indicates the fold change of the transcript between day 0 and day 2 with the associated GO terms in green circles.
FIG 4
FIG 4
Interferon-stimulated genes and innate immune signaling pathways are kinetically upregulated upon severe SARS-CoV-2 infection. (A) Bubble plot of significantly changed transcripts associated with interferon responses. Bubble size denotes relative abundance, and the following colors denote time points: green (day 0, uninfected), red (day 2), orange (day 4), and blue (day 6). (B) Bubble plot of significantly changed transcripts associated with JAK-STAT, Toll-like receptor, and RIG-I signaling pathways. Bubble size denotes relative abundance, and the following colors indicate time points: green (day 0, uninfected), red (day 2), orange (day 4), and blue (day 6).
FIG 5
FIG 5
Severe SARS-CoV-2 infection leads to interferon-stimulated antiviral proteins. Male 5- to 6-week-old golden Syrian hamsters were infected intratracheally with SARS-CoV-2 isolate USA-WA-1/2020 or mock challenged with vehicle (PBS), and lungs were excised at days 2, 4, and 6 postinfection. Immunoblots and relative protein level (densitometry) against ISG-15, SLAMF9, RSAD2, IRF-3, IRF-3p, IRF-7, IRF-7p, STAT1, STAT1p, STAT3, and STAT3p. Kruskal-Wallis test with Dunn’s multiple-comparison posttest. Asterisks denote the level of significance observed, as follows: *, P ≤ 0.05; **, P ≤ 0.01; ***, P ≤ 0.001; ****, P ≤ 0.0001.
FIG 6
FIG 6
Severe SARS-CoV-2 infection leads to lung proteome remodeling. Male 5- to 6-week-old golden Syrian hamsters were infected intratracheally with SARS-CoV-2 isolate USA-WA-1/2020 or mock challenged with vehicle (DMEM), and lungs were excised at days 2, 4, and 6 postinfection. (A) Proteomic changes of hamster lungs after SARS-CoV-2 infection or mock challenge (n = 3 to 4 per time point). Hierarchical clustering of label-free quantification (LFQ) intensities of significantly changed proteins (ANOVA, P < 0.05) revealed four distinct clusters. Their abundance profiles among the groups were plotted in the heatmap. Enriched GO biological process terms are indicated for each marked cluster. (B) Immunoblots for complement C3b (C3b), myeloperoxidase (MPO), catalase, neutrophil elastase (NE), gasdermin D (GSDMD), caspase-1, cleaved caspase-1, cleaved caspase-3, and actin (n = 3 to 4 per group). Total protein is also shown as a loading control. Histograms of protein level quantification (densitometry). Kruskal-Wallis test with Dunn’s multiple-comparison posttest. Asterisks denote the level of significance observed, as follows: *, P ≤ 0.05; **, P ≤ 0.01; ***, P ≤ 0.001; ****, P ≤ 0.0001.
FIG 7
FIG 7
Proteomic analysis of early time point after infection shows strong innate immune responses against viral infection. (A) Quantitative comparison of SARS-CoV-2-infected or mock-infected (DMEM challenge) hamsters (n = 3 to 4 per group). Log2 fold change of the proteins (x axis) and their significance (P < 0.05; y axis) were plotted. Up- and downregulated proteins are highlighted in red and blue, respectively. (B) Percent associated genes of representative GO terms for upregulated proteins at day 2 postinfection relative to uninfected lungs. (C) Percent associated genes of representative GO terms for downregulated proteins at day 2 postinfection relative to uninfected lungs.
FIG 8
FIG 8
SARS-CoV-2 infection promotes lung phosphoproteome remodeling. Male 5- to 6-week-old golden Syrian hamsters were infected intratracheally with SARS-CoV-2 strain USA-WA-1/2020 or mock challenged with vehicle (DMEM), and lungs were excised at days 2, 4, and 6 postinfection. Heatmap of phosphorylation changes of hamster lung proteins after SARS-CoV-2 infection or mock challenge (n = 3 to 4 per time point). Hierarchical clustering of significantly changed phosphorylation state of proteins (ANOVA; P ≤ 0.05) revealed 2 distinct major clusters. Enriched GO biological process terms are indicated for phosphoproteins with increasing phosphorylation through the course of infection.
FIG 9
FIG 9
Integrated multi-omics analysis of lung transcriptome and proteome shows strong tissue injury and innate immune responses upon severe SARS-CoV-2 infection. (A) Venn diagram of transcripts with matching Uniprot IDs and global lung proteome. (B) Percent associated genes of representative GO terms for 269 globally shared factors in unfiltered proteome and transcriptome. (C) Venn diagram of transcripts with matching Uniprot IDs and global lung proteome factors significantly altered in at least one time point (0, 2, 4, and 6 days). (D) Percent associated genes of representative GO terms for 132 significantly changed shared factors in at least one time point (0, 2, 4, and 6 days).
FIG 10
FIG 10
Integrated multiproteomic analysis of heart, lungs, and kidneys reveals shared factors associated with vascular injury and immune activation. (A) Venn diagram of shared proteins from global proteome analysis of lungs, hearts, and kidneys. (B) Percent associated genes of representative GO terms for 192 globally shared factors in unfiltered proteomes. (C) Venn diagram of global lung, heart, and kidney proteome factors significantly altered in at least one time point (0, 2, 4, and 6 days). (D) Percent associated genes of representative GO terms for 17 significantly changed shared factors in all tested organs. (E) Heatmap showing differential expression for the 17 significantly changed shared factors in all tested organs.

Similar articles

Cited by

References

    1. Tang D, Comish P, Kang R. 2020. The hallmarks of COVID-19 disease. PLoS Pathog 16:e1008536. 10.1371/journal.ppat.1008536. - DOI - PMC - PubMed
    1. Chen G, Wu D, Guo W, Cao Y, Huang D, Wang H, Wang T, Zhang X, Chen H, Yu H, Zhang X, Zhang M, Wu S, Song J, Chen T, Han M, Li S, Luo X, Zhao J, Ning Q. 2020. Clinical and immunological features of severe and moderate coronavirus disease 2019. J Clin Invest 130:2620–2629. 10.1172/JCI137244. - DOI - PMC - PubMed
    1. Fabrizi F, Alfieri CM, Cerutti R, Lunghi G, Messa P. 2020. COVID-19 and acute kidney injury: a systematic review and meta-analysis. Pathogens 9:1052. 10.3390/pathogens9121052. - DOI - PMC - PubMed
    1. Li YC, Bai WZ, Hashikawa T. 2020. The neuroinvasive potential of SARS-CoV2 may play a role in the respiratory failure of COVID-19 patients. J Med Virol 92:552–555. 10.1002/jmv.25728. - DOI - PMC - PubMed
    1. Xu Z, Shi L, Wang Y, Zhang J, Huang L, Zhang C, Liu S, Zhao P, Liu H, Zhu L, Tai Y, Bai C, Gao T, Song J, Xia P, Dong J, Zhao J, Wang FS. 2020. Pathological findings of COVID-19 associated with acute respiratory distress syndrome. Lancet Respir Med 8:420–422. 10.1016/S2213-2600(20)30076-X. - DOI - PMC - PubMed

Publication types

MeSH terms