. 2021 Jul 28;13(14):18051-18093.
doi: 10.18632/aging.203336. Epub 2021 Jul 28.

Beneficial effects of dietary supplementation with green tea catechins and cocoa flavanols on aging-related regressive changes in the mouse neuromuscular system

Affiliations

Beneficial effects of dietary supplementation with green tea catechins and cocoa flavanols on aging-related regressive changes in the mouse neuromuscular system

Sílvia Gras et al. Aging (Albany NY). .

Abstract

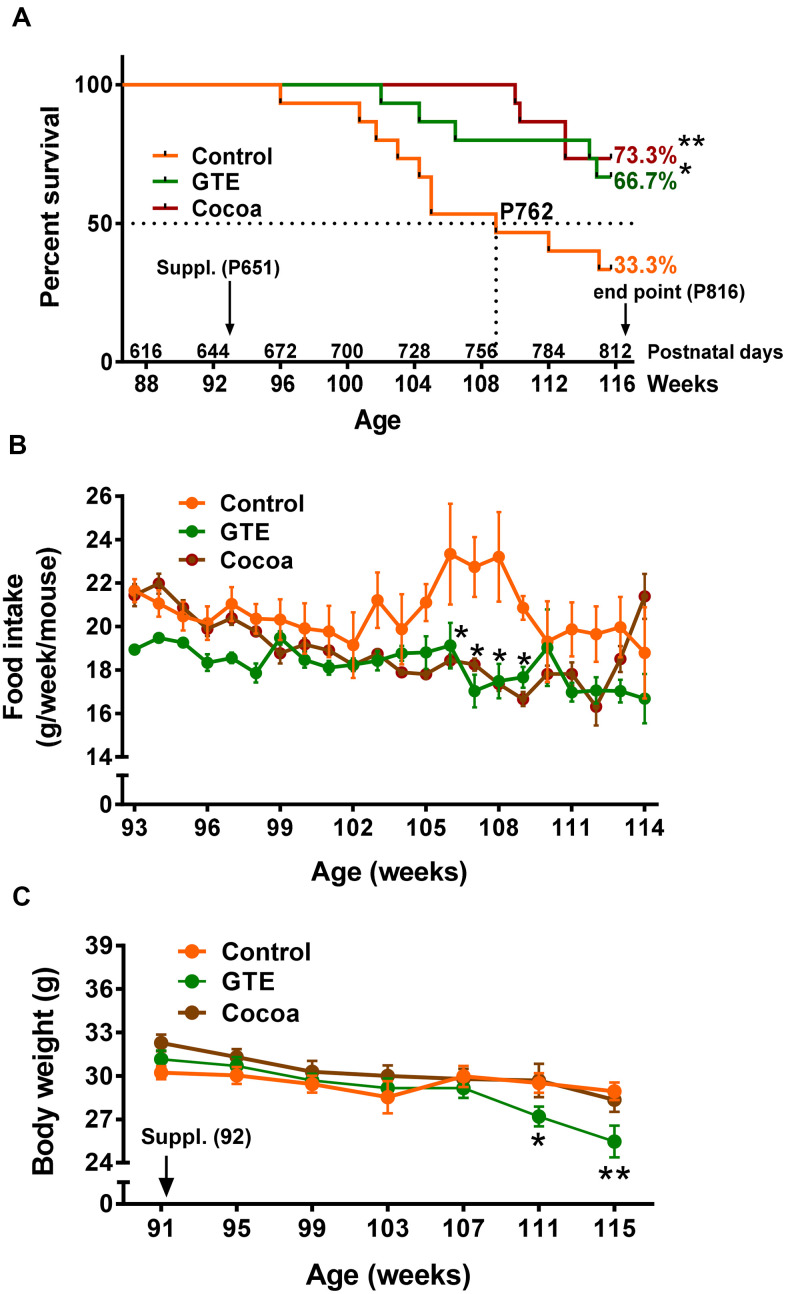
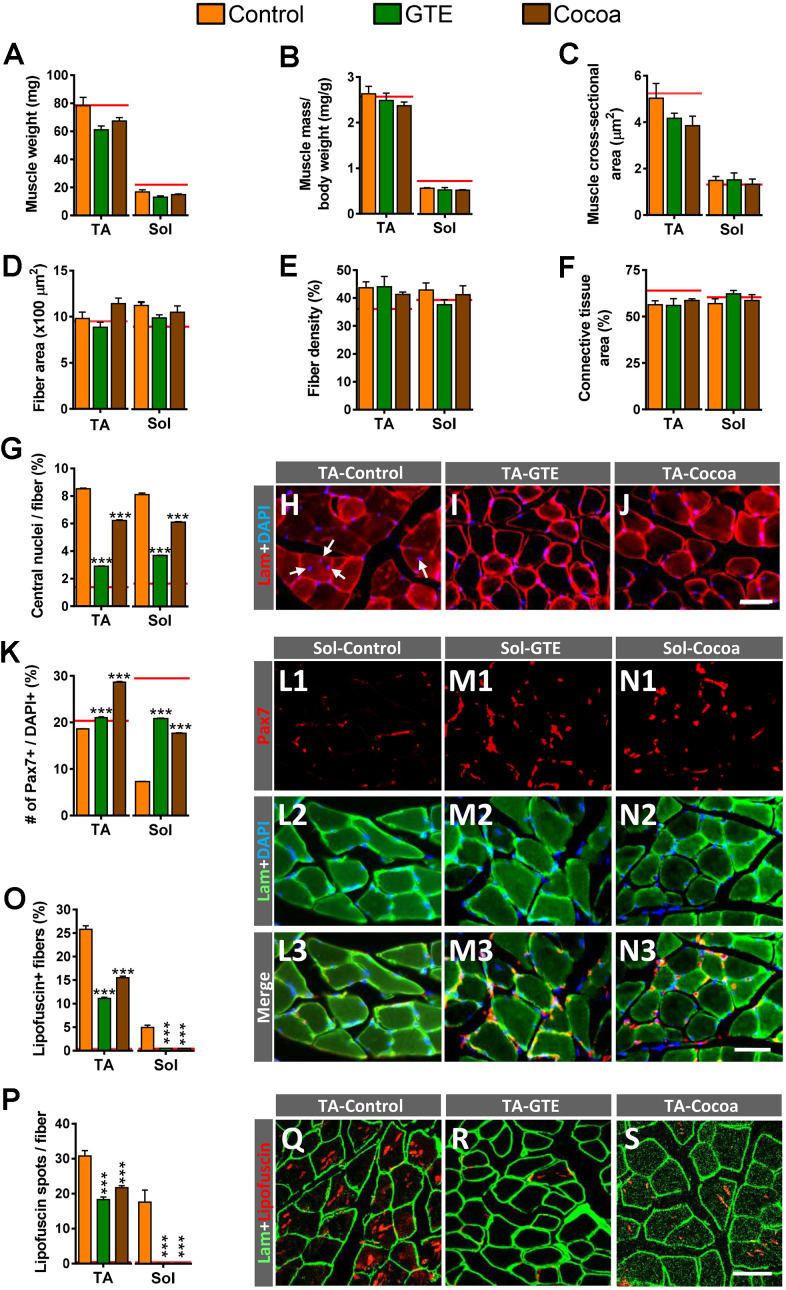
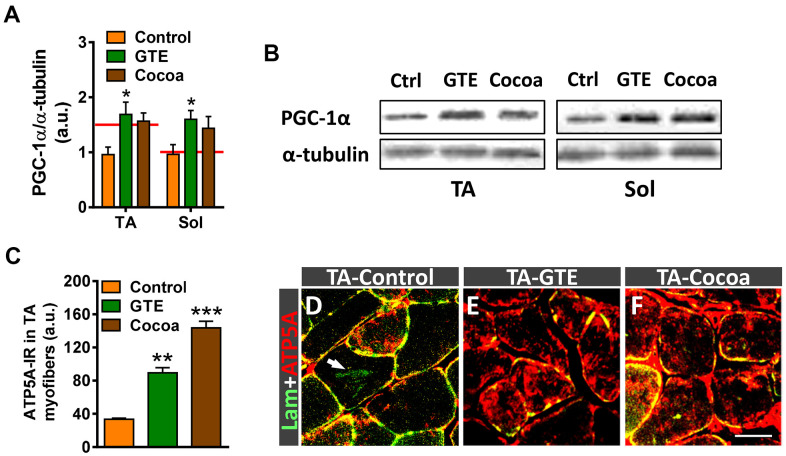
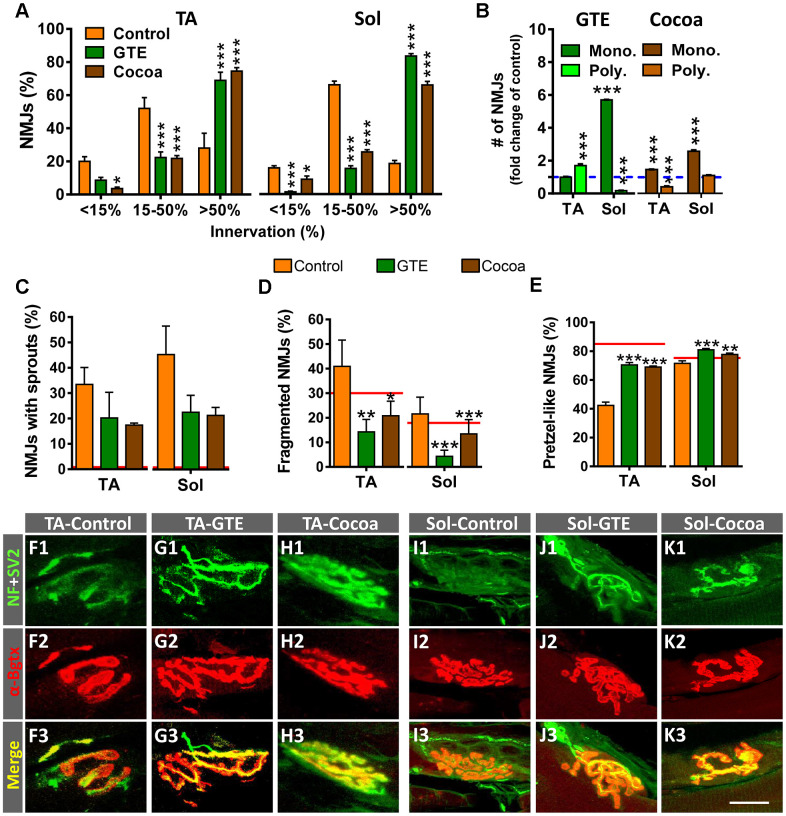
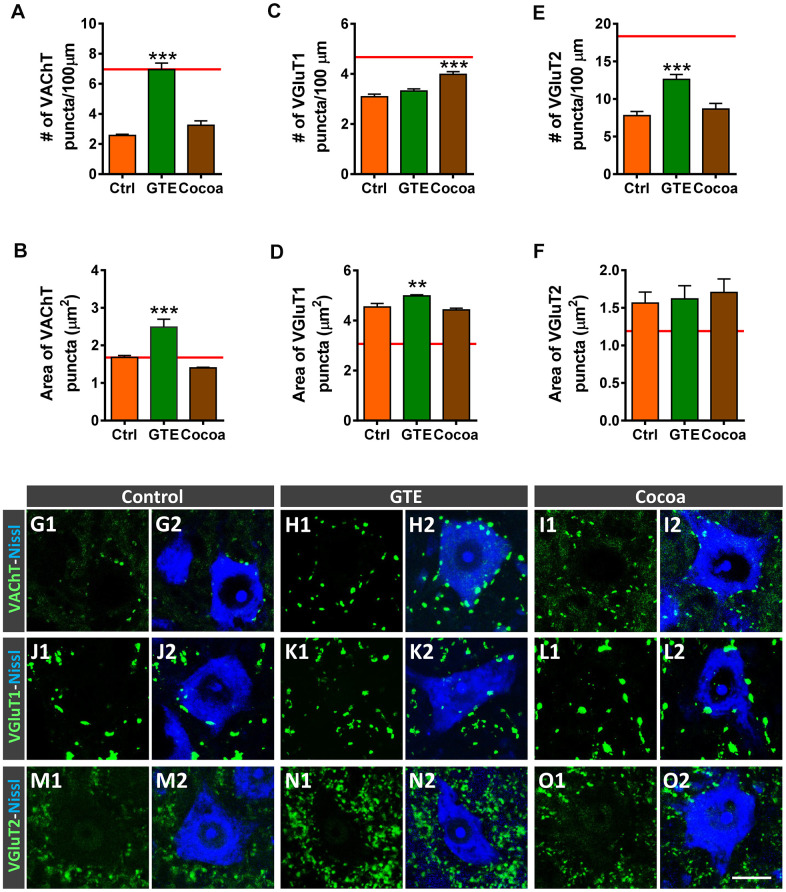
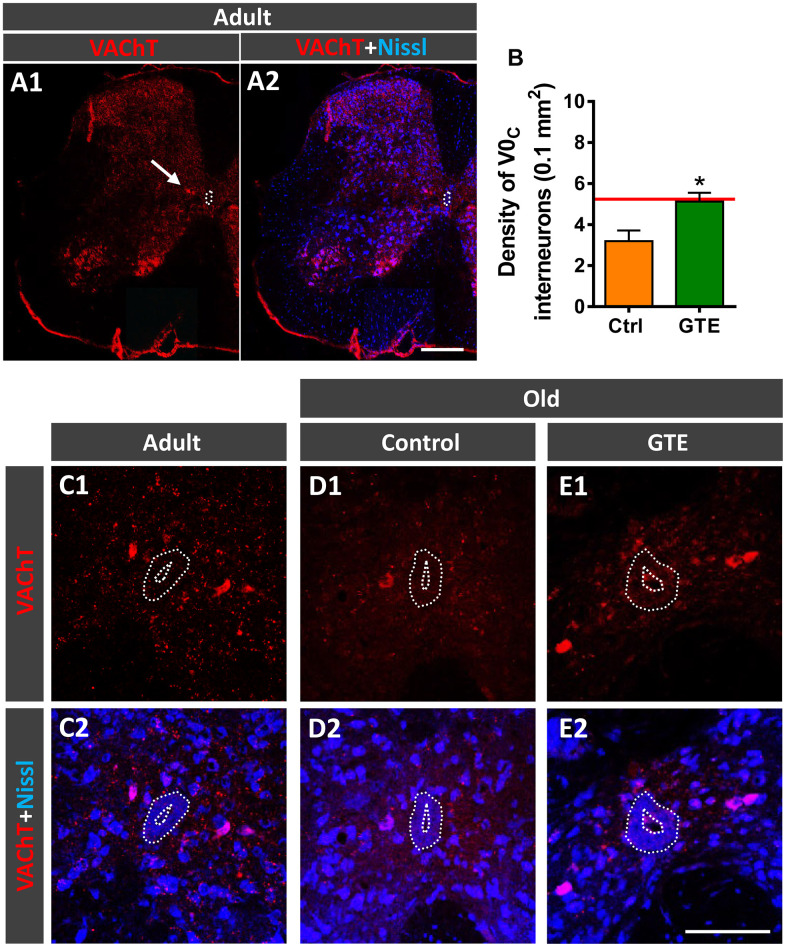
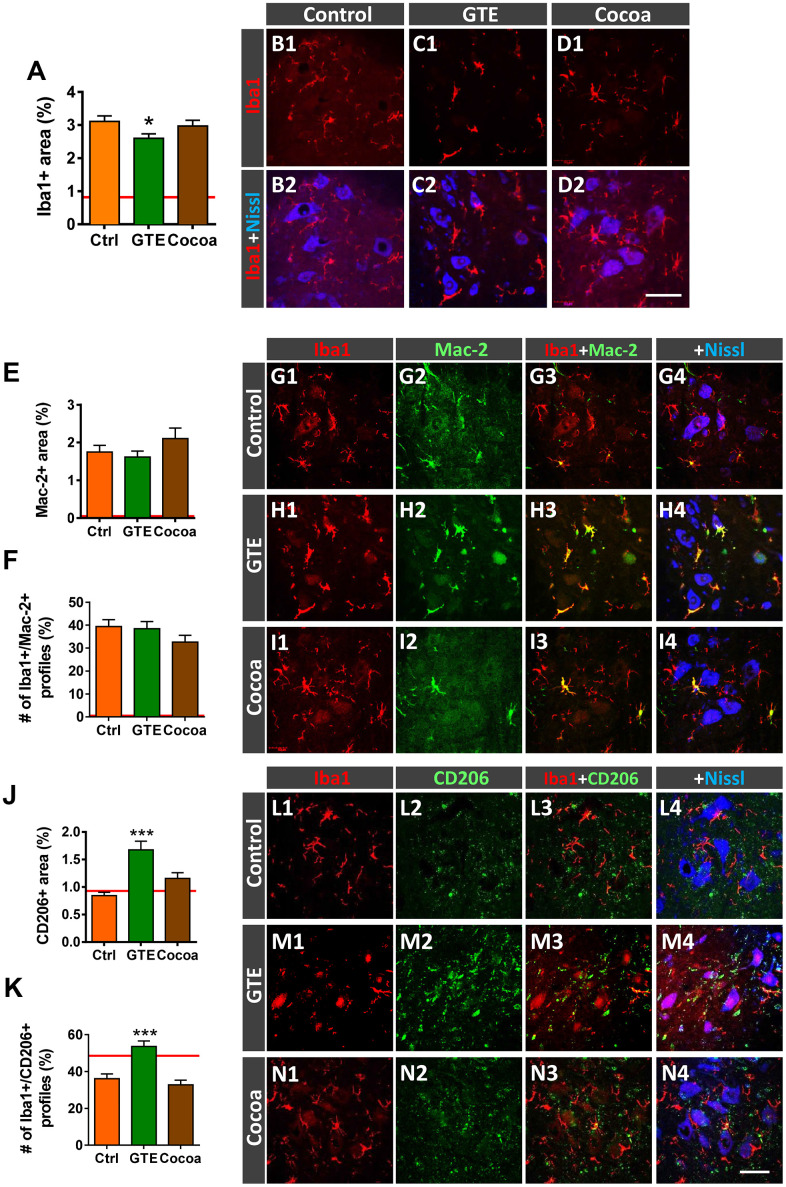
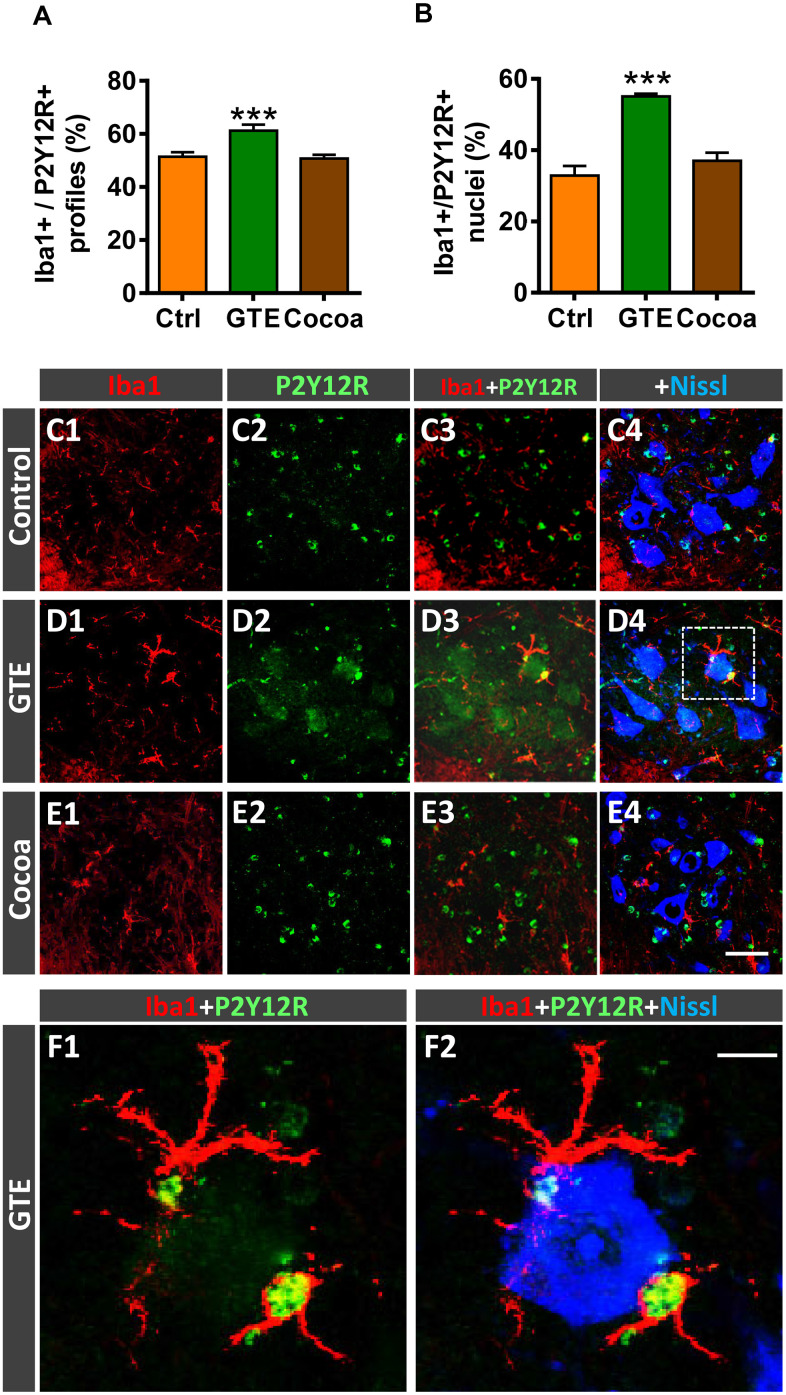
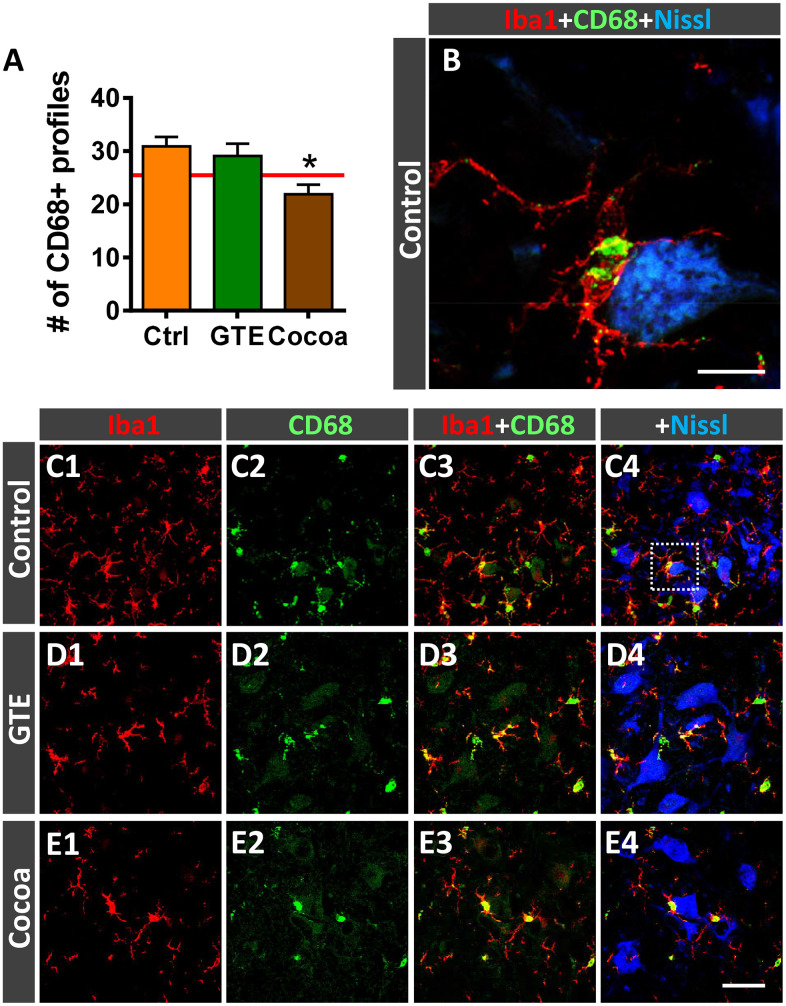
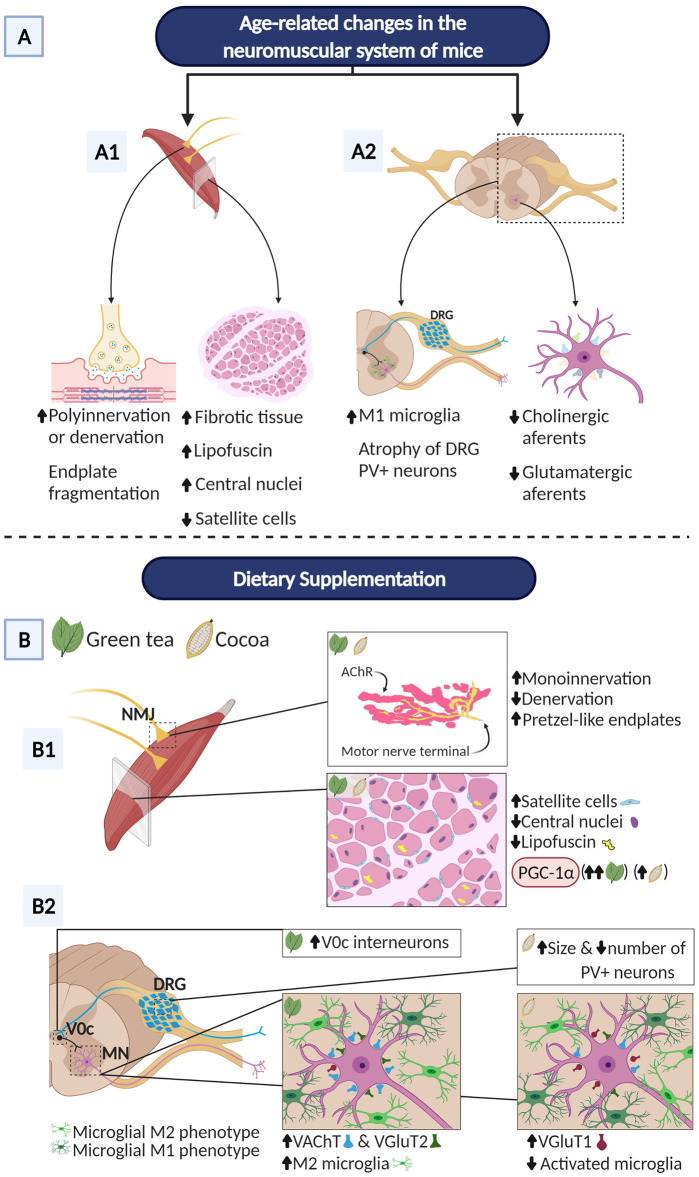
Besides skeletal muscle wasting, sarcopenia entails morphological and molecular changes in distinct components of the neuromuscular system, including spinal cord motoneurons (MNs) and neuromuscular junctions (NMJs); moreover, noticeable microgliosis has also been observed around aged MNs. Here we examined the impact of two flavonoid-enriched diets containing either green tea extract (GTE) catechins or cocoa flavanols on age-associated regressive changes in the neuromuscular system of C57BL/6J mice. Compared to control mice, GTE- and cocoa-supplementation significantly improved the survival rate of mice, reduced the proportion of fibers with lipofuscin aggregates and central nuclei, and increased the density of satellite cells in skeletal muscles. Additionally, both supplements significantly augmented the number of innervated NMJs and their degree of maturity compared to controls. GTE, but not cocoa, prominently increased the density of VAChT and VGluT2 afferent synapses on MNs, which were lost in control aged spinal cords; conversely, cocoa, but not GTE, significantly augmented the proportion of VGluT1 afferent synapses on aged MNs. Moreover, GTE, but not cocoa, reduced aging-associated microgliosis and increased the proportion of neuroprotective microglial phenotypes. Our data indicate that certain plant flavonoids may be beneficial in the nutritional management of age-related deterioration of the neuromuscular system.

Keywords: aging; cocoa; green tea; neuromuscular system; sarcopenia.


Conflict of interest statement

CONFLICTS OF INTEREST: SLP, TD and RR are employees and stock holders of Abbott. ABa was employee and stock holder of Abbott during initiation of study. The other authors declare that they have no conflict of interest.

Figures

Figure 1
Figure 1
GTE and cocoa supplementations improve mouse survival rate. (A) Survival rate of mice from control, GTE and cocoa groups; the standard (AIN-93M) diet supplemented with either cocoa or GTE significantly increased the percentage of mice that were alive at the endpoint of experiment compared with control animals. (B) Food intake (expressed as g of food per week and mouse) was reduced in animals fed with the GTE- or cocoa-supplemented diets, this reduction being statistically significant in a period ranging from 105-109 weeks of age. (C) Body weight (g) of animals from the three experimental groups; compared to control mice, no significant changes in body weight were found in animals from cocoa group; a significant reduction in weight was, however, observed in GTE-supplemented mice. Data are shown as the mean ± SEM (number of animals per group: 91 weeks of age, n = 15 in all groups; 107 weeks, control n = 8, GTE n = 13; cocoa n = 15; 114 weeks, control n = 6, GTE n = 12, cocoa n = 11); *p < 0.05 and **p < 0.01 vs. control (Gehan-Breslow-Wilcoxon test, in (A) and multiple t-test (Bonferroni correction), in (B, C).
Figure 2
Figure 2
Impact of GTE- and cocoa-supplemented diets on aging-associated changes in TA and Sol muscles of mice. (AC) Muscle wet weight (in mg, A), muscle weight relative to body weight (expressed in mg/g, B) and muscle cross-sectional area (in μm2, C) are shown. (D) Average myofiber size (cross-sectional area in μm2). (E, F) Density of myofibers (E) and muscular content of connective tissue (F), expressed as the percentage of area occupied by either myofibers or connective tissue respect to the total cross-sectional muscle area). (G) Proportion of myofibers displaying central nuclei. (HJ) Representative images of transversal cryosections of TA muscles of control, GTE and cocoa groups (as indicated); sections were double labeled with an antibody against laminin (red) and DAPI (blue) for DNA; arrows in (H) indicate central nuclei. (K) Percentage of Pax7-immunostained cells (SCs) with respect to DAPI-positive nuclei. (L1N3) Representative images of a combined immunolabeling for Pax7 (red) and laminin (green), and DAPI staining (blue) in transversal cryosections of Sol muscles from control, GTE and cocoa groups, as indicated. (O, P) Percentage of myofibers containing lipofuscin aggregates (O), and average number of lipofuscin granules per myofiber (P). (QS) Representative images of transversal cryosections of TA muscles from control, GTE and cocoa groups (as indicated) immunolabeled for laminin (green); lipofuscin autofluorescence (red) was excited using 510-560 nm excitation and 590 emission filters. Data in graphs are expressed as the mean ± SEM; the average values of adult muscles found in a previous study [6] were indicated by a red line in each graph for comparative purposes; ***p < 0.001 vs. control (Ctrl), two-way ANOVA, Bonferroni’s post hoc test; sample size per condition: (AC) = 6-12 muscles and (DF) = 3-5 muscles from different mice; (G, K) = 2500-4000 fibers and (O, P) = 1200-2200 fibers per muscle from 3-5 animals. Scale bars: 40 μm in (J) (valid for H, I), in N3 (valid for L1N2) and S (valid for Q, R).
Figure 3
Figure 3
GTE- and cocoa-supplemented diets partially prevent the decrease in PGC-1α expression and restore mitochondrial depletion occurring muscles in the course of age. (A) Densitometric analysis of changes in PGC-1α levels in muscles from the three experimental conditions; data were normalized to α-tubulin. Bars represent the values (mean ± SEM) of 3 mice per condition from 2 independent western blot analysis; *p < 0.05 vs. control, two-way ANOVA (Bonferroni’s post-hoc test); red lines in graph indicate PGC-1α levels found in adult muscles. (B) Representative western blots of PGC-1α and α-tubulin (as loading control) proteins in TA and Sol muscles from mice of control (Ctrl), GTE and cocoa groups. (C) Quantification of ATP5A-immunoreactivity in TA muscles of control, GTE and cocoa groups; bars represent the values (mean ± SEM) of 3 mice per condition; **p < 0.01 and ***p < 0.001 vs. control, one-way ANOVA (Bonferroni’s post-hoc test). (DF) Representative images showing a combined immunolabeling for laminin (lam, green) and ATP5A (red) in transversal cryosections of TA muscles from three experimental groups used for quantification, as indicated. Note the overt increase in ATP5A immunostaining after GTE (E) and, particularly, cocoa (F) supplementation compared to control (D). Arrow in (D) points out lipofuscin deposition in a myofiber. Scale bar in (F): 50 μm (valid for D, E).
Figure 4
Figure 4
GTE- and cocoa-supplemented diets prevent aging-associated muscle denervation and regressive morphological alterations in NMJs. (A) Proportion of TA and Sol NMJs displaying different degrees of innervation; quantification was based on the percentage of α-Bgtx-labeled postsynaptic site area covered by SV2-immunostained presynaptic terminals (see Materials and Methods, <15% innervation was considered as denervated). (B) Number of NMJs of TA and Sol muscles exhibiting single (mono.) or multiple (poly.) innervation expressed as fold change of control group (blue dashed line). (CE) Percentage of NMJs showing terminal axonal sprouts (C), fragmented endplates (D) and postsynaptic sites exhibiting a pretzel-like appearance (E, indicative of high degree of synaptic maturity), in TA and Sol muscles of animals from different experimental groups. Bars in graphs represent the mean ± SEM; sample size: 30-58 (A), and 50-85 (BE) NMJs per muscle from 3-5 animals per condition; *p < 0.05, **p < 0.01 and ***p < 0.001 vs. control, one or two-way ANOVA, Bonferroni’s post hoc test; red lines in (CE) indicate values in adult mice previously reported [6]. (F1K3) Representative maximal projections of confocal stacks of NMJs of TA (F1H3) and Sol (I1K3) from mice of control, GTE and cocoa groups (as indicated in panels); muscle sections were stained with antibodies against NF and SV2 (green, for presynaptic nerve terminals), and α-Bgtx (red, for postsynaptic AChR). Scale bar in K3 = 20 μm (valid for F1K2).
Figure 5
Figure 5
Effects of GTE- and cocoa-supplemented diets on excitatory cholinergic (VAChT-positive) and glutamatergic (VGluT1 and VGluT2) synaptic inputs to aged spinal MNs. (AF) Graphs show the average density (number of puncta per 100 μm of MN soma perimeter, A, C, E) and size (in μm2, B, D, F) of the different types of afferent synapses examined; the red dashed line in each graph indicates the mean value of the corresponding afferent synapse density or size found in adult mice [6]. (G1O2) Representative confocal micrographs of VAChT, VGluT1 and VGluT2 nerve terminals contacting MN cell bodies of animals from control, GTE and cocoa groups, as indicated. Spinal cord sections were immunolabeled for either VAChT, VGluT1 or VGluT2 (green), and counterstained with fluorescent Nissl staining (blue) to visualize MN cell bodies, as indicated in panels. Data in the graphs are expressed as the mean ± SEM, **p < 0.01 and ***p < 0.001 vs. control (one-way ANOVA, Bonferroni’s post hoc test); 50-60 MNs were analyzed per animal (number of animals per group: control =3, GTE = 4; and cocoa = 5). Scale bar in O2 = 20 μm (valid for G1O1).
Figure 6
Figure 6
GTE-supplemented diet prevents the age-related loss of V0C interneurons. (A1, A2) A general view of a spinal cord hemisection of an adult mouse immunolabeled for VAChT (red) and counterstained with fluorescent Nissl (blue) for neuron identification; the arrow points to a V0C interneuron cluster located near the central canal (delimited by a dotted line); note also the different VAChT-positive MN pools in the ventral horn. (B) Density of V0C interneurons in spinal cords of aged animals from control and GTE groups; bars represent the mean ± SEM of 3-5 animals (20-28 images) per condition; *p < 0.05 vs. control (Student’s t-test); the red line indicates the mean value in adult mice found in [6]. (C1F2) Representative confocal micrographs of VAChT-positive V0C interneurons (red) in the spinal cords of an adult mouse (C1, C2) and of old animals fed with the control (D1, D2) and GTE-supplemented diet (E1, E2); sections were counterstained with fluorescent Nissl (blue) for neuron visualization; the central canal is delimited by dotted lines. Scale bars: in A2 = 200 μm (valid for A1), and in E2 = 100 μm (valid for C1E1).
Figure 7
Figure 7
Impact of GTE- and cocoa-supplemented diets on the aging-associated microgliosis and imbalance in M1/M2 microglial phenotypes found in the ventral horn spinal cord of old mice. Lumbar spinal cord sections were immunostained for the microglial marker Iba1 (red), and either Mac-2 or CD206 (green), for M1 or M2 microglia, respectively; fluorescent Nissl staining (blue) was used for MN visualization. (A) Quantification of microglia expressed as the percentage of ventral horn occupied by Iba1-positive profiles. (B1D2) Representative confocal images showing Iba1-staining around spinal cord MNs of animals from control, GTE and cocoa groups as indicated in panels. (E, F, J, K) Quantification of Mac-2-positive (E) and CD206-positive (J) profiles surrounding MNs shown as the percentage of ventral horn area occupied by the immunostained profiles; the proportion of microglial profiles expressing both Iba1 and either Mac-2 (F) or CD206 (K) is also shown. The average values of these parameters in adult mice from our previous study [6] are indicated in each graph (red lines) for comparison purposes. (G1I4, L1N4) Representative confocal micrographs used for data analysis showing Mac-2 (G1I4) and CD206 (L1N4) in combination with Iba1 and fluorescent Nissl staining, as indicated in panels. Data in the graphs are expressed as the mean ± SEM; a total of 45-50 images per experimental group were analyzed (number of animals per group: control [Ctrl] = 3, GTE = 4, cocoa = 5); *p < 0.05 and ***p < 0.001 vs. Ctrl (one-way ANOVA, Bonferroni's post hoc test). Scale bar in N4 = 50 μm (valid for B1D1, G1I4, L1N3).
Figure 8
Figure 8
Impact of GTE- and cocoa-supplemented diets on P2Y12R expression in spinal cord microglia of old mice. Sections of lumbar spinal cords from mice of different experimental groups were double immunostained for Iba1 and P2Y12R. (A, B) Quantification of Iba1-positive profiles also exhibiting P2Y12R immunoreactivity (A) and of those displaying nuclear P2Y12R expression (B). (C1F2) Representative confocal micrographs used for data analysis showing P2Y12R (green) in combination with Iba1 (red) and fluorescent Nissl staining (blue, for MN visualization), as indicated in panels. A higher magnification of area delimited by the dashed square in D4 is shown in (F1, F2). Note the nuclear expression of P2Y12R in Iba1-positive microglial cells in close contact with a MN. Data in the graphs are expressed as the mean ± SEM; a total of 40-50 images per experimental group were analyzed (number of animals per group: control [Ctrl] = 3, GTE = 4, cocoa = 5); ***p < 0.001 vs. Ctrl (one-way ANOVA, Bonferroni's post hoc test). Scale bar: 50 μm in (E4) (valid for C1E3) and 10 μm in (F2) (valid for F1).
Figure 9
Figure 9
Impact of GTE- and cocoa-supplemented diets on microglial activation in ventral horn spinal cord of old mice. Sections of lumbar spinal cords from mice of different experimental groups were double immunostained for Iba1 and CD68, a marker of activated phagocytic microglia. (A) Quantification of CD68-positive profiles around MNs in control, GTE and cocoa groups. (BE4) Representative confocal micrographs used for data analysis showing CD68 (green) in combination with Iba1 (red) and fluorescent Nissl staining (blue, for MN visualization), as indicated in panels. A higher magnification of area delimited by the dashed square in C4 is shown in (B). Data in the graph are expressed as the mean ± SEM; a total of 40-50 images per experimental group were analyzed (number of animals per group: control [Ctrl] = 3, GTE = 4, cocoa = 5). *p < 0.05 vs. Ctrl (one-way ANOVA, Bonferroni's post hoc test). Scale bar: 10 μm in (C) and 50 μm in (E4) (valid for C1E3).
Figure 10
Figure 10
Overview of main benefits promoted by GTE and cocoa dietary supplementations on aging-associated changes in the neuromuscular system of C57BL/6JRj mice. The hallmark neuromuscular alterations occurring in these mice in the course of aging [6] are also summarized. (A) NMJs of aged mice display signs of either denervation or polyinnervation, and endplate fragmentation, suggesting an active process of NMJ remodeling and muscle reinnervation. Additionally, aged muscles show increased fibrosis, abundant fibers with lipofuscin accumulation and centrally located nuclei (indicative of muscle regeneration), and a marked reduction in the proportion of SCs. Aged mouse spinal cords exhibit reactive gliosis in ventral horn with increased proportion of harmful M1 microglia and significant loss of excitatory cholinergic (C-boutons) and glutamatergic synapses on MNs; atrophy of sensory proprioceptive (PV-positive) DRG neurons was also seen. (B) GTE and cocoa supplementations significantly decrease muscle denervation and signs of NMJ degeneration; both supplements augment the proportion of NMJs exhibiting single innervation, reduce fragmentation of endplates and increase the number of them exhibiting a healthier, “pretzel-like”, appearance. Furthermore, GTE- and cocoa-enriched diets increase the density of satellite cells, and reduce lipofuscin deposition in myofibers and the proportion of them displaying central nuclei. PGC-1α, a key regulatory factor of mitochondrial biogenesis, shows increased muscular levels in animals fed with GTE and cocoa-supplemented diets. GTE-, but not cocoa-, supplementation prevents the aging-associated loss of cholinergic (C-bouton) and VGluT2-positive glutamatergic synapses on lumbar spinal cord MNs; cocoa, but not GTE, increases the density of VGluT1-positive glutamatergic nerve terminals contacting MNs. The prevention of age-related C-bouton loss promoted by GTE is associated with increased numbers of V0C interneurons, the neuronal origin of cholinergic C-bouton inputs to MNs. Additionally, the prevention of aging-associated loss of VGluT1-positive MN-afferents by cocoa is accompanied by the increased body size of PV-positive proprioceptive DRG neurons, the source of Ia VGluT1 afferents to MNs. Moreover, GTE-supplementation improves age-related reactive microgliosis in the spinal cord and increases the proportion of neuroprotective M2 microglial cells around MNs, indicating that the imbalance of M1/M2 microglia found to occur with aging can be potentially modulated by GTE. Created with BioRender.com.

Similar articles

Cited by

References

    1. Janssen I, Baumgartner RN, Ross R, Rosenberg IH, Roubenoff R. Skeletal muscle cutpoints associated with elevated physical disability risk in older men and women. Am J Epidemiol. 2004; 159:413–21. 10.1093/aje/kwh058 - DOI - PubMed
    1. Abellan van Kan G. Epidemiology and consequences of sarcopenia. J Nutr Health Aging. 2009; 13:708–12. 10.1007/s12603-009-0201-z - DOI - PubMed
    1. von Haehling S, Morley JE, Anker SD. An overview of sarcopenia: facts and numbers on prevalence and clinical impact. J Cachexia Sarcopenia Muscle. 2010; 1:129–33. 10.1007/s13539-010-0014-2 - DOI - PMC - PubMed
    1. Gava P, Kern H, Carraro U. Age-associated power decline from running, jumping, and throwing male masters world records. Exp Aging Res. 2015; 41:115–35. 10.1080/0361073X.2015.1001648 - DOI - PubMed
    1. Larsson L, Degens H, Li M, Salviati L, Lee YI, Thompson W, Kirkland JL, Sandri M. Sarcopenia: Aging-Related Loss of Muscle Mass and Function. Physiol Rev. 2019; 99:427–511. 10.1152/physrev.00061.2017 - DOI - PMC - PubMed

Publication types