. 2021 Jul 28;17(7):e1009700.
doi: 10.1371/journal.pgen.1009700. eCollection 2021 Jul.

Oligopaint DNA FISH reveals telomere-based meiotic pairing dynamics in the silkworm, Bombyx mori

Affiliations

Oligopaint DNA FISH reveals telomere-based meiotic pairing dynamics in the silkworm, Bombyx mori

Leah F Rosin et al. PLoS Genet. .

Abstract

Accurate chromosome segregation during meiosis is essential for reproductive success. Yet, many fundamental aspects of meiosis remain unclear, including the mechanisms regulating homolog pairing across species. This gap is partially due to our inability to visualize individual chromosomes during meiosis. Here, we employ Oligopaint FISH to investigate homolog pairing and compaction of meiotic chromosomes and resurrect a classical model system, the silkworm Bombyx mori. Our Oligopaint design combines multiplexed barcoding with secondary oligo labeling for high flexibility and low cost. These studies illustrate that Oligopaints are highly specific in whole-mount gonads and on meiotic squashes. We show that meiotic pairing is robust in both males and females and that pairing can occur through numerous partially paired intermediate structures. We also show that pairing in male meiosis occurs asynchronously and seemingly in a transcription-biased manner. Further, we reveal that meiotic bivalent formation in B. mori males is highly similar to bivalent formation in C. elegans, with both of these pathways ultimately resulting in the pairing of chromosome ends with non-paired ends facing the spindle pole. Additionally, microtubule recruitment in both C. elegans and B. mori is likely dependent on kinetochore proteins but independent of the centromere-specifying histone CENP-A. Finally, using super-resolution microscopy in the female germline, we show that homologous chromosomes remain associated at telomere domains in the absence of chiasma and after breakdown and modification to the synaptonemal complex in pachytene. These studies reveal novel insights into mechanisms of meiotic homolog pairing both with or without recombination.


Conflict of interest statement

The authors have declared that no competing interests exist.

Figures
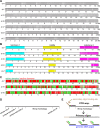
Fig 1
Fig 1. B. mori Oligopaint design.
(A-C) Schematic of Oligopaints in B. mori. Whole chromosome Oligopaints are shown in A, stripe Oligopaints in B, and active/inactive Oligopaints in C. White regions indicate the absence of oligos (A) or regions not labeled by the respective barcode indices (B, C). (D) Schematic of primary probe design, showing whole chromosome barcodes and two unique barcodes (for stripes or active/inactive domains). (E) Schematic for Oligopaint DNA FISH assay with labeled secondary oligos. First, ordered oligos are amplified with primers containing barcode of interest and secondary oligo binding site, generating primary oligos. Primary oligos are then annealed to DNA and labeled with secondary oligos (shown in green).
Fig 2
Fig 2. Whole chromosome Oligopaints in B. mori 5th instar germline squashes.
(A) Schematic of early meiosis I (prophase I and metaphase I). One pair of homologous chromosomes is shown (red = paternal; blue = maternal). Prophase I is typically subdivided into five distinct stages: leptotene, zygotene, pachytene, diplotene, and diakinesis. Briefly: in leptotene, replicated chromosomes are reorganized and compacted into a linear scaffold structure. In zygotene, synapsis begins between the homologous chromosomes. In pachytene, synapsis is complete (black dots represent the synaptonemal complex holding the homologs together). This stage is also when crossing over can occur. In diplotene, the homologs repulse, condense further, and the SC breaks down. The homologs remain attached via chiasma (crossovers). Finally, in diakinesis, chromosome condensation and cruciform bivalent formation is nearly complete as the cell prepares for metaphase I. Arrows in metaphase I schematic indicate the assumed direction of spindle poles based on the direction of the metaphase plate. (B-E) Pachytene cells labeled with three whole chromosome Oligopaints, as indicated. B-D, larval testes. E, larval ovary. Scale bars = 10 μm. DAPI is shown in gray. F-H) Meiotic prophase I cells from larval testes squashes with whole chromosome paints for ch7 (magenta), ch15 (orange), and ch16 (green). Boxes indicate subsequent panels as indicated. DAPI is shown in gray. (F) Leptotene/zygotene cells, with unpaired, decondensed chromosomes and a dense lampbrush DNA stain. (G) Pachytene cells, with paired, linear, and relatively decondensed chromosomes and a loose lampbrush DNA stain. (H) Diplotene/diakinesis cells, with paired, less linear and more compact chromosomes and a diffuse DNA stain. (I) Quantification of prophase cell staging from late 4th-early 5th instar larval testes. n = 3 testes were analyzed. Error bars show mean and standard deviation between testes. (J) Metaphase I cells, with paired homologs condensed and aligned along the metaphase plate. Arrows indicate the direction of spindle poles. (K) Mitotic cells from larval testes, with chromosomes condensed and aligned along the metaphase plate but with unpaired homologs. Arrows indicate the direction of spindle poles.
Fig 3
Fig 3. Stripe and active/inactive chromosome paints in B. mori 5th instar testes squashes.
(A) Left: Schematic of stripe paints for ch15, with tel1 in cyan, mid in yellow, and tel2 in magenta. Right: Pachytene cells labeled with ch15 stripe paints. (B-E) Left: Schematic of stripe paints for ch7, ch16, ch23 or chZ. Right: Representative pachytene nucleus labeled with stripe paints shown on left. (F) Left: Schematic of active/inactive paints for ch7, 15, and 16. Active domains are shown in green, and inactive domains are shown in red. Right: Representative pachytene nucleus labeled with paints for all 3 chromosomes.
Fig 4
Fig 4. Whole chromosome Oligopaints in zygotene-pachytene transition show a variety of folding and pairing configurations.
(A) Oligopaints for ch16 (green) or ch15 (orange) in representative zygotene nuclei showing the most prevalent partially paired chromosome configurations during pairing initiation. Dashed line approximates the nuclear edge. (B) Frequency histogram showing the fraction of cells harboring chromosomes in each partially paired configuration for the indicated chromosome. Statistics, Mann-Whitney test with each chromosome as a replicate. (C) Oligopaints for ch16 (green) and ch15 (magenta) in representative zygotene nuclei showing asynchronous pairing initiation. Top: Ch16 has begun pairing while ch15 remains entirely unpaired. Bottom: Ch15 is nearly completely paired while ch16 remains unpaired. Dashed line approximates the nuclear edge. (D) Quantification of pairing initiation for three chromosomes at a time in cells with zygotene DAPI morphology and linear chromosome morphology. (E) Quantification of which chromosome is initiating pairing in nuclei where only one of the three visualized chromosomes is partially paired (while the other two chromosomes show no contact between homologs). Chromosomes are ordered smallest to largest. Gray outline indicates gene-poor chromosomes, while black outline indicates gene-rich chromosome. Statistics, Fisher’s Exact Test comparing pairing initiated versus uninitiated. For all quantification, ***p<0.0001, **p<0.001, *p<0.01. All data were collected from n = 2–3 testes squashes per chromosome.
Fig 5
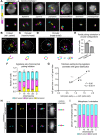
Fig 5. Analysis of pairing and metaphase I bivalent formation in 5th instar larval testes squashes using stripe paints.
(A) Left: Schematic of stripe paints for ch15, with tel1 in cyan, mid in yellow, and tel2 in magenta. Right: representative nuclei at the designated stages labeled with ch15 stripe paints. When cells enter meiosis, chromosomes begin to decondense (leptotene) and homologs pair (zygotene). Pairing is complete by pachytene, with complete synapsis for crossing over, and chromosomes are linear. Chromosomes begin to condense for segregation in diplotene and diakinesis. DAPI is shown in gray. (B) Top: Representative zygotene nucleus labeled with ch15 stripe paints showing a forked chromosome pairing configuration with tel1 paired. Bottom: Cartoon schematic of ch15 in above cell. (C) Top: Representative zygotene nucleus labeled with ch15 stripe paints showing a circular chromosome with a head-to-head pairing configuration. Bottom: Cartoon schematic of ch15 in above cell. (D) Top: Two representative zygotene nuclei labeled with ch15 stripe paints showing a circular chromosome with a head-to-tail pairing configuration. Bottom: Cartoon schematics of ch15 in above cells. (B-D) Dashed line indicates nuclear edge. (E) Quantification of circular chromosome pairing configurations in zygotene. Graph includes pooled data for ch15 and ch23, with n = 3 testes quantified for each. Error bars show standard deviation between chromosomes. **p = 0.0082, unpaired t-test. (F) Quantification of stripe domain pairing in cells with only one stripe domain paired. n = 3 testes were quantified for each chromosome. For all chromosomes, pairing at both telomere domains is significantly enriched compared to the middle domain (p<0.0001, Fisher’s exact test comparing tel1 vs mid and tel2 vs mid). Cyan asterisk = tel1 significantly enriched compared to tel2, magenta asterisk = tel2 significantly enriched compared to tel1 (Fisher’s exact test, p<0.05). (G) Dot plot showing tel1:tel2 pairing ratio (X-axis) versus tel1:tel2 gene density ratio (Y-axis). Line of best fit calculated for autosome data only. Z chromosome data (gray) included for comparison. (H) Metaphase I bivalents labeled with ch15 stripe paints. Top: bivalent with pairing in tel1 domain. Bottom: bivalent with pairing in tel2 domain. Schematics of bivalents shown on the right. (I) Quantification of metaphase I orientation for ch7, 15, 16, 23, and Z. Ch7, n = 357 (48% tel 1 paired). Ch15, n = 182 (45% tel 1 paired). Ch16, n = 252 (50% tel1 paired). Ch23, n = 519 (47% tel1 paired). ChZ, n = 169 (48% tel1 paired). Each FISH assay was performed on n = 2–3 testes.
Fig 6
Fig 6. FISH with stripe chromosome paints in whole mount 5th instar larval testes.
(A) Cartoon schematic of 5th instar larval testis. Mature 5th instar larval testes are comprised of four testicular lobes, each of which harbors germline stem cells (1, mitotic zone) and spermatocytes in all stages of meiosis up to mature sperm; progressing from right to left in the image as indicated: (2) meiosis I/primary spermatocytes, (3) meiosis II/secondary spermatocytes. Additionally, each lobe is surrounded by somatic cells in the sheath (4) and in the septae separating the lobes. (5–6) prophase I: (5) leptotene/zygotene, (6) pachytene/diplotene, (7) metaphase/anaphase I, (8) prophase/metaphase II, (9) spermatids, (10) mature sperm bundles. (B) Confocal image of 5th instar larval testis stained with DAPI. Boxes indicate subsequently zoomed panels as indicated. Inset: ch7 stripe paints used in C-E. (C) Zoom of mitotic and pachytene region of larval testes as shown in A, labeled with ch7 stripe paints. Red boxes indicate zooms shown to the right. (C1) mitotic cells–chromosomes condensed, homologs unpaired, and aligned at the metaphase plate. Note how chromosomes are compacted perpendicular to the metaphase plate. (C2) leptotene cells, chromosomes are slightly decondensed and homologs are unpaired. (C3) pachytene cells, chromosomes are paired head-to-tail and linear. (D) Zoom of late prophase/metaphase I region of larval testis as shown in A, labeled with ch7 stripe paints. Red boxes indicate zooms shown to the right and below. Please note that some FISH signal background is visible within the DNA in this image. This is an artifact of the size of the larval gonad and the imaging depth. (D1) diplotene cells (diffuse stage), chromosomes are still paired and beginning to condense. Left: merged with DAPI in gray. Right: ch7 tel1 in cyan, mid in yellow, and tel2 in magenta. (D2) metaphase I cells labeled with ch7 stripe paints. White box indicates zoom shown in E. Left: merged with DAPI in gray. Right: tel1 (cyan) and tel2 (magenta) paints. Percent of cells with tel1 or tel2 paired indicated inside the panel. Cells from 1–2 bundles each from n = 3 testes were quantified for a total of n = 196 cells (47% tel1 paired). (D3) eupyrene-destined secondary spermatocyte bundle. Left: merged ch7 stripe paints with DAPI in gray. Right: ch7 stripe paints, tel1 (cyan) and tel2 (magenta). (D4) apyrene-destined secondary spermatocyte bundle. Left: merged ch7 stripe paints with DAPI in gray. Right: DAPI. Yellow arrowheads indicate spermatocytes that have already undergone nuclear degradation. Scale bar = 2 μm for all panels 1–4. (E) Zoom of metaphase I cell indicated in C2. Top: merged with DAPI in gray. Bottom: ch7 tel1 (cyan), mid (yellow), and tel2 (magenta) paints. Bivalent pairing is in tel2 domain in this cell. Note: zoomed fields for all panels may display a slightly different Z position than the larger field views for better clarity.
Fig 7
Fig 7. FISH with stripe chromosome paints in whole mount 5th instar larval ovary.
(A) Schematic of ovariole from 5th instar B. mori larval ovary. (B1-D1) Representative field of nuclei from larval ovary labeled with ch7 stripe paints imaged with diffraction-limited confocal microscopy. DAPI is shown in gray. (B) germarium (zone of pairing, region 1), (C) region of differentiation (region 2), (D) mature larval oocytes (region 3b). (C1-D1) yellow arrowheads indicate oocytes which were identified based on their unique chromosome morphology and weak DAPI stain. (B2-D5) Representative nuclei labeled with ch7 stripe paints and DAPI imaged with super-resolution microscopy. (B4-D4) zoom of ch7 shown in B2-D2. (D5) zoom of ch7 shown in D2, DAPI only. (D6) cartoon schematic of chromosomes in mature larval oocytes. (E) Measurement of distances between homologs obtained from super-resolution images. n = 3 ovaries were imaged and quantified. Measurements were taken from 3–5 chromosomes in 5–10 cells per ovary, resulting in 50–75 data points per region. ***p<0.001, Mann-Whitney test.

Similar articles

Cited by

References

    1. Bascom-Slack CA, Ross LO, Dawson DS. Chiasmata, crossovers, and meiotic chromosome segregation. Adv Genet. 1997;35:253–284. doi: 10.1016/s0065-2660(08)60452-6 - DOI - PubMed
    1. Fawcett DW. THE FINE STRUCTURE OF CHROMOSOMES IN THE MEIOTIC PROPHASE OF VERTEBRATE SPERMATOCYTES. The Journal of Biophysical and Biochemical Cytology. 1956;2:403–406. doi: 10.1083/jcb.2.4.403 - DOI - PMC - PubMed
    1. Moses MJ. Chromosomal Structures in Crayfish Spermatocytes. J Biophys Biochem Cytol. 1956;2:215–218. doi: 10.1083/jcb.2.2.215 - DOI - PMC - PubMed
    1. Agostinho A, Kouznetsova A, Hernández-Hernández A, Bernhem K, Blom H, Brismar H, et al.. Sexual dimorphism in the width of the mouse synaptonemal complex. J Cell Sci. 2018;131:jcs212548. doi: 10.1242/jcs.212548 - DOI - PubMed
    1. Cahoon CK, Yu Z, Wang Y, Guo F, Unruh JR, Slaughter BD, et al.. Superresolution expansion microscopy reveals the three-dimensional organization of the Drosophila synaptonemal complex. Proc Natl Acad Sci USA. 2017;114:E6857–E6866. doi: 10.1073/pnas.1705623114 - DOI - PMC - PubMed

Publication types