. 2021 Jul 28;19(7):e3001355.
doi: 10.1371/journal.pbio.3001355. eCollection 2021 Jul.

Targeting Mycobacterium tuberculosis response to environmental cues for the development of effective antitubercular drugs

Affiliations

Targeting Mycobacterium tuberculosis response to environmental cues for the development of effective antitubercular drugs

Richard C Lavin et al. PLoS Biol. .

Abstract

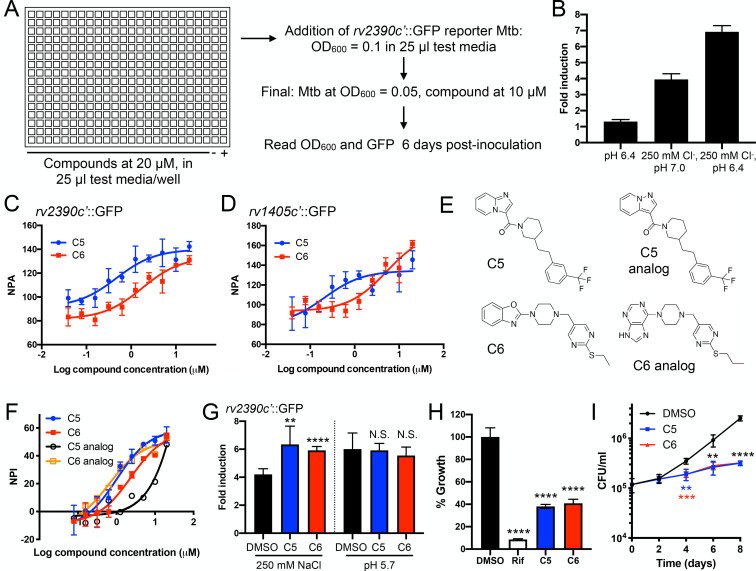
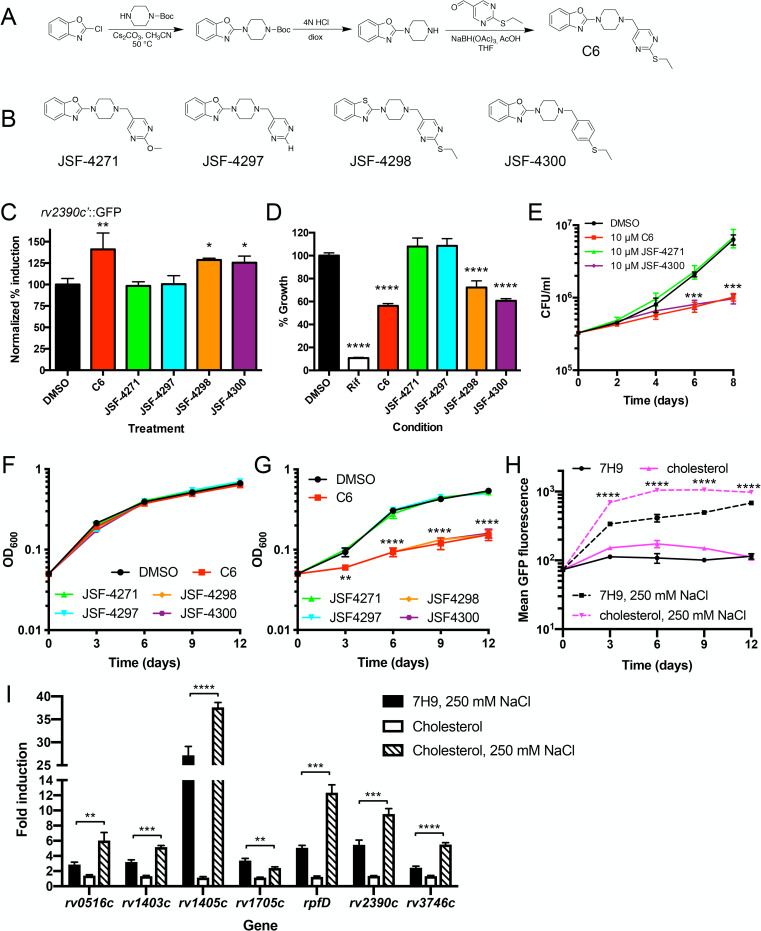
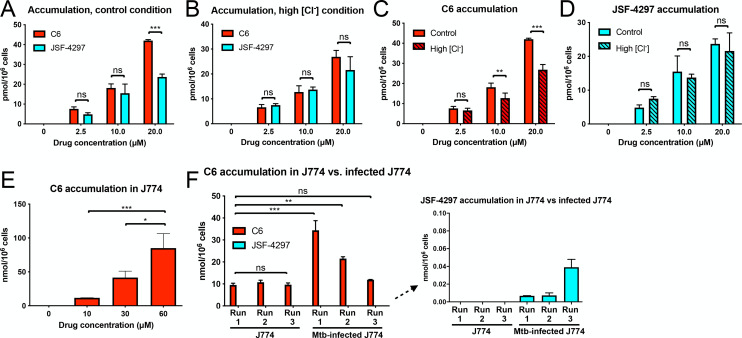
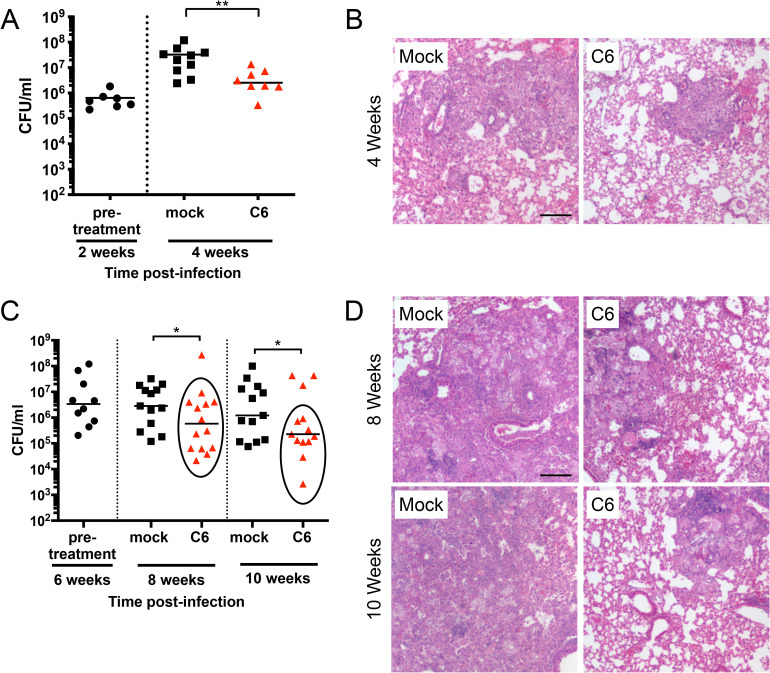
Sensing and response to environmental cues, such as pH and chloride (Cl-), is critical in enabling Mycobacterium tuberculosis (Mtb) colonization of its host. Utilizing a fluorescent reporter Mtb strain in a chemical screen, we have identified compounds that dysregulate Mtb response to high Cl- levels, with a subset of the hits also inhibiting Mtb growth in host macrophages. Structure-activity relationship studies on the hit compound "C6," or 2-(4-((2-(ethylthio)pyrimidin-5-yl)methyl)piperazin-1-yl)benzo[d]oxazole, demonstrated a correlation between compound perturbation of Mtb Cl- response and inhibition of bacterial growth in macrophages. C6 accumulated in both bacterial and host cells, and inhibited Mtb growth in cholesterol media, but not in rich media. Subsequent examination of the Cl- response of Mtb revealed an intriguing link with bacterial growth in cholesterol, with increased transcription of several Cl--responsive genes in the simultaneous presence of cholesterol and high external Cl- concentration, versus transcript levels observed during exposure to high external Cl- concentration alone. Strikingly, oral administration of C6 was able to inhibit Mtb growth in vivo in a C3HeB/FeJ murine infection model. Our work illustrates how Mtb response to environmental cues can intersect with its metabolism and be exploited in antitubercular drug discovery.


Conflict of interest statement

I have read the journal’s policy and the authors of this manuscript have the following competing interests: MS, JSP, JSF, and ST are listed as inventors on a patent filing pertinent to the compounds disclosed in this manuscript as employees of Rutgers University (MS, JSP, JSF) or Tufts University (ST). All other authors have no competing interests.

Figures

Fig 1
Fig 1. Reporter-based chemical screen identifies compounds that modulate Mtb response to environmental chloride levels and inhibit Mtb colonization of host macrophages.
(A) rv2390c′::GFP screen set-up. Schematic of the compound screen conducted in 384-well plates. DMSO-treated control wells with Mtb in 7H9 (pH 6.4) media (negative, −) or 7H9 (pH 6.4), 250 mM NaCl media (positive, +) were included in each plate. (B) Dual high [Cl], slightly acidic pH conditions provide increased reporter dynamic range. Mtb carrying the rv2390c′::GFP reporter was grown for 6 days in pH 7 control media or in the indicated conditions in a 384-well plate format. Fold induction represents rv2390c′::GFP signal/OD600 in each test condition as compared to the pH 7 control, measured by a microplate reader. Data are shown as means ± SD from 16 wells. (C) Dose response curve validation of 2 hit compounds. Mtb carrying the rv2390c′::GFP reporter was grown for 6 days in pH 6.4, 250 mM NaCl media treated with the indicated compound, in a 384-well plate format with controls as shown in the schematic in (A). NPA was calculated by setting GFP signal/OD600 of the reporter observed in the DMSO-treated positive control condition at 100% and comparing the compound-treated GFP signal/OD600 values to that baseline. Data are shown as means ± SD from 3 wells. The AC50 of compounds C5 and C6 was 0.5 μM and 1.8 μM, respectively. (D) Secondary screen results of 2 hit compounds. Mtb carrying the rv1405c′::GFP reporter was grown and assayed as in (C). Data are shown as means ± SD from 2–3 wells. (E) Structures of compounds C5 and C6 and their respective analogs in the screen. (F) Dose response curve testing of effect of hit compounds on Mtb growth in J774 macrophage-like cells. Mtb constitutively expressing mKO was used to infect J774 cells in a 384-well format, and cells treated with compounds, 5 μM rifampicin, or DMSO as a carrier control. mKO fluorescence was measured 6 days post-infection with a microplate reader. NPI was calculated by setting mKO signal observed in the rifampicin-treated condition as 100% inhibition (versus signal observed in the DMSO-treated controls) and comparing the mKO values in the compound-treated wells to that baseline. Data are shown as means ± SD from 2 wells. (G) Compounds C5 and C6 increase rv2390c′::GFP reporter response upon bacterial exposure to high [Cl]. Mtb carrying the rv2390c′::GFP reporter was grown for 9 days in 7H9 (pH 7.0) ± 250 mM NaCl or 7H9 (pH 5.7), treated with DMSO as a carrier control, 10 μM C5 or 10 μM C6. Reporter signal in fixed samples was measure by flow cytometry, with fold signal induction compared to the corresponding treatment in the 7H9 (pH 7) control condition. Data are shown as means ± SD from 5 experiments. p-values were obtained with an unpaired t test, comparing each compound treatment to DMSO treatment for each condition. N.S., not significant, **p < 0.01, ****p < 0.0001. (H) C5 and C6 inhibit growth in J774 cells. J774 macrophage-like cells were infected with Mtb constitutively expressing mKO and treated with DMSO, 5 μM rifampicin, 10 μM C5, or 10 μM C6. Bacterial growth was tracked by fluorescence, with readings taken 6 days post-infection. DMSO is the carrier control, and growth in that condition is set at 100%. Data are shown as means ± SD from 3–4 wells. p-values were obtained with a one-way ANOVA with a Dunnett multiple corrections test, and treatment sets compared to the DMSO control. ****p < 0.0001. (I) C5 and C6 inhibit growth in primary BMDMs. BMDMs were infected with WT Mtb and bacterial load determined at indicated times. DMSO as a carrier control, 10 μM C5 or 10 μM C6 was added 2 hours post-infection. Data are shown as means ± SD from 4 wells, pooled from 2 independent experiments. p-values were obtained with an unpaired t test, comparing each treatment to the DMSO control for a given time point. p-value in blue and red correspond to those for C5 and C6, respectively, while those indicated in black apply to both C5 and C6. **p < 0.01, ***p < 0.001, ****p < 0.0001. The numerical data underlying the graphs shown in this figure are provided in S1 Data. AC50, activatory concentration, 50%; BMDM, bone marrow–derived macrophage; mKO, monomeric Kusabira Orange; Mtb, Mycobacterium tuberculosis; NPA, normalized percent activation; NPI, normalized percent inhibition; WT, wild-type.
Fig 2
Fig 2. SAR analysis reveals that the chloride response phenotype of C6 tracks with inhibition of Mtb growth in macrophages.
(A) Schematic for synthesis of C6. (B) Structures of C6 analogs synthesized. (C–E) C6 analogs that lose the ability to increase Mtb response to high [Cl] also lose the Mtb growth inhibition phenotype in J774 cells and primary BMDMs. (C) The rv2390c′::GFP reporter Mtb strain was grown in 7H9 (pH 7) ± 250 mM NaCl and treated with DMSO, 10 μM C6, or 10 μM C6 analogs (JSF-4271, JSF-4297, JSF-4298, or JSF-4300) for 9 days and samples fixed and reporter GFP induction analyzed by flow cytometry. Data are shown as means ± SD from 3 independent experiments. p-values were obtained with a one-way ANOVA with a Dunnett multiple corrections test, and treatment sets compared to the DMSO control. *p < 0.05, **p < 0.01. (D) J774 macrophage-like cells were infected with Mtb constitutively expressing mKO and treated with DMSO, 5 μM rifampicin, 10 μM C6, or 10 μM C6 analogs (JSF-4271, JSF-4297, JSF-4298, or JSF-4300). Bacterial growth was tracked by fluorescence, with readings taken 6 days post-infection. DMSO is the carrier control, and growth in that condition is set at 100%. Data are shown as means ± SD from 4 wells. p-values were obtained with a one-way ANOVA with a Dunnett multiple corrections test, and treatment sets compared to the DMSO control. ****p < 0.0001. (E) BMDMs were infected with WT Mtb and bacterial load determined at indicated times. DMSO as a carrier control, 10 μM C6 or 10 μM C6, or 10 μM C6 analogs (JSF-4271, JSF-4297, JSF-4298, or JSF-4300) was added 2 hours post-infection. Data are shown as means ± SD from 3 wells. p-values were obtained with an unpaired t test, comparing each treatment to the DMSO control for a given time point, and apply to both C6 and JSF-4300. ***p < 0.001. (F) C6 does not affect Mtb growth in standard 7H9 media. Mtb was grown in standard 7H9 media and cultures treated with DMSO or 10 μM of indicated compounds. OD600 was tracked over time. Data are shown as means ± SD from 3 independent experiments. (G) C6 analogs that lose the ability to increase Mtb response to high [Cl] also lose the Mtb growth inhibition phenotype in cholesterol media. Mtb was grown in cholesterol media and cultures treated with DMSO or 10 μM of indicated compounds. OD600 was tracked over time. Data are shown as means ± SD from 3 independent experiments. p-values were obtained with an unpaired t test, comparing each treatment to the DMSO control for a given time point, and apply to C6, JSF-4298, and JSF-4300. **p < 0.01, ****p < 0.0001. (H) High [Cl] in the presence of cholesterol media increases expression of the rv2390c′::GFP reporter. The rv2390c′::GFP reporter Mtb strain was grown in 7H9 (pH 7) ± 250 mM NaCl or cholesterol media (pH 7) ± 250 mM NaCl, and samples fixed every 3 days for 12 days. Reporter GFP signal was analyzed by flow cytometry, and data are shown as means ± SD from 3 independent experiments. p-values were obtained with an unpaired t test, comparing the high [Cl]/cholesterol to the high [Cl] condition for a given time point. ****p < 0.0001. (I) Mtb response to high [Cl] is augmented in the presence of cholesterol. qRT-PCR of gene expression of WT Mtb exposed to 7H9 (pH 7) ± 250 mM NaCl or cholesterol media (pH 7) ± 250 mM NaCl, for 4 hours. Data are shown as means ± SD from 3 technical replicates, representative of 3 independent experiments. p-values were obtained with an unpaired t test, comparing the cholesterol, 250 mM NaCl condition to the 7H9, 250 mM NaCl condition for each gene. **p < 0.01, ***p < 0.001, ****p < 0.0001. The numerical data underlying the graphs shown in this figure are provided in S1 Data. BMDM, bone marrow–derived macrophage; mKO, monomeric Kusabira Orange; Mtb, Mycobacterium tuberculosis; qRT-PCR, quantitative real-time PCR; SAR, structure–activity relationship; WT, wild-type.
Fig 3
Fig 3. C6 accumulates in Mtb and host macrophages.
(A–D) Intrabacterial accumulation of C6 is higher than the inactive analog JSF-4297. Mtb were grown in 7H9 (pH 7) ± 250 mM NaCl for 6 days, before 24-hour exposure to C6 or JSF-4297 and analysis of intrabacterial compound content. (A) and (B) show dose-dependent intrabacterial accumulation of C6 versus JSF-4297 under control and high [Cl] conditions, respectively. (C) and (D) show the same data but compare C6 or JSF-4297 accumulation under control versus high [Cl] conditions in each case. (E) Intracellular accumulation of C6. J774 cells were exposed to indicated concentrations of C6 for 24 hours, before analysis of the samples for intracellular compound content. (F) C6 accumulation during Mtb infection of J774 cells. J774 cells were infected with Mtb for 5 days, before treatment with 10 μM of indicated compound for 24 hours, sample collection and analysis for total compound accumulation (within both J774 cells and bacteria within the J774 host cells). For (A–E), data are shown as means ± SD from 2–3 samples, representative of 2 independent experiments. In (F), data are shown as means ± SD from 2–3 wells, from 3 independent experiments. p-values were determined by one- (E) or two-way (A–D, F) ANOVA with Bonferroni post hoc test for all assays. ns p > 0.05, *p < 0.05, **p < 0.01, ***p < 0.001. The amount of accumulated compound as the number of moles was normalized by the cell number (Mtb or J774) prior to compound incubation. The numerical data underlying the graphs shown in this figure are provided in S1 Data. Mtb, Mycobacterium tuberculosis; ns, not significant.
Fig 4
Fig 4. C6 inhibits Mtb growth in vivo.
(A and B) C6 inhibits Mtb growth in a short-term infection model. C3HeB/FeJ WT mice were infected with Mtb for 2 weeks (pre-treatment), before mock treatment or treatment with 250 mg/kg C6 (5 days/week via oral gavage) for a further 2 weeks. (A) shows CFUs from lung homogenates plated at 2 or 4 weeks post-infection. p-values were obtained with a Mann–Whitney statistical test. **p < 0.01. (B) shows lung pathology in the infected mice, with lung samples obtained from animals 2 weeks or 4 weeks post-infection, fixed, and processed for hematoxylin and eosin staining. Scale bar, 200 μm. (C and D) C6 decreases Mtb load in a longer-term infection model. C3HeB/FeJ WT mice were infected with Mtb and infection allowed to establish for 6 weeks. Mice were then mock treated or treated with 250 mg/kg C6 by oral gavage 5 days/week for 2 or 4 weeks (8 or 10 weeks total infection). Lungs were homogenized and plated for CFUs at indicated time points, shown in (C). p-values were determined by a Mann–Whitney statistical test on the mock versus circled C6-treated population. *p < 0.05. (D) shows lung pathology in infected mice, with lung samples obtained from animals 6, 8, or 10 weeks post-infection, fixed, and processed for hematoxylin and eosin staining. Scale bar, 200 μm. The numerical data underlying the graphs shown in this figure are provided in S1 Data. CFU, colony-forming unit; Mtb, Mycobacterium tuberculosis; WT, wild-type.

Similar articles

Cited by

References

    1. World Health Organization. Global tuberculosis report 2020. Available from: https://apps.who.int/iris/bitstream/handle/10665/336069/9789240013131-en... [cited 2021 Jun 4].
    1. Via LE, Lin PL, Ray SM, Carrillo J, Allen SS, Eum SY, et al.. Tuberculous granulomas are hypoxic in guinea pigs, rabbits, and nonhuman primates. Infect Immun. 2008;76(6):2333–40. doi: 10.1128/IAI.01515-07 - DOI - PMC - PubMed
    1. Harper J, Skerry C, Davis SL, Tasneen R, Weir M, Kramnik I, et al.. Mouse model of necrotic tuberculosis granulomas develops hypoxic lesions. J Infect Dis. 2012;205(4):595–602. doi: 10.1093/infdis/jir786 - DOI - PMC - PubMed
    1. Mattila JT, Ojo OO, Kepka-Lenhart D, Marino S, Kim JH, Eum SY, et al.. Microenvironments in tuberculous granulomas are delineated by distinct populations of macrophage subsets and expression of nitric oxide synthase and arginase isoforms. J Immunol. 2013;191(2):773–84. doi: 10.4049/jimmunol.1300113 - DOI - PMC - PubMed
    1. Lanoix JP, Ioerger T, Ormond A, Kaya F, Sacchettini J, Dartois V, et al.. Selective inactivity of pyrazinamide against tuberculosis in C3HeB/FeJ mice is best explained by neutral pH of caseum. Antimicrob Agents Chemother. 2016;60(2):735–43. doi: 10.1128/AAC.01370-15 - DOI - PMC - PubMed

Publication types