

Multidimensional analysis of immune responses identified biomarkers of recent Mycobacterium tuberculosis infection
- PMID: 34319988
- PMCID: PMC8351927
- DOI: 10.1371/journal.pcbi.1009197
Multidimensional analysis of immune responses identified biomarkers of recent Mycobacterium tuberculosis infection
Abstract
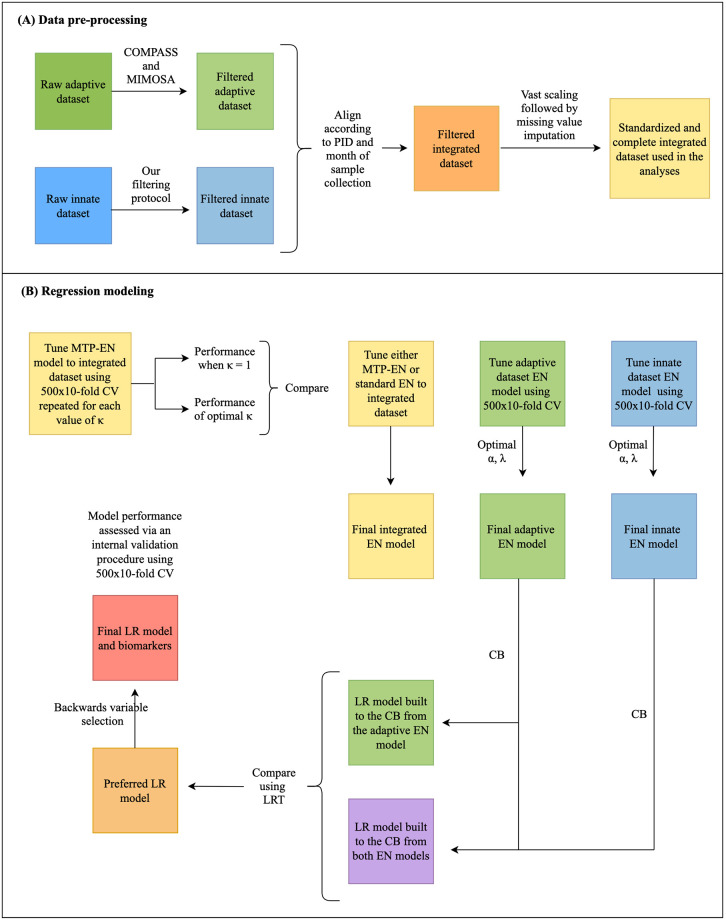
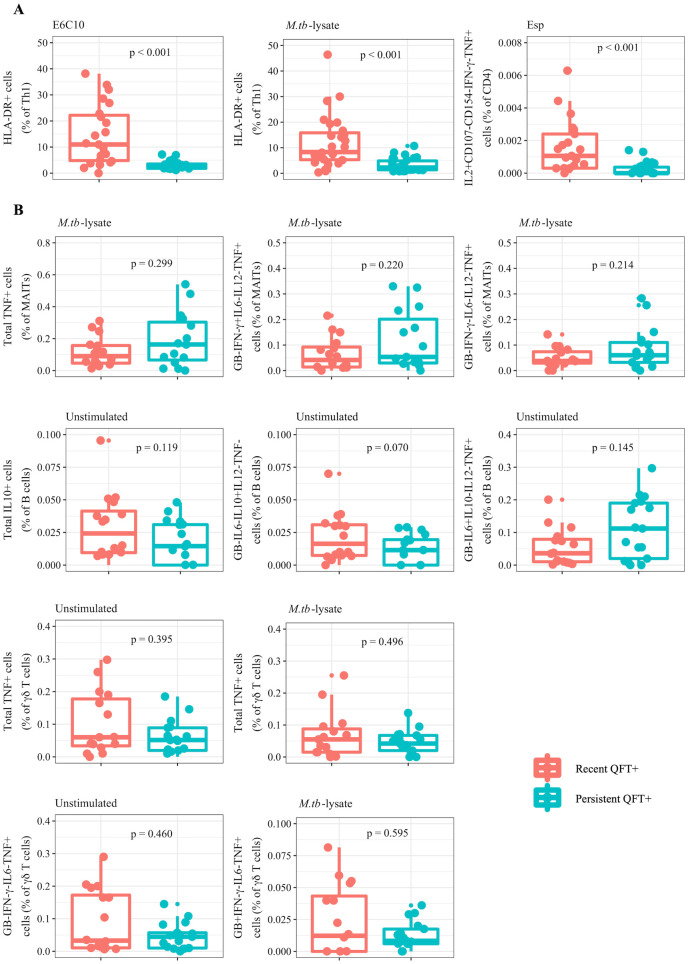
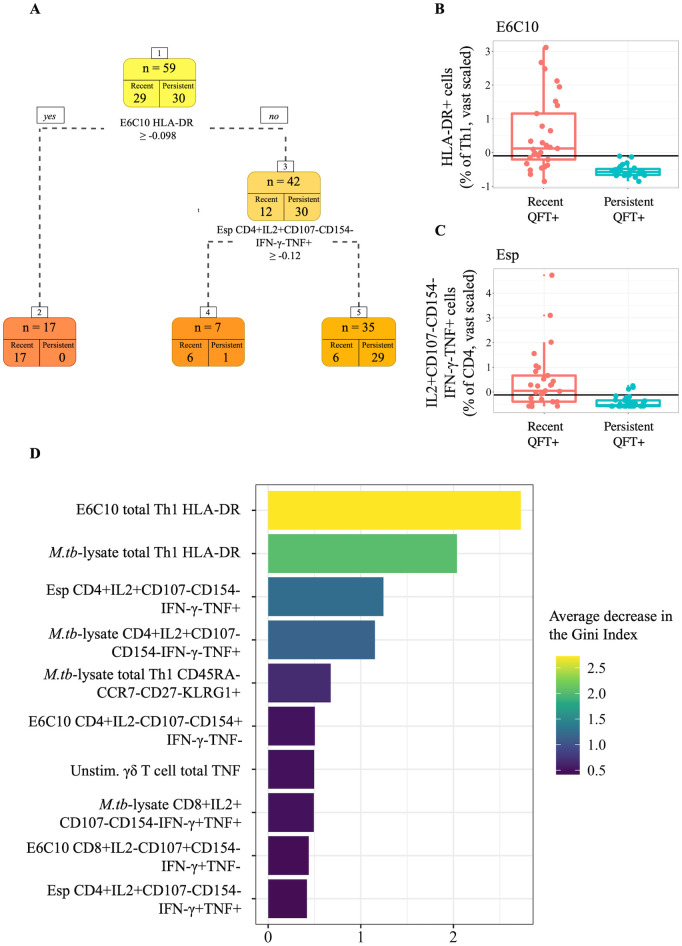
The risk of tuberculosis (TB) disease is higher in individuals with recent Mycobacterium tuberculosis (M.tb) infection compared to individuals with more remote, established infection. We aimed to define blood-based biomarkers to distinguish between recent and remote infection, which would allow targeting of recently infected individuals for preventive TB treatment. We hypothesized that integration of multiple immune measurements would outperform the diagnostic performance of a single biomarker. Analysis was performed on different components of the immune system, including adaptive and innate responses to mycobacteria, measured on recently and remotely M.tb infected adolescents. The datasets were standardized using variance stabilizing scaling and missing values were imputed using a multiple factor analysis-based approach. For data integration, we compared the performance of a Multiple Tuning Parameter Elastic Net (MTP-EN) to a standard EN model, which was built to the individual adaptive and innate datasets. Biomarkers with non-zero coefficients from the optimal single data EN models were then isolated to build logistic regression models. A decision tree and random forest model were used for statistical confirmation. We found no difference in the predictive performances of the optimal MTP-EN model and the EN model [average area under the receiver operating curve (AUROC) = 0.93]. EN models built to the integrated dataset and the adaptive dataset yielded identically high AUROC values (average AUROC = 0.91), while the innate data EN model performed poorly (average AUROC = 0.62). Results also indicated that integration of adaptive and innate biomarkers did not outperform the adaptive biomarkers alone (Likelihood Ratio Test χ2 = 6.09, p = 0.808). From a total of 193 variables, the level of HLA-DR on ESAT6/CFP10-specific Th1 cytokine-expressing CD4 cells was the strongest biomarker for recent M.tb infection. The discriminatory ability of this variable was confirmed in both tree-based models. A single biomarker measuring M.tb-specific T cell activation yielded excellent diagnostic potential to distinguish between recent and remote M.tb infection.
Conflict of interest statement
The authors have declared that no competing interests exist.
Figures
References
-
- WHO. Global Tuberculosis Report; 2020.
-
- Hoerl A, Kennard R. Ridge Regression. Encyclopaedia of Statistical Sciences. 1988;8:129–136.
-
- Tibshirani R. Regression shrinkage and selection via the LASSO. Journal of Royal Statistical Society. 1996;58(1):267–288.
Publication types
MeSH terms
Substances
Grants and funding
LinkOut - more resources
Full Text Sources
Medical
Research Materials
