. 2021 Aug 20;49(14):8097-8109.
doi: 10.1093/nar/gkab639.

Core promoter activity contributes to chromatin-based regulation of internal cryptic promoters

Affiliations

Core promoter activity contributes to chromatin-based regulation of internal cryptic promoters

Bo Bae Lee et al. Nucleic Acids Res. .

Abstract

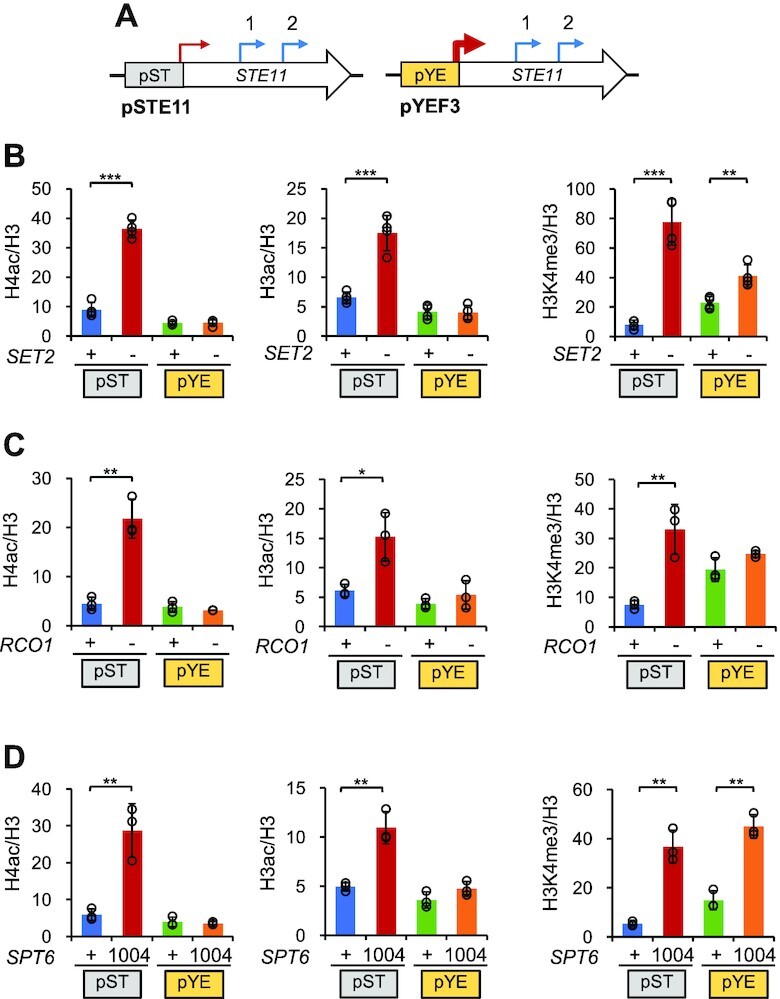
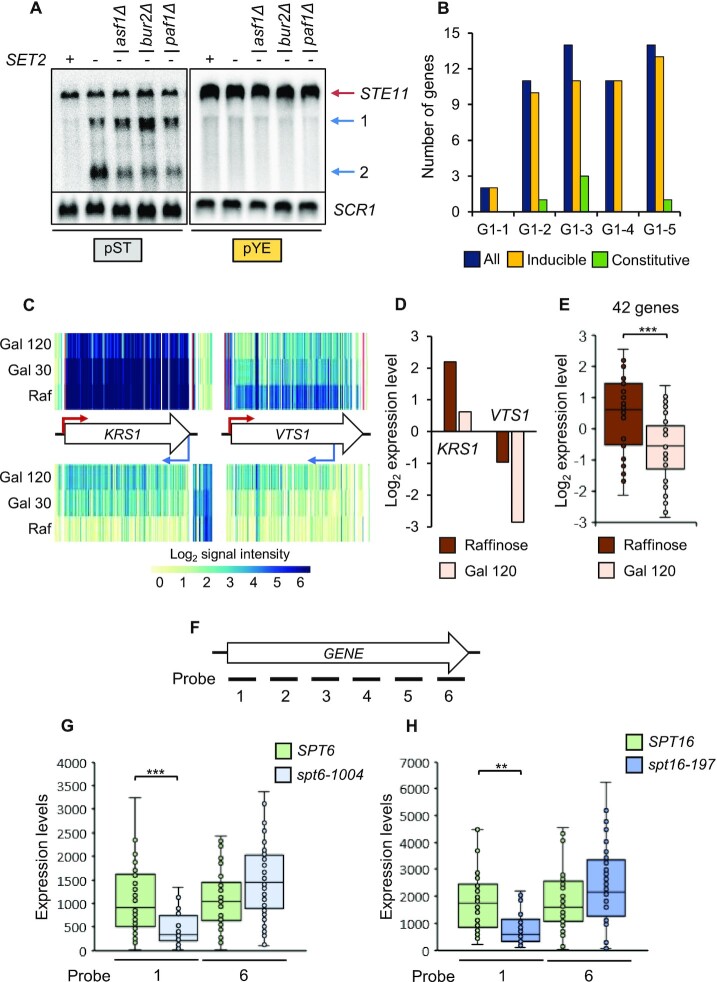
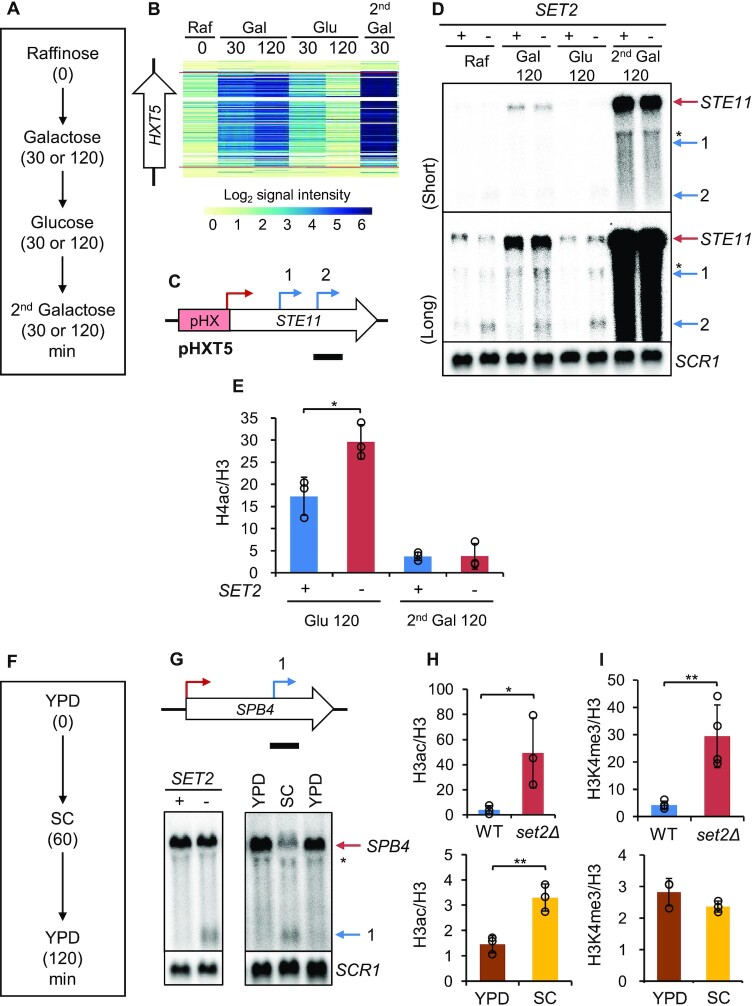
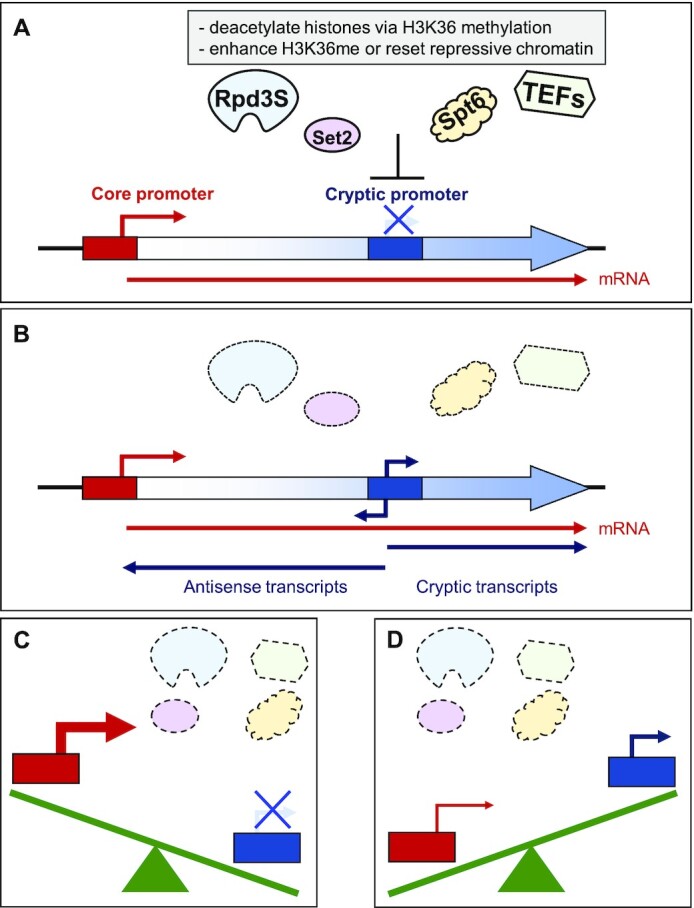
During RNA polymerase II (RNA Pol II) transcription, the chromatin structure undergoes dynamic changes, including opening and closing of the nucleosome to enhance transcription elongation and fidelity. These changes are mediated by transcription elongation factors, including Spt6, the FACT complex, and the Set2-Rpd3S HDAC pathway. These factors not only contribute to RNA Pol II elongation, reset the repressive chromatin structures after RNA Pol II has passed, thereby inhibiting aberrant transcription initiation from the internal cryptic promoters within gene bodies. Notably, the internal cryptic promoters of infrequently transcribed genes are sensitive to such chromatin-based regulation but those of hyperactive genes are not. To determine why, the weak core promoters of genes that generate cryptic transcripts in cells lacking transcription elongation factors (e.g. STE11) were replaced with those from more active genes. Interestingly, as core promoter activity increased, activation of internal cryptic promoter dropped. This associated with loss of active histone modifications at the internal cryptic promoter. Moreover, environmental changes and transcription elongation factor mutations that downregulated the core promoters of highly active genes concomitantly increased their cryptic transcription. We therefore propose that the chromatin-based regulation of internal cryptic promoters is mediated by core promoter strength as well as transcription elongation factors.


Figures

Figure 1.
Figure 1.
RNA Pol II transcription frequency correlates negatively with cryptic initiation. (A) Set2 suppresses the internal cryptic transcription of STE11, PCA1, and FLO8. The top images show schematic depictions of STE11, PCA1, and FLO8. The red arrow shows the core promoter while the blue arrows indicate the internal cryptic promoters that produce short cryptic transcripts when SET2 is deleted (bottom panels). The wild-type and set2Δ mutant cells were grown to an OD600 of ∼0.6 in YPD medium at 30°C and then subjected to northern blot analysis. Two independent experiments showed the same results. (B, C) The genes that produce cryptic transcripts in the set2Δ, spt6-1004 and spt16-197 mutants tend to have lower Rpb3 occupancy. (B) All yeast genes were divided into five groups based on their Rpb3 occupancy, as reported by Mayer et al. (33). The genes in each group that produced cryptic transcripts in set2Δ, spt6-1004 or spt16-197 were then counted. Total numbers of genes in each group are 1343. (C) The G1 group from (B) was subdivided into five groups on the basis of their Rpb3 occupancy. The genes that produced cryptic transcripts in each mutant were counted. While G1-1 and G1-2 include 268 genes, total numbers of genes for three other groups are 269. (D, E) Strong core promoter activity reduces cryptic initiation in SET2-deleted cells. (D) Schematic representation of the STE11 gene in which the original promoter (wild-type gene, pST-STE11, grey) was replaced by the promoter from two strongly transcribed genes (G1 group; YEF3 and SSE1) or a more weakly transcribed gene (G2 group; CYC1). These variants are respectively designated pYE-STE11 (yellow), pSS-STE11 (orange), and pCY-STE11 (violet). The red and blue arrows respectively indicate the core promoter and the STE11 internal cryptic promoters. The thickness of the red promoters indicates the transcriptional activity of the indicated core promoters. A bar underneath indicates the position of the probe used for northern blot analysis. (E) Wild-type and set2Δ cells with the indicated STE11 variants were grown as described in (A) and then subjected to northern blot analysis of the STE11 and cryptic transcripts. The red and blue arrows indicate the core and the internal cryptic promoters of STE11, respectively. The effect of long and short exposure time is shown. The asterisks indicate nonspecific bands. SCR1 was used as a loading control. Two independent experiments showed the same results.
Figure 2.
Figure 2.
Enhanced core promoter activity inhibits transcription from internal cryptic promoters in Set2-Rpd3S pathway or Spt6 mutants. (A, B) A strong (YEF3) but not weak (STE11) core promoter causes the growth in medium without histidine of SET2 deleting cells bearing a reporter construct composed of STE11 with HIS3 inserted just downstream of the second cryptic promoter. (A) Schematic representation of the STE11-HIS3 reporter constructs. A bar underneath indicates the position of the probe used for northern blot analysis. (B) The wild-type and set2Δ cells bearing the indicated reporter constructs were spotted in 3-fold serial dilutions onto plates with synthetic complete (SC) medium (2 days growth shown) or SC medium lacking histidine (3 days growth shown). (C, D) A strong promoter also blocks cryptic transcription from STE11 in rco1Δ (C) and spt6-1004 (D) cells. RCO1 and rco1Δ cells were grown as described in Figure 1A. SPT6 and spt6-1004 cells were grown to an OD600 of ∼0.6 in YPD at 30°C, after which half were shifted to 37°C for an additional 80 min. Northern blot analyses of STE11 were conducted as described in Figure 1A. Two independent experiments showed the same results. (E) The strong YEF3 promoter also inhibits cryptic transcription of PCA1, which has an inactive (G5) promoter. The top images show the PCA1 gene with its original weak promoter and with the YEF3 promoter. The bottom panels show the cryptic transcripts of PCA1 on northern blot analysis, which was conducted as described in Figure 1A. The red arrows indicate core promoters while the blue arrows depict the internal cryptic promoters. Two independent experiments showed the same results.
Figure 3.
Figure 3.
Core promoter activity shapes the histone modifications at internal cryptic promoters. (A) Schematic representation of pST-STE11 and pYE-STE11 strain. The STE11 and YEF3 promoters are shown in grey and yellow, respectively. The core and internal cryptic promoters are indicated by the red and blue arrows, respectively. (B–D) Effect of Set2-Rps3S HDAC pathway and Spt6 mutations on histone modifications at the STE11 internal cryptic promoter. Cross-linked chromatin from the indicated cells grown in YPD at 30°C was precipitated with anti-acetyl H4, anti-acetyl H3, anti-H3K4me3, or anti-H3 antibodies. The precipitated DNA was subjected to PCR analysis of the second internal cryptic promoter region of STE11. A non-transcribed region near the telomere of chromosome VI was used as an internal control. The signals for acetyl-H4, acetyl-H3, or H3K4me3 were quantitated and normalized to the H3 signal, and the ratios were graphed. Error bars show the standard deviation (S.D.) calculated from four or three biological replicates, each with three technical replicates. *P < 0.05, **P < 0.01, and ***P < 0.001 (two-tailed unpaired Student′s t tests).
Figure 4.
Figure 4.
Downregulation of the core promoter activity enhances cryptic transcription. (A) Deletion of various transcription elongation factors did not affect STE11 cryptic transcription in set2Δ cells that contained pYE-STE11. Northern blot analysis was conducted with the indicated cells as described in Figure 1A. Two independent experiments showed the same results. (B) Of the 52 G1 group genes with highly active core promoters that bear Set2-repressed internal cryptic promoters (Figure 1C), 47 had inducible cryptic promoters that were activated by galactose. The number of genes with inducible or constitutively active cryptic promoters are shown. (C) KRS1 and VTS1 are examples of genes with strong core promoters and inducible Set2-repressed internal cryptic promoters. The images show the microarray hybridization signals for the multiple probes arrayed along each gene (28) when set2Δ cells were cultured with raffinose or shifted to galactose for 30 or 120 min. Transcription from the core promoter (red arrow) is shown on top while antisense transcription from the cryptic promoter (blue arrow) is shown at the bottom. Increasing blue bars indicate more transcripts hybridizing to the array. The red lines show the annotated start and stop of the mRNA. The white box arrows show the position of the ORF. When set2Δ cells were exposed to galactose, KRS1/VTS1 transcription from the core promoter and the cryptic promoter was decreased and increased, respectively. (D) Expression level of these two genes at raffinose and galactose 120 min time point. (E) Boxplot showing that of the 47 genes with Set2-repressed galactose-inducible internal cryptic promoters (see B), 42 were downregulated by 120 min of galactose exposure. ***P < 0.001 (two-tailed unpaired Student′s t tests). (F–H) Downregulation of highly transcribed genes in G1 groups in mutants for Spt6 or Spt16. (F) Schematic representation of the microarray probe positions used to identify the cryptic promoters. Probes 1 and 6 are markers for mRNA transcription and cryptic transcription, respectively from Cheung et al. (21). (G, H) The microarray signals for cryptic transcripts (probe 6) were increased but the signals for mRNAs (probe 1) were decreased in spt6-1004 (G) and spt16-197 (H) cells. **P < 0.01, and ***P < 0.001 (two-tailed unpaired Student′s t tests).
Figure 5.
Figure 5.
Dynamic regulation of core and internal cryptic promoters upon environmental shifts. (A) Schematic representation of the time course experiments to monitor changes in transcript levels during carbon source shifts. (B) Expression of HXT5 in wild-type cells during carbon source shifts. Figure shows the changes in the microarray hybridization signals of the probes arrayed along the HXT5 gene (28) as the carbon sources changed. Increased blue color indicates more transcription. Note that HXT5 is hyperactivated upon the second galactose exposure. (C) Schematic representation of pHX-STE11. The core promoter of STE11 was replaced with that of HXT5. A black bar underneath indicates the position of the probe used for northern blot analysis. (D) Northern blot analysis showing that in set2Δ, the first and especially the second galactose exposures activated mRNA expression of STE11 but blocked its cryptic transcription. Two independent experiments showed the same results. (E) H4 acetylation patterns at the STE11 cryptic promoter during carbon source shifts. Cross-linked chromatin from the indicated cells grown as in (A) was precipitated with anti-acetyl H4 or anti-H3 antibodies. PCR analysis of the precipitated DNA was done as in Figure 3B. Error bars show the standard deviation (S.D.) calculated from three biological replicates, each with three technical replicates. *P < 0.05 (two-tailed unpaired Student′s t tests). (F–I) Effect of nutritional shifts on the mRNA and cryptic transcription of SPB4 and histone modification at the cryptic promoter of SPB4. (F) Schematic representation of the time course experiments to monitor changes in transcript levels during nutritional shifts. The cells were grown to an OD600 of ∼0.6 in YPD medium, shifted to SC for 60 min, and returned to YPD for 120 min. (G) Both loss of Set2 and nutritional shifting activated the internal cryptic promoter of SPB4. The upper panel shows a schematic representation of the core (red arrow) and internal cryptic (blue arow) promoters of SPB4. The bottom panels show the northern blot analysis of the set2Δ cells grown in YPD and the wild type cells before and after nutritional shifting. The full-length and cryptic transcripts of SPB4 are indicated by red and blue arrows, respectively. Two independent experiments showed the same results. (H, I) Histone modification patterns at the internal cryptic promoter of SPB4 in set2Δ cells grown in YPD and in wild type cells during the nutritional shift from YPD to SC. Cross-linked chromatin from the indicated cells was precipitated with anti-acetyl H3, anti-H3, and anti-H3K4me3 antibodies. PCR analysis of the precipitated DNA was performed as in Figure 3B. Error bars show the standard deviation (S.D.) calculated from three or four biological replicates, each with three technical replicates. *P < 0.05, and **P < 0.01 (two-tailed unpaired Student′s t tests).
Figure 6.
Figure 6.
Models for regulation of internal cryptic promoters by core promoter activity. (AB) In wild-type cells, transcription elongation factors such as the Set2-Rpd3S pathway and Spt6 negatively regulate the transcription from internal cryptic promoters. Set2 methylates K36 of histone H3 and the resulting methylation enhances Rpd3S HDAC-mediated histone deacetylation. Transcription elongation factors including Spt6 stimulate H3K36 methylation by Set2. When these factors are lost, the gene bodies acquire increased acetylation or abnormal chromatin structure, which activates the internal cryptic promoters. These promoters then produce short sense or antisense transcripts. (C) However, internal cryptic promoters can be repressed even in the absence of these transcription elongation factors if the core promoter is hyperactive. (D) The loss of transcription elongation factors, Spt6 and Spt16 downregulates the core promoter activity resulting in activation of the internal cryptic promoter. Environmental shifts also can reduce the core promoter activity resulting in transient activation of transcription from the internal cryptic promoter. The red and blue rectangles indicate the core promoter and the internal cryptic promoter, respectively.

Similar articles

Cited by

References

    1. Kouzarides T.Chromatin modifications and their function. Cell. 2007; 128:693–705. - PubMed
    1. Li B., Carey M., Workman J.L.. The role of chromatin during transcription. Cell. 2007; 128:707–719. - PubMed
    1. Woo H., Dam Ha S., Lee S.B., Buratowski S., Kim T.. Modulation of gene expression dynamics by co-transcriptional histone methylations. Exp. Mol. Med. 2017; 49:e326. - PMC - PubMed
    1. Kizer K.O., Phatnani H.P., Shibata Y., Hall H., Greenleaf A.L., Strahl B.D.. A novel domain in Set2 mediates RNA polymerase II interaction and couples histone H3 K36 methylation with transcript elongation. Mol. Cell. Biol. 2005; 25:3305–3316. - PMC - PubMed
    1. Krogan N.J., Kim M., Tong A., Golshani A., Cagney G., Canadien V., Richards D.P., Beattie B.K., Emili A., Boone C.et al. .. Methylation of histone H3 by Set2 in Saccharomyces cerevisiae is linked to transcriptional elongation by RNA polymerase II. Mol. Cell. Biol. 2003; 23:4207–4218. - PMC - PubMed

Publication types

MeSH terms