. 2021 Sep 7;49(15):8505-8519.
doi: 10.1093/nar/gkab632.

RCA2: a scalable supervised clustering algorithm that reduces batch effects in scRNA-seq data

Affiliations

RCA2: a scalable supervised clustering algorithm that reduces batch effects in scRNA-seq data

Florian Schmidt et al. Nucleic Acids Res. .

Abstract

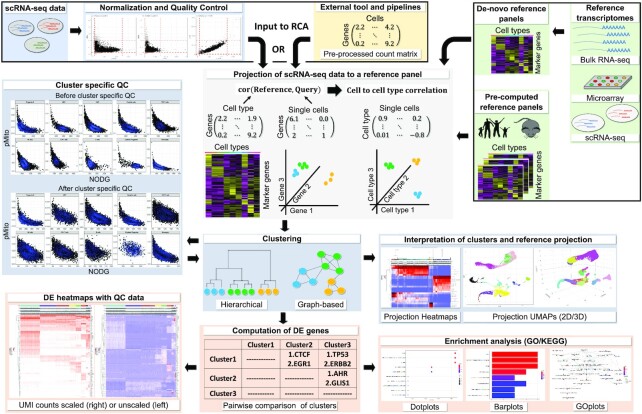
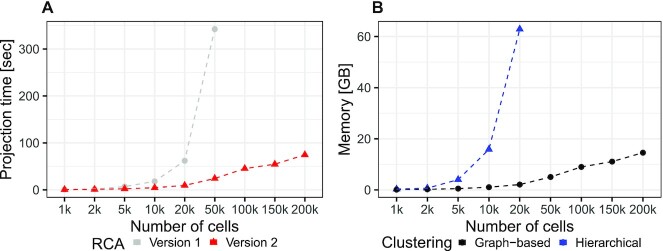
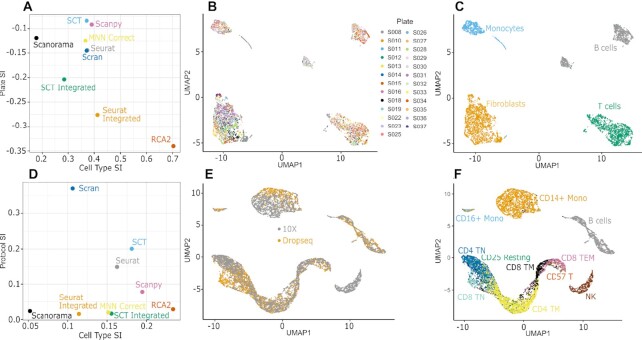
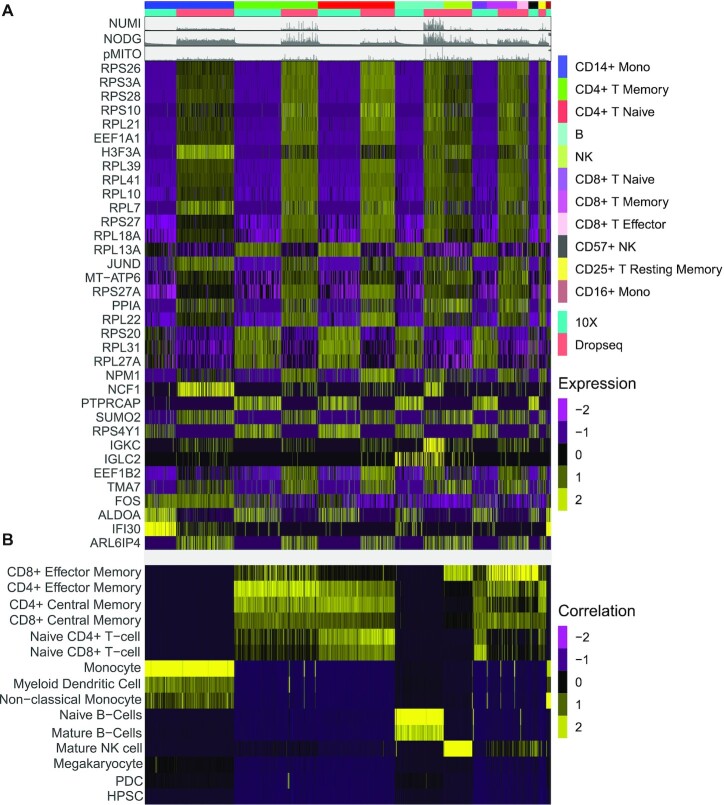
The transcriptomic diversity of cell types in the human body can be analysed in unprecedented detail using single cell (SC) technologies. Unsupervised clustering of SC transcriptomes, which is the default technique for defining cell types, is prone to group cells by technical, rather than biological, variation. Compared to de-novo (unsupervised) clustering, we demonstrate using multiple benchmarks that supervised clustering, which uses reference transcriptomes as a guide, is robust to batch effects and data quality artifacts. Here, we present RCA2, the first algorithm to combine reference projection (batch effect robustness) with graph-based clustering (scalability). In addition, RCA2 provides a user-friendly framework incorporating multiple commonly used downstream analysis modules. RCA2 also provides new reference panels for human and mouse and supports generation of custom panels. Furthermore, RCA2 facilitates cell type-specific QC, which is essential for accurate clustering of data from heterogeneous tissues. We demonstrate the advantages of RCA2 on SC data from human bone marrow, healthy PBMCs and PBMCs from COVID-19 patients. Scalable supervised clustering methods such as RCA2 will facilitate unified analysis of cohort-scale SC datasets.


Figures

Figure 1.
Figure 1.
RCA2 takes two types of scRNA-seq data as input: (i) CellRanger output files and (ii) data preprocessed elsewhere, which can be loaded as a gene × cell count matrix. Reference datasets in RCA2 for human and mouse are based on bulk RNA-seq, microarray and scRNA-seq assays. RCA2 can also generate custom reference panels from user-supplied raw count matrices. RCA2 computes a correlation matrix representing the similarity of each SC transcriptome to each reference transcriptome. Correlations are calculated using marker (DE) genes from the reference panel. Cells are clustered and visualized in the space of reference projections. After DE gene analysis, enriched GO terms and KEGG pathways can be identified.
Figure 2.
Figure 2.
(A) Speedup of the reference projection step. (B) Memory consumption of graph-based clustering compared to hierarchical clustering. Benchmarking was performed with a notebook using an Intel i9-9980 CPU(2.40 GHz) and 64GB RAM. Projecting using RCAv1 and hierarchical clustering ran out of memory using 100k cells and 50k cells, respectively.
Figure 3.
Figure 3.
(A) Silhouette Index (SI) measuring separation of cells in RA data by plate and cell type. (B, C) UMAP visualization of RCA2 clustering of RA data colored by (B) plate and (C) cell type. (D) SI measuring separation of cells in CITE-Seq data by protocol and cell type. (E, F) UMAP visualization of RCA2 clustering of CITE-Seq data colored by (E) protocol and (F) cell type.
Figure 4.
Figure 4.
(A) Expression of DEG computed for sequencing protocol batch within ADT clusters. (B) Reference projection of the CITE-seq data against RCA2’s global panel.
Figure 5.
Figure 5.
(A) Cluster-specific QC based on NODG and pMito. Colors indicates whether cells are discarded (red, blue) or retained (black) if general, cluster-unspecific QC would be used. (B) Proportions of cells discarded per cell type using cluster unspecific QC. (C) UMAP reduction of a multi panel RCA2 projection coloured by cell type using a resolution of 0.5.
Figure 6.
Figure 6.
(A) UMAP shows the RCA2 clustering of cells from the COVID-19 study by Wilk et al. (B) The location of developing neutrophils annotated by Wilk et al. are marked as red dots in the RCA2 UMAP. (C) Bubble plot shows the marker gene expression levels across the cell types shown in a. Bubble size indicates expression percentage within each cell type, while color intensity represents scaled expression levels. (D) UMAP plot showing the cell clustering using the de-novo analysis pipeline and cell-type annotation by Wilk et al. (E) UMAPs showing marker gene expression and data quality. Markers are shown for developing neutrophils (CEACAM8, LTF, ELANE), plasmablasts (CD38), red blood cells (HBB), T cells (CD4, CD3D), B cells (CD20), NK and cytotoxic T cells (GZMA, NKG7). Number of detected genes (NODG, orange) is shown as a measure of cell quality and debris-like cells that co-express markers of diverse cell types are indicated in red.
Figure 7.
Figure 7.
(A) UMAP embedding of a reference projection for the COVID-19 PBMC data set from (17). (B) UMAP embedding of a reference projection for the AML dataset 809653 from (29). AML and control cells are well separated in reference space.

References

    1. Tang F., Barbacioru C., Wang Y., Nordman E., Lee C., Xu N., Wang X., Bodeau J., Tuch B.B., Siddiqui A.et al. .. mRNA-Seq whole-transcriptome analysis of a single cell. Nat. Methods. 2009; 6:377–382. - PubMed
    1. Editorial Method of the year 2013. Nat. Methods. 2014; 11:1. - PubMed
    1. Lawson D.A., Kessenbrock K., Davis R.T., Pervolarakis N., Werb Z.. Tumour heterogeneity and metastasis at single-cell resolution. Nat. Cell Biol. 2018; 20:1349–1360. - PMC - PubMed
    1. Kiselev V.Y., Andrews T.S., Hemberg M.. Challenges in unsupervised clustering of single-cell RNA-seq data. Nat. Rev. Genet. 2019; 20:273–282. - PubMed
    1. Li H., Courtois E.T., Sengupta D., Tan Y., Chen K.H., Goh J. J.L., Kong S.L., Chua C., Hon L.K., Tan W.S.et al. .. Nat GenetReference component analysis of single-cell transcriptomes elucidates cellular heterogeneity in human colorectal tumors. Nat. Genet. 2017; 49:708–718. - PubMed

Publication types

MeSH terms

Substances