

Impact of the 2008 Recession on Wealth-Adjusted Income and Inequality for U.S. Cohorts
- PMID: 34320206
- PMCID: PMC9122750
- DOI: 10.1093/geronb/gbab141
Impact of the 2008 Recession on Wealth-Adjusted Income and Inequality for U.S. Cohorts
Abstract
Objective: To examine the distributional effects of the 2008 recession and subsequent recovery across generational cohorts.
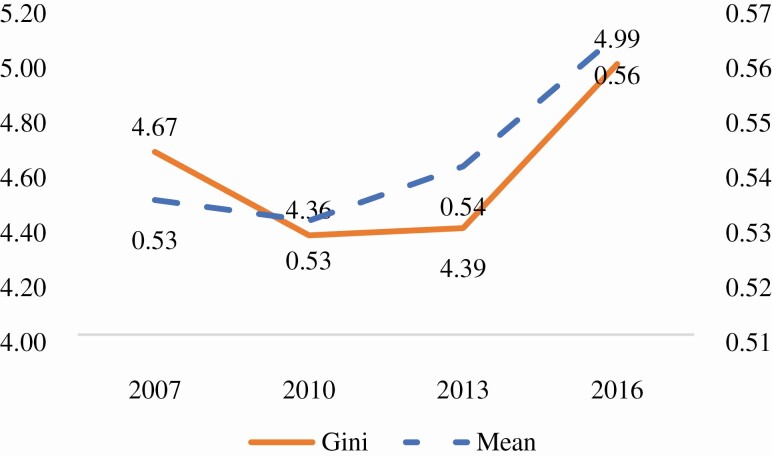
Methods: Using data from the Survey of Consumer Finances (2007-2016), we constructed a measure of economic well-being accounting for income, household size, and annuitized value of assets. We examine trajectories of adjusted income and inequality, using Gini coefficients and income shares by decile, for the overall population and by cohort during the recession and recovery.
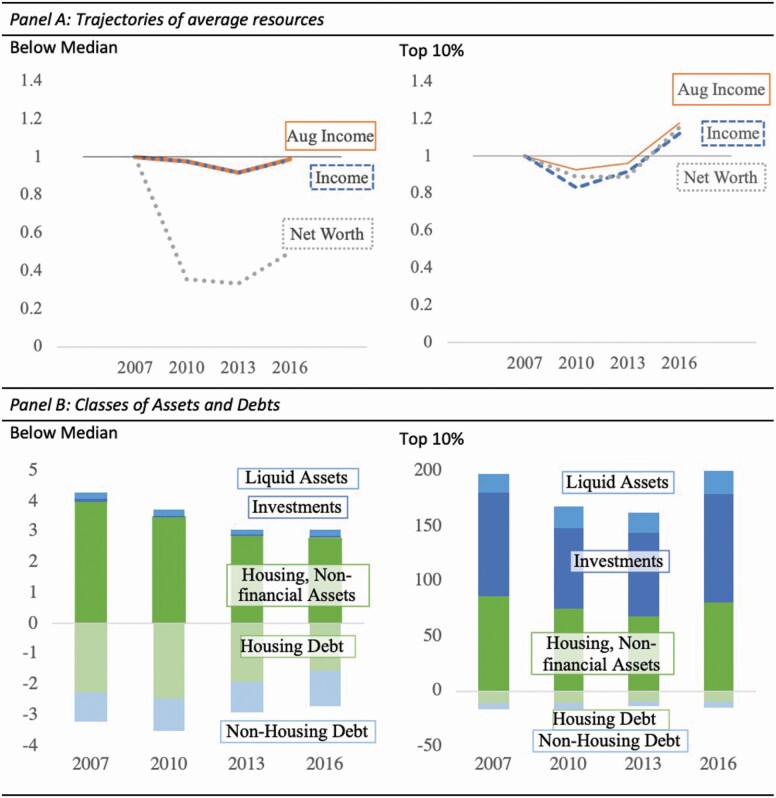
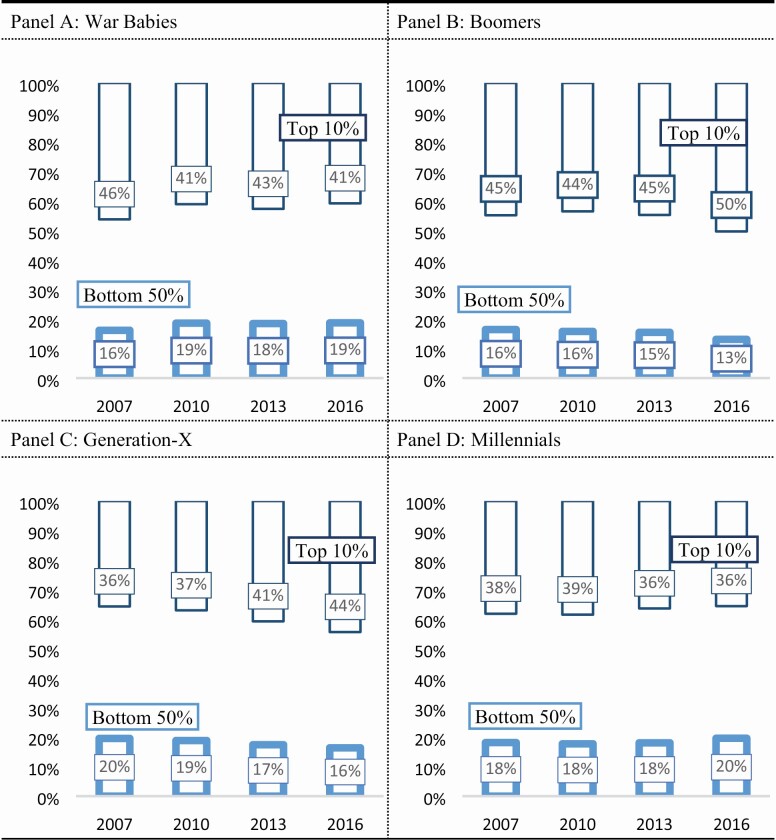
Results: Inequality declined temporarily during the recession, but reached new highs during the recovery. During recovery, population-level increases in economic resources were not reflected among below-median households, as the more concentrated financial assets rose while broader-based home equity and employment fell or remained stagnant. Inequality measures increased for cohorts in their primary working years (Generation-X and Baby Boomers), but not among the younger Millennials, who were at early stages of education, workforce entry, and household formation.
Discussion: The study illustrates an integrative approach to analyzing cumulative dis/advantage by considering interactions between historically consistent macrolevel events, such as economic shocks or policy choices affecting all cohorts, and the persistent life-course processes that tend to increase heterogeneity and inequality as cohorts age over time. Although recovery policies led to rapid recovery of financial asset values, they did not proportionately reach those below the median or their economic resource types. Results suggest that in a high-inequality environment, recovery policies from economic shocks may need tailoring to all levels of resources in order to achieve more equitable recovery outcomes and prevent exacerbating cohort inequality trajectories.
Keywords: Generational outcomes; Wealth distribution trends; Wealth inequality.
© The Author(s) 2021. Published by Oxford University Press on behalf of The Gerontological Society of America. All rights reserved. For permissions, please e-mail: journals.permissions@oup.com.
Figures
Similar articles
-
Cumulative Advantage, Cumulative Disadvantage, and Evolving Patterns of Late-Life Inequality.Gerontologist. 2017 Oct 1;57(5):910-920. doi: 10.1093/geront/gnw056. Gerontologist. 2017. PMID: 27030008 Free PMC article.
-
Binge alcohol and substance use across birth cohorts and the global financial crisis in the United States.PLoS One. 2018 Jun 25;13(6):e0199741. doi: 10.1371/journal.pone.0199741. eCollection 2018. PLoS One. 2018. PMID: 29940033 Free PMC article.
-
Assets among low-income families in the Great Recession.PLoS One. 2018 Feb 5;13(2):e0192370. doi: 10.1371/journal.pone.0192370. eCollection 2018. PLoS One. 2018. PMID: 29401482 Free PMC article.
-
Gini index decomposition by deprivation in multidimensional poverty: evidence from Chad.Gac Sanit. 2023 Apr 1;37:102299. doi: 10.1016/j.gaceta.2023.102299. eCollection 2023. Gac Sanit. 2023. PMID: 37011546 Review.
-
See, seek, support: a policy framework to uplift first-generation low-income medical professionals.J Public Health Policy. 2023 Dec;44(4):685-694. doi: 10.1057/s41271-023-00445-2. Epub 2023 Oct 26. J Public Health Policy. 2023. PMID: 37884675 Review.
Cited by
-
Enhancing Diversity, Equity, and Inclusion in Quantitative Studies of Age and Life Course.J Gerontol B Psychol Sci Soc Sci. 2023 Oct 9;78(10):1702-1706. doi: 10.1093/geronb/gbad096. J Gerontol B Psychol Sci Soc Sci. 2023. PMID: 37667651 Free PMC article. No abstract available.
-
Cohort Trends in the Burden of Multiple Chronic Conditions Among Aging U.S. Adults.J Gerontol B Psychol Sci Soc Sci. 2022 Oct 6;77(10):1867-1879. doi: 10.1093/geronb/gbac070. J Gerontol B Psychol Sci Soc Sci. 2022. PMID: 35642746 Free PMC article.
-
Enhancing Diversity, Equity, and Inclusion in Quantitative Studies of Age and Life Course.Gerontologist. 2024 Feb 1;64(2):gnad075. doi: 10.1093/geront/gnad075. Gerontologist. 2024. PMID: 37667657 Free PMC article. No abstract available.
-
Enhancing Diversity, Equity, and Inclusion in Quantitative Studies of Age and Life Course.J Gerontol A Biol Sci Med Sci. 2023 Oct 28;78(11):2019-2023. doi: 10.1093/gerona/glad151. J Gerontol A Biol Sci Med Sci. 2023. PMID: 37670440 Free PMC article. No abstract available.
-
Enhancing Diversity, Equity, and Inclusion in Quantitative Studies of Age and Life Course.Innov Aging. 2023 Sep 5;7(6):igad059. doi: 10.1093/geroni/igad059. eCollection 2023. Innov Aging. 2023. PMID: 37675245 Free PMC article. No abstract available.
References
-
- Assistant Secretary for Planning and Evaluation . (2016). Computations for the 2016 poverty guidelines.Office of the Assistant Secretary for Planning and Evaluation. https://aspe.hhs.gov/computations-2016-poverty-guidelines
-
- Barofsky, N. (2013). Bailout: How Washington abandoned main street while rescuing wall street. Simon and Schuster.
-
- Blotevogel, R., Imamoglu, E., Moriyama, K., & Sarr, B. (2020). Measuring income inequality and implications for economic transmission channels (No. 2020/164; IMF Working Papers). International Monetary Fund.
-
- Bricker, J., Henriques, A., Krimmel, J., & Sabelhaus, J. (2016). Estimating top income and wealth shares: Sensitivity to data and methods. American Economic Review, 106(5), 641–645. doi:10.1257/aer.p20161020 - DOI
-
- Calem, P. S., Gillen, K., & Wachter, S. (2004). The neighborhood distribution of subprime mortgage lending. The Journal of Real Estate Finance and Economics, 29(4), 393–410. doi:10.1023/B:REAL.0000044020.67401.51 - DOI
