

Dietary Patterns and Years Living in the United States by Hispanic/Latino Heritage in the Hispanic Community Health Study/Study of Latinos (HCHS/SOL)
- PMID: 34320207
- PMCID: PMC8417926
- DOI: 10.1093/jn/nxab165
Dietary Patterns and Years Living in the United States by Hispanic/Latino Heritage in the Hispanic Community Health Study/Study of Latinos (HCHS/SOL)
Abstract
Background: Previous diet findings in Hispanics/Latinos rarely reflect differences in commonly consumed and culturally relevant foods across heritage groups and by years lived in the United States.
Objectives: We aimed to identify and compare a posteriori heritage-specific dietary patterns (DPs) and evaluate their associations with "healthfulness" [using the Alternative Healthy Eating Index-2010 (AHEI-2010)] and years living in the United States.
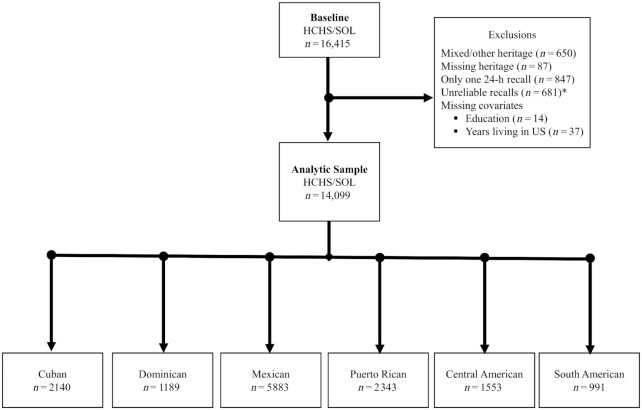
Methods: We used baseline data from a population-based cohort of 14,099 Hispanics/Latinos aged 18-74 y in the Hispanic Community Health Study/Study of Latinos. We performed principal factor analysis using two 24-h recalls to derive DPs, separately, in each heritage group (Cuban, Dominican, Mexican, Puerto Rican, Central American, and South American), and identified overarching DPs based on high-loading foods shared by ≥2 groups. We used multivariable linear regression to test associations of DPs with AHEI-2010 and years living in the United States.
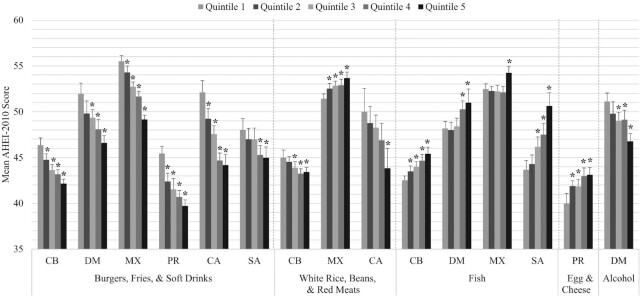
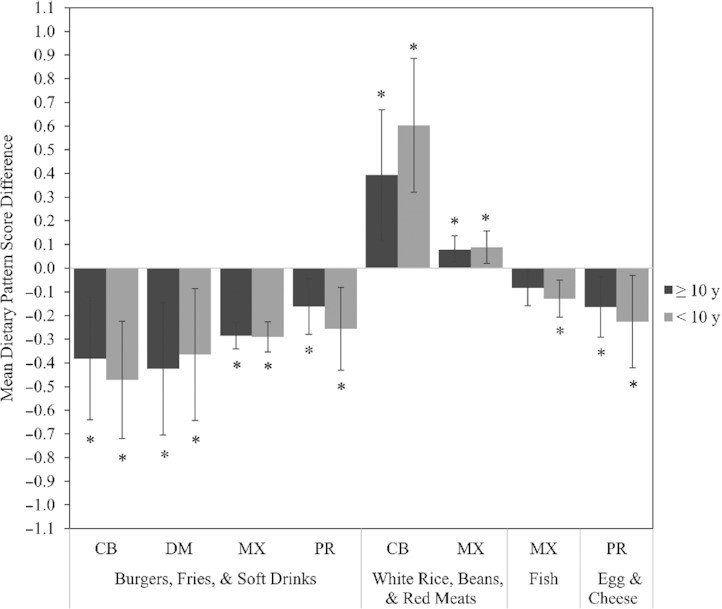
Results: We identified 5 overarching DPs (Burgers, Fries, & Soft Drinks; White Rice, Beans, & Red Meats; Fish; Egg & Cheese; and Alcohol). All Burgers, Fries, & Soft Drinks DPs were inversely associated with AHEI-2010, whereas all Fish DPs (except Dominican) were positively associated with this index (all P-trend < 0.001). White Rice, Beans, & Red Meats DPs showed inverse associations in Cuban and Central American groups and positive associations in Mexican-origin individuals (all P-trend < 0.001). Fewer years living in the United States was associated with higher scores for White Rice, Beans, & Red Meats DPs in Cuban and Mexican heritage groups and lower scores on Burgers, Fries, & Soft Drinks DPs in Cuban, Mexican, and Puerto Rican groups (all P-trend < 0.01).
Conclusions: Our findings show substantial variation in DPs across Hispanics/Latinos and adherence to DPs by time in the United States, which could inform dietary interventions targeting this diverse US population. This trial was registered at clinicaltrials.gov as NCT02060344.
Keywords: HCHS/SOL; Hispanics/Latinos; a posteriori; diet; dietary acculturation; dietary patterns; heritage; nativity; principal factor analysis.
Published by Oxford University Press on behalf of the American Society for Nutrition 2021.
Figures
Comment in
-
Dietary Patterns in Latinx Groups.J Nutr. 2021 Sep 4;151(9):2505-2506. doi: 10.1093/jn/nxab225. J Nutr. 2021. PMID: 34320184 No abstract available.
Similar articles
-
A Posteriori dietary patterns, insulin resistance, and diabetes risk by Hispanic/Latino heritage in the HCHS/SOL cohort.Nutr Diabetes. 2022 Oct 13;12(1):44. doi: 10.1038/s41387-022-00221-3. Nutr Diabetes. 2022. PMID: 36229451 Free PMC article.
-
Identifying and characterizing shared and ethnic background site-specific dietary patterns in the Hispanic Community Health Study/Study of Latinos (HCHS/SOL).Nutr J. 2025 May 4;24(1):71. doi: 10.1186/s12937-025-01138-0. Nutr J. 2025. PMID: 40320535 Free PMC article.
-
Healthy dietary patterns and risk of cardiovascular disease in US Hispanics/Latinos: the Hispanic Community Health Study/Study of Latinos (HCHS/SOL).Am J Clin Nutr. 2022 Oct 6;116(4):920-927. doi: 10.1093/ajcn/nqac199. Am J Clin Nutr. 2022. PMID: 36041183 Free PMC article.
-
A research framework for cognitive aging and Alzheimer's disease among diverse US Latinos: Design and implementation of the Hispanic Community Health Study/Study of Latinos-Investigation of Neurocognitive Aging (SOL-INCA).Alzheimers Dement. 2019 Dec;15(12):1624-1632. doi: 10.1016/j.jalz.2019.08.192. Epub 2019 Nov 20. Alzheimers Dement. 2019. PMID: 31759880 Free PMC article. Review.
-
Challenges in preventing heart disease in hispanics: early lessons learned from the Hispanic Community Health Study/Study of Latinos (HCHS/SOL).Prog Cardiovasc Dis. 2014 Nov-Dec;57(3):253-61. doi: 10.1016/j.pcad.2014.08.004. Epub 2014 Aug 13. Prog Cardiovasc Dis. 2014. PMID: 25212986 Free PMC article. Review.
Cited by
-
Developing a Diet and Physical Activity Intervention for Hispanic/Latina Breast Cancer Survivors.Cancer Control. 2022 Jan-Dec;29:10732748221133987. doi: 10.1177/10732748221133987. Cancer Control. 2022. PMID: 36254717 Free PMC article.
-
Consumption of folic acid fortified foods among Hispanic women of reproductive age in the US: a systematic review.BMC Public Health. 2025 Apr 9;25(1):1334. doi: 10.1186/s12889-025-22407-x. BMC Public Health. 2025. PMID: 40205388 Free PMC article.
-
Residence in Hispanic/Latino Immigrant Neighborhoods, Away-From-Home Food Consumption, and Diet Quality: The Hispanic Community Health Study/Study of Latinos.J Acad Nutr Diet. 2023 Nov;123(11):1596-1605.e2. doi: 10.1016/j.jand.2023.06.283. Epub 2023 Jun 22. J Acad Nutr Diet. 2023. PMID: 37355040 Free PMC article.
-
A better diet quality based on the Healthy Eating Index-2020 is associated with lower energy intake and age but not with a pre-diabetes/T2DM diagnosis among Hispanic women with overweight/obesity.Nutr Res. 2025 Feb;134:88-98. doi: 10.1016/j.nutres.2025.01.002. Epub 2025 Jan 7. Nutr Res. 2025. PMID: 39874721
-
Nosotros mismos nos estamos matando/We are the ones killing ourselves: Unraveling individual and network characteristics associated with negative dietary acculturation among Mexican Americans in New York City.Appetite. 2023 May 1;184:106488. doi: 10.1016/j.appet.2023.106488. Epub 2023 Feb 10. Appetite. 2023. PMID: 36773672 Free PMC article.
References
-
- US Census Bureau. QuickFacts: United States. 2019[Internet]. [cited 17, February 17, 2020]. Available from: https://www.census.gov/quickfacts/fact/table/US#.
-
- González Burchard E, Borrell LN, Choudhry S, Naqvi M, Tsai H-J, Rodriguez-Santana JR, Chapela R, Rogers SD, Mei R, Rodriguez-Cintron W. Latino populations: a unique opportunity for the study of race, genetics, and social environment in epidemiological research. Am J Public Health. 2005;95(12):2161–8. - PMC - PubMed
-
- Vespa J, Medina L, Armstrong DM. Demographic turning points for the United States: population projections for 2020 to 2060. Washington (DC): US Census Bureau; 2020.
Publication types
MeSH terms
Associated data
Grants and funding
LinkOut - more resources
Full Text Sources
Medical
