. 2021 Oct;51(10):2522-2530.
doi: 10.1002/eji.202048934. Epub 2021 Aug 8.

Chimeric antigen receptor-modified human regulatory T cells that constitutively express IL-10 maintain their phenotype and are potently suppressive

Affiliations

Chimeric antigen receptor-modified human regulatory T cells that constitutively express IL-10 maintain their phenotype and are potently suppressive

Yasmin R Mohseni et al. Eur J Immunol. 2021 Oct.

Abstract

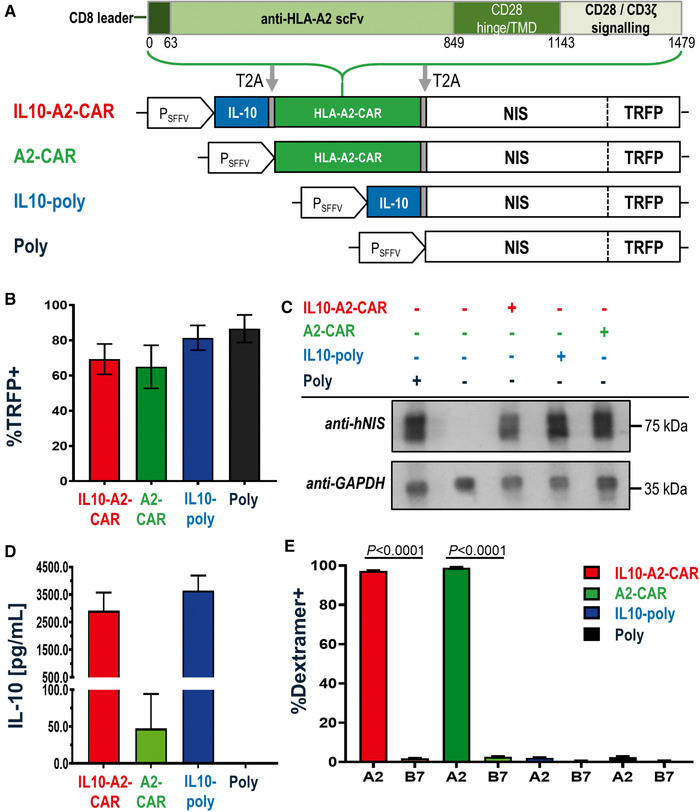
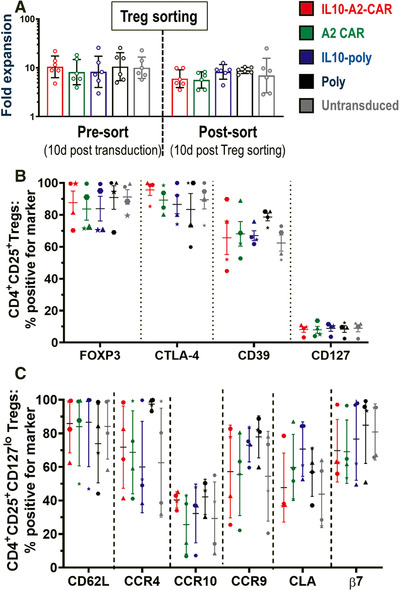
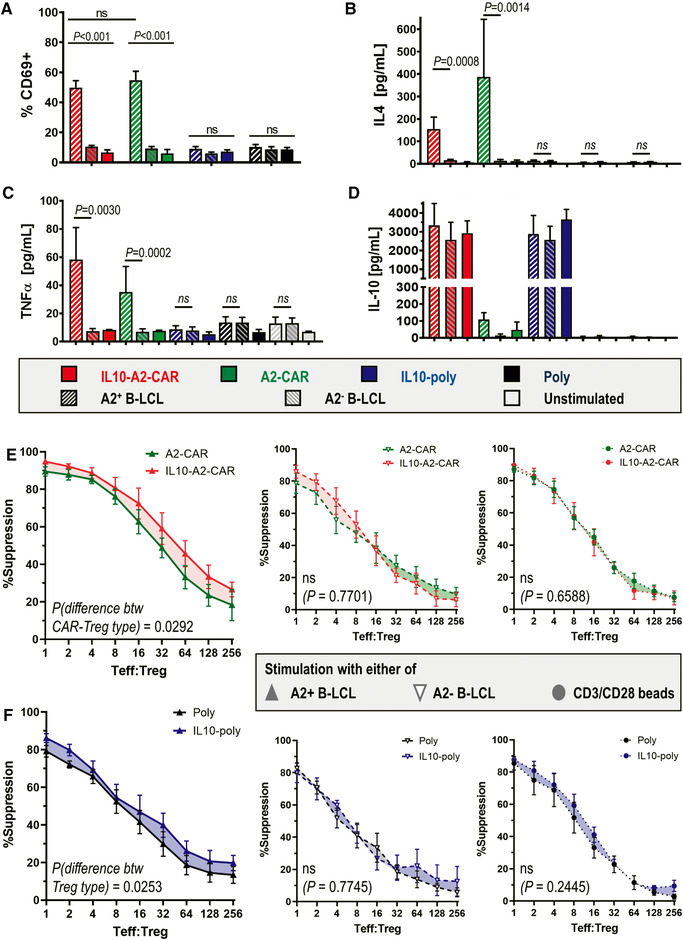
Clinical trials of Treg therapy in transplantation are currently entering phases IIa and IIb, with the majority of these employing polyclonal Treg populations that harbor a broad specificity. Enhancing Treg specificity is possible with the use of chimeric antigen receptors (CARs), which can be customized to respond to a specific human leukocyte antigen (HLA). In this study, we build on our previous work in the development of HLA-A2 CAR-Tregs by further equipping cells with the constitutive expression of interleukin 10 (IL-10) and an imaging reporter as additional payloads. Cells were engineered to express combinations of these domains and assessed for phenotype and function. Cells expressing the full construct maintained a stable phenotype after transduction, were specifically activated by HLA-A2, and suppressed alloresponses potently. The addition of IL-10 provided an additional advantage to suppressive capacity. This study therefore provides an important proof-of-principle for this cell engineering approach for next-generation Treg therapy in transplantation.

Keywords: Cell therapy; Chimeric antigen receptor; IL-10; Regulatory T cell; Suppression.


Conflict of interest statement

GL and RIL are stakeholders of Quell Tx Ltd while YRM and SLT have been employed by Quell Tx Ltd after completing practical work leading to this manuscript. The other authors declare no commercial or financial conflict of interest.

Figures

Figure 1
Figure 1
Generation of different human Treg types. (A) Cartoon of lentiviral expression constructs used in this study. Indicated elements are as follows: interleukin‐10 (IL‐10); CAR specific to the human HLA‐A2 antigen (HLA‐A2‐CAR); radionuclide‐fluorescence reporter formed of the sodium iodide symporter (NIS) fused to the red fluorescent protein TagRFP (NIS‐TRFP). All constructs were joined with T2A cleavage self‐cleavage sites and the cassette was driven by the spleen foci‐forming virus promoter (PSFFV). The total ORF lengths were 4.8, 4.2, 3, and 2.7 kb, respectively. Required regions in the lentiviral backbone including the PSFFV promotor added 3.8 kb to each construct to form the complete gene transfer cassette. (B) Percentage of TRFP‐positive Tregs upon harvest at day 20 and measured by flow cytometry. (C) Representative immunoblot of indicated Tregs. Expected patterns for glycosylated and nonglycosylated NIS‐RFP were observed in transduced cells with GAPDH as a loading control. Representative data from the one of three experiments (same donor) are shown. See Supporting Information Fig. S11 for uncropped immunoblot. (D) IL‐10 analysis of Treg culture supernatant on day 20 by ELISA. (E) HLA‐A2‐specific and HLA‐B7 ("irrelevant") dextramers were used to quantify CAR surface expression on day 20 by flow cytometry. Data show means of n = 6 (B, E) or n = 3 (D) donors, with one donor per experiment; error bars are mean ± SEM. p‐Values calculated by comparing A2 and B7 conditions for each cell type using an unpaired Student's t‐test.
Figure 2
Figure 2
Expansion capacity and phenotypes of differently transduced Tregs. (A) Expansion capacity of indicated Treg types after transduction (days 0–10; left) and after FACS sorting (days 10–20; right) and compared to mock‐treated untransduced cells (gray). Geometric means and SD of n = 6 different Treg batches (different donors, one donor per experiment) are shown. No significant differences were found between Treg types neither before (p = 0.9840) nor after FACS sorting (p = 0.5445; both by one‐way ANOVA); however, expansion slowed across Treg types after FACS (p = 0.0340; two‐way ANOVA with Tukey's multiple comparison correction). (B) Different Treg types (colors as in (A)) were analyzed for expression of indicated markers. Cells were first gated on CD4+CD25+. (C)  Phenotypic marker analysis as in (B) but based on gating on CD4+CD25+CD127lo cells (cf. CD127 marker in (B)). For both (B) and (C), cells were analyzed on day 20. Each individual data point belongs to one Treg batch/donor (symbol shapes identify donors). Error bars are mean ± SD from n = 4 different donors (one donor per experiment); no significant differences in marker expression between Treg types were found by one‐way ANOVA (one test per marker with Tukey's multiple comparison correction).
Figure 3
Figure 3
Activation and suppression capacity of differently transduced Tregs. (A) Transduced Tregs were cultured with indicated B‐LCL for 18 h before being harvested and stained for anti‐CD69. Cumulative data are shown from n = 8 different Treg batches (donors; one donor per experiment). Representative flow cytometry plots are shown in Supporting Information Fig. S4. (B–D) From experiments in (A), culture supernatants were collected and indicated cytokines were analyzed. Error bars represent SEM, n = 6 donors (one donor per experiment). Relative differences between treatments with A2+ or A2 B‐LCL were analyzed by ratio paired t‐test for each Treg type. (E and F) Indicated Treg types with or without IL‐10 co‐expression were compared. Cells were co‐cultured with dye‐labeled Teffs and indicated B‐LCL for 5 days at indicated Teff:Treg ratios (cf. Materials and Methods section). Suppression of Teff proliferation was measured by Teff label dilution using flow cytometry. Shown is the suppression of Teff proliferation by Tregs stimulated with either A2+ or A2− B‐LCL. Large panels (left column, large) show the comparison of IL‐10‐expressing Tregs and corresponding Tregs without IL‐10 co‐expression in the presence of A2B‐LCLs. The other panels are controls whereby (middle column) show the same comparison in the presence of A2− B‐LCLs and (right column) when B‐LCLs were replaced by CD3/CD28 activation beads. Data are from n = 6 different Treg batches (donors; one donor per experiment). Statistical analysis was performed by mixed‐model two‐way ANOVA with matched pairs per donor batch with p‐values added to figure panels.

Similar articles

Cited by

References

    1. Miyara, M. , Gorochov, G. , Ehrenstein, M. , Musset, L. , Sakaguchi, S. and Amoura, Z. , Human FoxP3+ regulatory T cells in systemic autoimmune diseases. Autoimmun. Rev. 2011. 10: 744–755. - PubMed
    1. Fontenot, J. D. , Gavin, M. A. and Rudensky, A. Y. , Foxp3 programs the development and function of CD4+CD25+ regulatory T cells. Nat. Immunol. 2003. 4: 330–336. - PubMed
    1. Hoogduijn, M. J. , Issa, F. , Casiraghi, F. and Reinders, M. E. J. , Cellular therapies in organ transplantation. Transpl. Int. 2021.34: 233–244. - PMC - PubMed
    1. Kawai, K. , Uchiyama, M. , Hester, J. , Wood, K. and Issa, F. , Regulatory T cells for tolerance. Hum. Immunol. 2018. 79: 294–303. - PubMed
    1. Trzonkowski, P. , Bieniaszewska, M. , Juścińska, J. , Dobyszuk, A. , Krzystyniak, A. , Marek, N. , Myśliwska, J. et al., First‐in‐man clinical results of the treatment of patients with graft versus host disease with human ex vivo expanded CD4+CD25+CD127‐ T regulatory cells. Clin. Immunol. 2009. 133: 22–26. - PubMed

Publication types