. 2021 Aug;35(8):e21818.
doi: 10.1096/fj.202001727RR.

Platelet and myeloid cell phenotypes in a rat model of Fabry disease

Affiliations

Platelet and myeloid cell phenotypes in a rat model of Fabry disease

Adam J Kanack et al. FASEB J. 2021 Aug.

Abstract

Fabry disease results from a deficiency of the lysosomal enzyme ⍺-Galactosidase-A (⍺-Gal A) and is estimated to occur in approximately 1:4100 live births. Characteristic of the disease is the accumulation of α-Gal-A substrates, primarily the glycosphingolipids (GSLs) globotriaosylceramide and globotriaosylsphingosine. Thrombotic events are a significant concern for Fabry patients, with strokes contributing to a significant decrease in overall lifespan. Currently, the mechanisms underlying the increased risk of thrombotic events experienced by Fabry patients are incompletely defined. Using a rat model of Fabry disease, we provide an improved understanding of the mechanisms linking GSL accumulation to thrombotic risk. We found that ⍺-Gal A-deficient rats accumulate myeloid-derived leukocytes at sites of GSL accumulation, including in the bone marrow and circulation, and that myeloid-derived leukocyte and megakaryocyte populations were prominent among cell types that accumulated GSLs. In the circulation, ⍺-Gal A-deficient rats had increases in cytokine-producing cell types and a corresponding elevation of pro-inflammatory cytokines. Lastly, circulating platelets from ⍺-Gal A-deficient rats accumulated a similar set of ⍺-Galactosidase-A substrates as was observed in megakaryocytes in the bone marrow, and exhibited increased platelet binding to fibrinogen in microfluidic and flow cytometric assays.

Keywords: animal model; glycobiology; glycosphingolipids; lysosomal storage disease.


Conflict of interest statement

CONFLICT OF INTEREST

The authors declare no conflicts of interest with the contents of this article.

Figures

Figure 1.
Figure 1.. Glycosphingolipids accumulate in the bone marrow of α -Gal A deficient rats.
A) GSLs were extracted from the femurs of (n=3) WT and (n=3) KO male rats (52-week-old), separated by thin-layer chromatography and visualized by orcinol-sulfuric acid solution. B) Representative mass spectrometry spectra from glycosphingolipids isolated from the femurs of (n=3) WT or (n=3) KO male rats (52-week-old) were analyzed using nanospray ionization-mass spectrometry (NSI-MS), and quantified relative to a known tetrasaccharide standard (DP4, blue). C) Mass spectrometry quantification of glycosphingolipids extracted from the femurs of (n=3) WT and (n=3) KO rats. Highlighted in pink are the α-galactosidase A substrates Gb3, globotriaosylceramide; lyso-Gb3, globotriaosylsphingosine; lyso-Gb3 + hexoside extension; and B-group antigen. The glycosphingolipids GlcCer, glucosylceramide; Gb4, globotetraosylceramide; GM3, lactosylceramide; were also quantified. Hex, hexoside. Data are means ± SEM and compared using multiple t tests with Bonferroni post-hoc correction. P-values are listed above each comparison. *P < 0.05, **P < 0.005.
Figure 2.
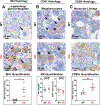
Figure 2.. Glycosphingolipid accumulation occurs in myeloid-derived leukocytes and megakaryocytes in the bone marrow.
Decalcified femur sections from WT or KO male rats (52–75-weeks-old) were stained as indicated in each panel. Quantification of histological staining was performed by analyzing three random fields of view at 20X magnification from (n=6) WT and (n=6) KO rats using ImageJ. A) Femur sections were incubated with Griffonia simplicifolia isolectin B4 (IB4), a lectin with high affinity for terminal α-galactose. Areas of IB4 staining were visualized using biotinylated IB4, streptavidin-HRP and 3,3’diaminobenzidine. IB4 laden cells were identified by light microscopy and are denoted by asterisks for polymorphonuclear leukocytes, or black arrows for megakaryocytes (inset). IB4 quantification is shown in the bottom panel. Data are means ± SEM and compared using two-tailed, unpaired t test with Welch’s correction. B) Femur sections were stained as above, but with an anti-CD41 antibody that recognizes cells of a megakaryocyte lineage. Megakaryocytes are denoted by black arrows. Quantification of megakaryocyte (MK) abundance (left panel) and total CD41-positive staining (right panel) is shown below CD41 histology images. Data are means ± SEM and compared using 2-tailed, unpaired Student’s t test. C) Femur sections were stained as above, but with an anti-CD68 antibody that recognizes cells of a monocytic lineage. CD68 quantification is shown in the bottom panel. Data are means ± SEM and compared using two-tailed, unpaired Student’s t test. *P < 0.05, **P < 0.005.
Figure 3.
Figure 3.. Glycosphingolipid accumulation impacts myeloid-derived leukocyte and megakaryocyte morphologies.
A) Electron microscopy was used to identify leukocytes from decalcified femur sections of (n=3) WT and (n=3) KO male rats (52-week-old). A representative leukocyte from a KO rat containing lysosomal lipid inclusions is outlined (black dashed lines, top panel). An area from the top panel (white box) is presented at higher magnification with lipid inclusions (zebra bodies) identified by white arrows (bottom panel). B) Representative electron microscopy images identifying changes to megakaryocyte morphology in bone marrow isolated from the femurs of (n=3) WT (top) or (n=3) KO rats (bottom). Megakaryocytes are outlined by white dashed lines and are surrounded by an actin-rich peripheral zone (PZ), an area utilized by megakaryocytes to attach to the extracellular matrix. Areas of higher magnification (black boxes) are displayed in the middle and right panels of B to highlight morphological changes to the demarcation membrane system (DMS) of KO rats. The demarcation membrane system contains platelet territories with proplatelets denoted by white asterisks.
Figure 4.
Figure 4.. Terminal α-galactose containing glycosphingolipids accumulate in KO platelets.
A) Glycosphingolipids were extracted from the platelets of (n=4) WT and (n=4) KO male rats (52-week-old) and analyzed using nanospray ionization-mass spectrometry. Representative mass spectra encompassing m/z ratios of 950–1400 are displayed for WT and KO rats to highlight Gb3 accumulation. B) Full spectra quantification of glycosphingolipids isolated from WT and KO rats in A. Highlighted in pink are the α-galactosidase A substrates Gb3, globotriaosylceramide; lyso-Gb3, globotriaosylsphingosine; lyso-Gb3 + hexoside extension; and B-group antigen. The glycosphingolipids GM3-NeuAc, N-Acetylneuraminyllactosylceramide; GM3-NeuGc, N-glycolylneuraminyllactosylceramide; and Gb4, globotetraosylceramide were also quantified; Hex, hexoside. Data are means ± SEM and compared using two-tailed, unpaired t test with Welch’s correction. P values are listed above each comparison. *P < 0.05, ***P < 0.001, ****P < 0.0001.
Figure 5.
Figure 5.. Platelet and leukocyte counts are elevated in the circulation of Fabry rats.
Whole blood was drawn from the tail of WT and KO male rats (15–75-weeks-old) and binned into 15–25-, 25–50-, and 50–75-week-old age groups from (n=5–12) WT and (n=7–14) KO male rats for each age group. Data are means ± SEM and compared using two-tailed, unpaired t test with Welch’s correction. *P < 0.05, **P < 0.005, ***P < 0.001.
Figure 6.
Figure 6.. α-Gal A deficient rats have increased levels of cytokines in the circulation.
Cytokine levels were measured from the plasma of (n=7) WT and (n=10) KO male rats (52-week-old) using a multi-plex flow cytometry assay. Data are means ± SEM and compared using two-tailed, unpaired t test with Welch’s correction. *P < 0.05, **P < 0.005.
Figure 7.
Figure 7.. α-Gal A-deficient platelets have increased platelet activation in response to ADP.
Washed platelets were isolated from the whole blood of WT and KO male rats (15–75-week-old) and binned into 25–50-, or 50–75-week-old age groups. Flow cytometry assays were used to measure fibrinogen binding to the platelet glycoprotein complex GPIIb/IIIa following activation with ADP, thrombin, or convulxin from (n=14–19) WT and (n=17–24) KO male rats. Data are means ± SEM. **P < 0.005, two-tailed, unpaired Student’s t test was used for comparison of 50–75-week-old cohorts for ADP, convulxin and thrombin; two-tailed, unpaired t test with Welch’s correction was used to compare 25–50-week-old cohorts for ADP activation.
Figure 8.
Figure 8.. α-Gal A-deficient platelets have increased platelet aggregation in response to ADP.
Platelet rich plasma was isolated from the whole blood of (n=6) WT or (n=8) KO rats (52–75-week-old). Light transmission was zeroed prior to adding ADP and was continuously measured twice per second, for ten minutes following the addition of ADP (30μM) using a Chrono-Log aggregometer (Model 540) to obtain aggregation curves. For aggregation curves, data are means ± SEM and compared using 2-way ANOVA. ****P < 0.0001. For analysis at 600 seconds, data are means ± SEM and compared using two-tailed, unpaired Student’s t test. *P < 0.05.
Figure 9.
Figure 9.. α-Gal A-deficient platelets have increased platelet adhesion in response to ADP.
For whole blood microfluidic assays, fibrinogen (50 μg/mL) was plated on microfluidic slides and blocked with BSA. Whole blood from 52-week-old rats was incubated with 50 μM mepacrine to label platelet granules, and whole blood was flowed over individual microfluidic channels at 25 mL/hr. Adherent platelets were imaged using an inverted microscope (EVOS cell imaging system). Three independent fields of view were analyzed for each rat (n=5 WT and n=5 KO). Data are means ± SEM and compared using two-tailed, unpaired Student’s t test. **P < 0.05.

Similar articles

Cited by

References

    1. Germain DP. Fabry disease. Orphanet J Rare Dis. 2010;5:30. doi: 10.1186/1750-1172-5-30. PubMed PMID: 21092187; PMCID: 3009617. - DOI - PMC - PubMed
    1. Ortiz A, Sanchez-Nino MD. Diagnosis and treatment of Fabry disease. Med Clin (Barc). 2017;148(3):132–8. Epub 2016/12/04. doi: 10.1016/j.medcli.2016.09.047. - DOI - PubMed
    1. Sher NA, Letson RD, Desnick RJ. The ocular manifestations in Fabry’s disease. Arch Ophthalmol. 1979;97(4):671–6. Epub 1979/04/01. doi: 10.1001/archopht.1979.01020010327008. - DOI - PubMed
    1. Spaeth GL, Frost P. Fabry’s disease. Its ocular manifestations. Arch Ophthalmol. 1965;74(6):760–9. Epub 1965/12/01. doi: 10.1001/archopht.1965.00970040762005. - DOI - PubMed
    1. Navarro C, Teijeira S, Dominguez C, Fernandez JM, Rivas E, Fachal C, Barrera S, Rodriguez C, Iranzo P. Fabry disease: an ultrastructural comparative study of skin in hemizygous and heterozygous patients. Acta Neuropathol. 2006;111(2):178–85. Epub 2006/02/08. doi: 10.1007/s00401-005-0026-8. - DOI - PubMed

Publication types

Substances

LinkOut - more resources