

Endoplasmic reticulum stress inhibits 3D Matrigel-induced vasculogenic mimicry of breast cancer cells via TGF-β1/Smad2/3 and β-catenin signaling
- PMID: 34320274
- PMCID: PMC8409287
- DOI: 10.1002/2211-5463.13259
Endoplasmic reticulum stress inhibits 3D Matrigel-induced vasculogenic mimicry of breast cancer cells via TGF-β1/Smad2/3 and β-catenin signaling
Abstract
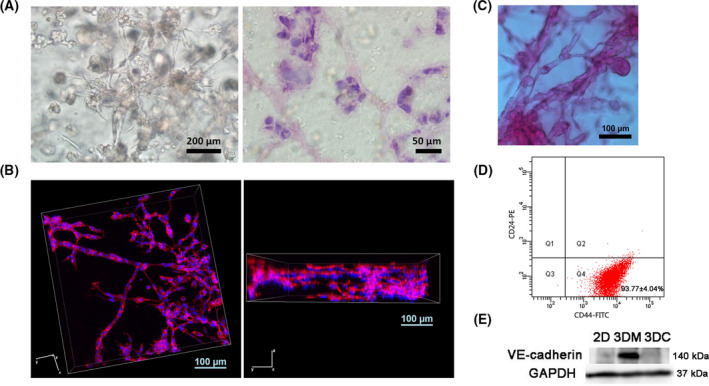
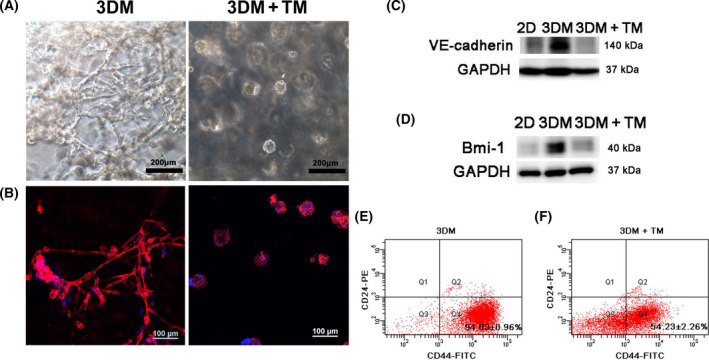
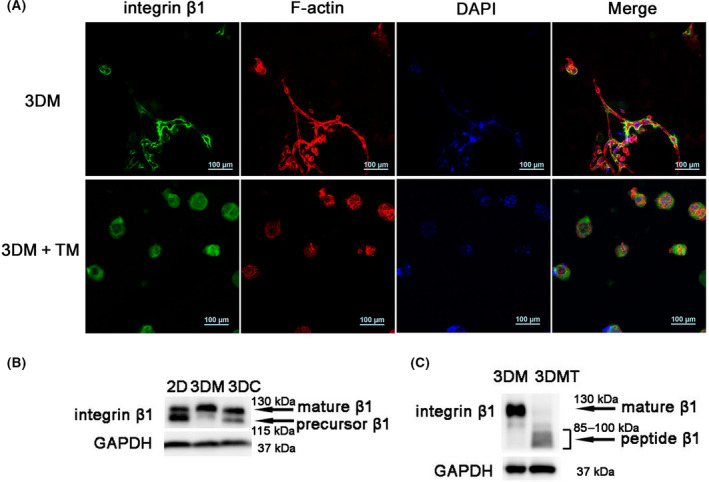
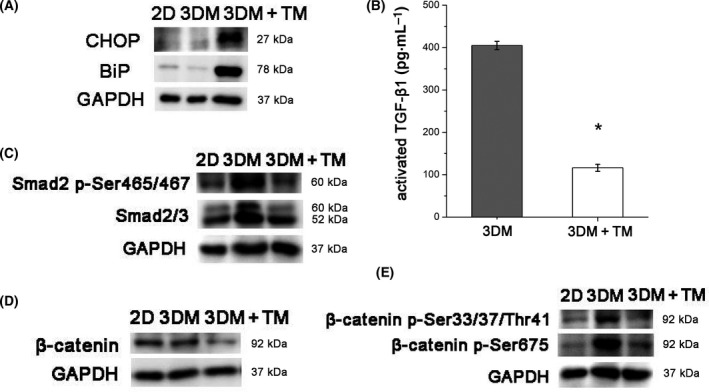
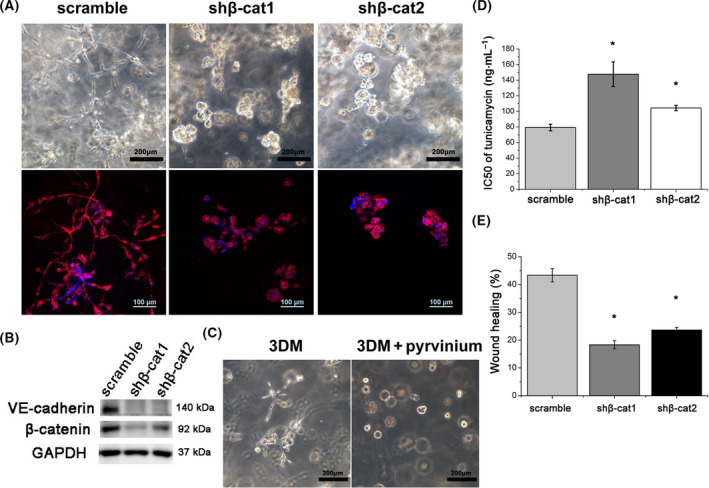
Endoplasmic reticulum (ER) stress is a cellular stress condition involving disturbance in the folding capacity of the ER caused by endogenous and exogenous factors. ER stress signaling pathways affect tumor malignant growth, angiogenesis and progression, and promote the antitumor effects of certain drugs. However, the impact of ER stress on the vasculogenic mimicry (VM) phenotype of cancer cells has not been well addressed. VM is a phenotype that mimics vasculogenesis by forming patterned tubular networks, which are related to stemness and aggressive behaviors of cancer cells. In this study, we used tunicamycin (TM), the unfolded protein response (UPR)-activating agent, to induce ER stress in aggressive triple-negative MDA-MB-231 breast cancer cells, which exhibit a VM phenotype in 3D Matrigel cultures. TM-induced ER stress was able to inhibit the VM phenotype. In addition to the tumor spheroid phenotype observed upon inhibiting the VM phenotype, we observed alterations in glycosylation of integrin β1, loss of VE-cadherin and a decrease in stem cell marker Bmi-1. Further study revealed decreased activated transforming growth factor β1, Smad2/3, Phospho-Smad2 and β-catenin. β-Catenin knockdown markedly inhibited the VM phenotype and resulted in the loss of VE-cadherin. The data suggest that the activation of ER stress inhibited VM phenotype formation of breast cancer cells via both the transforming growth factor β1/Smad2/3 and β-catenin signaling pathways. The discovery of prospective regulatory mechanisms involved in ER stress and VM in breast cancer could lead to more precisely targeted therapies that inhibit vessel formation and affect tumor progression.
Keywords: TGF-β1; breast cancer; endoplasmic reticulum stress; vasculogenic mimicry; β-catenin.
© 2021 The Authors. FEBS Open Bio published by John Wiley & Sons Ltd on behalf of Federation of European Biochemical Societies.
Conflict of interest statement
The authors declare no conflict of interest.
Figures
Similar articles
-
Vascular mimicry formation is promoted by paracrine TGF-β and SDF1 of cancer-associated fibroblasts and inhibited by miR-101 in hepatocellular carcinoma.Cancer Lett. 2016 Dec 1;383(1):18-27. doi: 10.1016/j.canlet.2016.09.012. Epub 2016 Sep 28. Cancer Lett. 2016. PMID: 27693460
-
Tunicamycin-induced endoplasmic reticulum stress inhibits chemoresistance of FaDu hypopharyngeal carcinoma cells in 3D collagen I cultures and in vivo.Exp Cell Res. 2021 Aug 15;405(2):112725. doi: 10.1016/j.yexcr.2021.112725. Epub 2021 Jul 3. Exp Cell Res. 2021. PMID: 34224701
-
Rho kinase mediates transforming growth factor-β1-induced vasculogenic mimicry formation: involvement of the epithelial-mesenchymal transition and cancer stemness activity.Acta Biochim Biophys Sin (Shanghai). 2020 Apr 20;52(4):411-420. doi: 10.1093/abbs/gmaa014. Acta Biochim Biophys Sin (Shanghai). 2020. PMID: 32296834
-
Vasculogenic Mimicry in Breast Cancer: Clinical Relevance and Drivers.Cells. 2021 Jul 12;10(7):1758. doi: 10.3390/cells10071758. Cells. 2021. PMID: 34359928 Free PMC article. Review.
-
Tumor cell vascular mimicry: Novel targeting opportunity in melanoma.Pharmacol Ther. 2016 Mar;159:83-92. doi: 10.1016/j.pharmthera.2016.01.006. Epub 2016 Jan 22. Pharmacol Ther. 2016. PMID: 26808163 Free PMC article. Review.
Cited by
-
Strong Activation of ID1, ID2, and ID3 Genes Is Coupled with the Formation of Vasculogenic Mimicry Phenotype in Melanoma Cells.Int J Mol Sci. 2024 Aug 27;25(17):9291. doi: 10.3390/ijms25179291. Int J Mol Sci. 2024. PMID: 39273240 Free PMC article.
-
Emerging roles of endoplasmic reticulum stress in the cellular plasticity of cancer cells.Front Oncol. 2023 Feb 20;13:1110881. doi: 10.3389/fonc.2023.1110881. eCollection 2023. Front Oncol. 2023. PMID: 36890838 Free PMC article. Review.
-
Inhibition of glycolysis represses the growth and alleviates the endoplasmic reticulum stress of breast cancer cells by regulating TMTC3.Open Med (Wars). 2023 Apr 10;18(1):20230635. doi: 10.1515/med-2023-0635. eCollection 2023. Open Med (Wars). 2023. PMID: 37069941 Free PMC article.
-
Endoplasmic Reticulum Stress Contributes to Ventilator-Induced Diaphragm Atrophy and Weakness in Rats.Front Physiol. 2022 Jun 27;13:897559. doi: 10.3389/fphys.2022.897559. eCollection 2022. Front Physiol. 2022. PMID: 35832486 Free PMC article.
-
Immunopeptidome mining reveals a novel ERS-induced target in T1D.Cell Mol Immunol. 2024 Jun;21(6):604-619. doi: 10.1038/s41423-024-01150-0. Epub 2024 Apr 30. Cell Mol Immunol. 2024. PMID: 38689020 Free PMC article.
References
-
- Seftor REB, Seftor EA, Koshikawa N, Meltzer PS, Gardner LMG, Bilban M, Stetler‐Stevenson WG, Quaranta V and Hendrix MJC (2001) Cooperative interactions of laminin 5 γ2 chain, matrix metalloproteinase‐2, and membrane type‐1‐matrix/metalloproteinase are required for mimicry of embryonic vasculogenesis by aggressive melanoma. Cancer Res 61, 6322–6327. - PubMed
-
- Wang HF, Wang SS, Zheng M, Dai LL, Wang K, Gao XL, Cao MX, Yu XH, Pang X, Zhang Met al. (2019) Hypoxia promotes vasculogenic mimicry formation by vascular endothelial growth factor A mediating epithelial‐mesenchymal transition in salivary adenoid cystic carcinoma. Cell Prolif 52, 1–11. - PMC - PubMed
-
- Zhao J, Wu J, Qin Y, Zhang W, Huang G and Qin L (2020) LncRNA PVT1 induces aggressive vasculogenic mimicry formation through activating the STAT3/Slug axis and epithelial‐to‐mesenchymal transition in gastric cancer. Cell Oncol 43, 863–876. - PubMed
Publication types
MeSH terms
Substances
LinkOut - more resources
Full Text Sources
Medical
Miscellaneous
