

Dysregulated oxalate metabolism is a driver and therapeutic target in atherosclerosis
- PMID: 34320345
- PMCID: PMC8363062
- DOI: 10.1016/j.celrep.2021.109420
Dysregulated oxalate metabolism is a driver and therapeutic target in atherosclerosis
Abstract
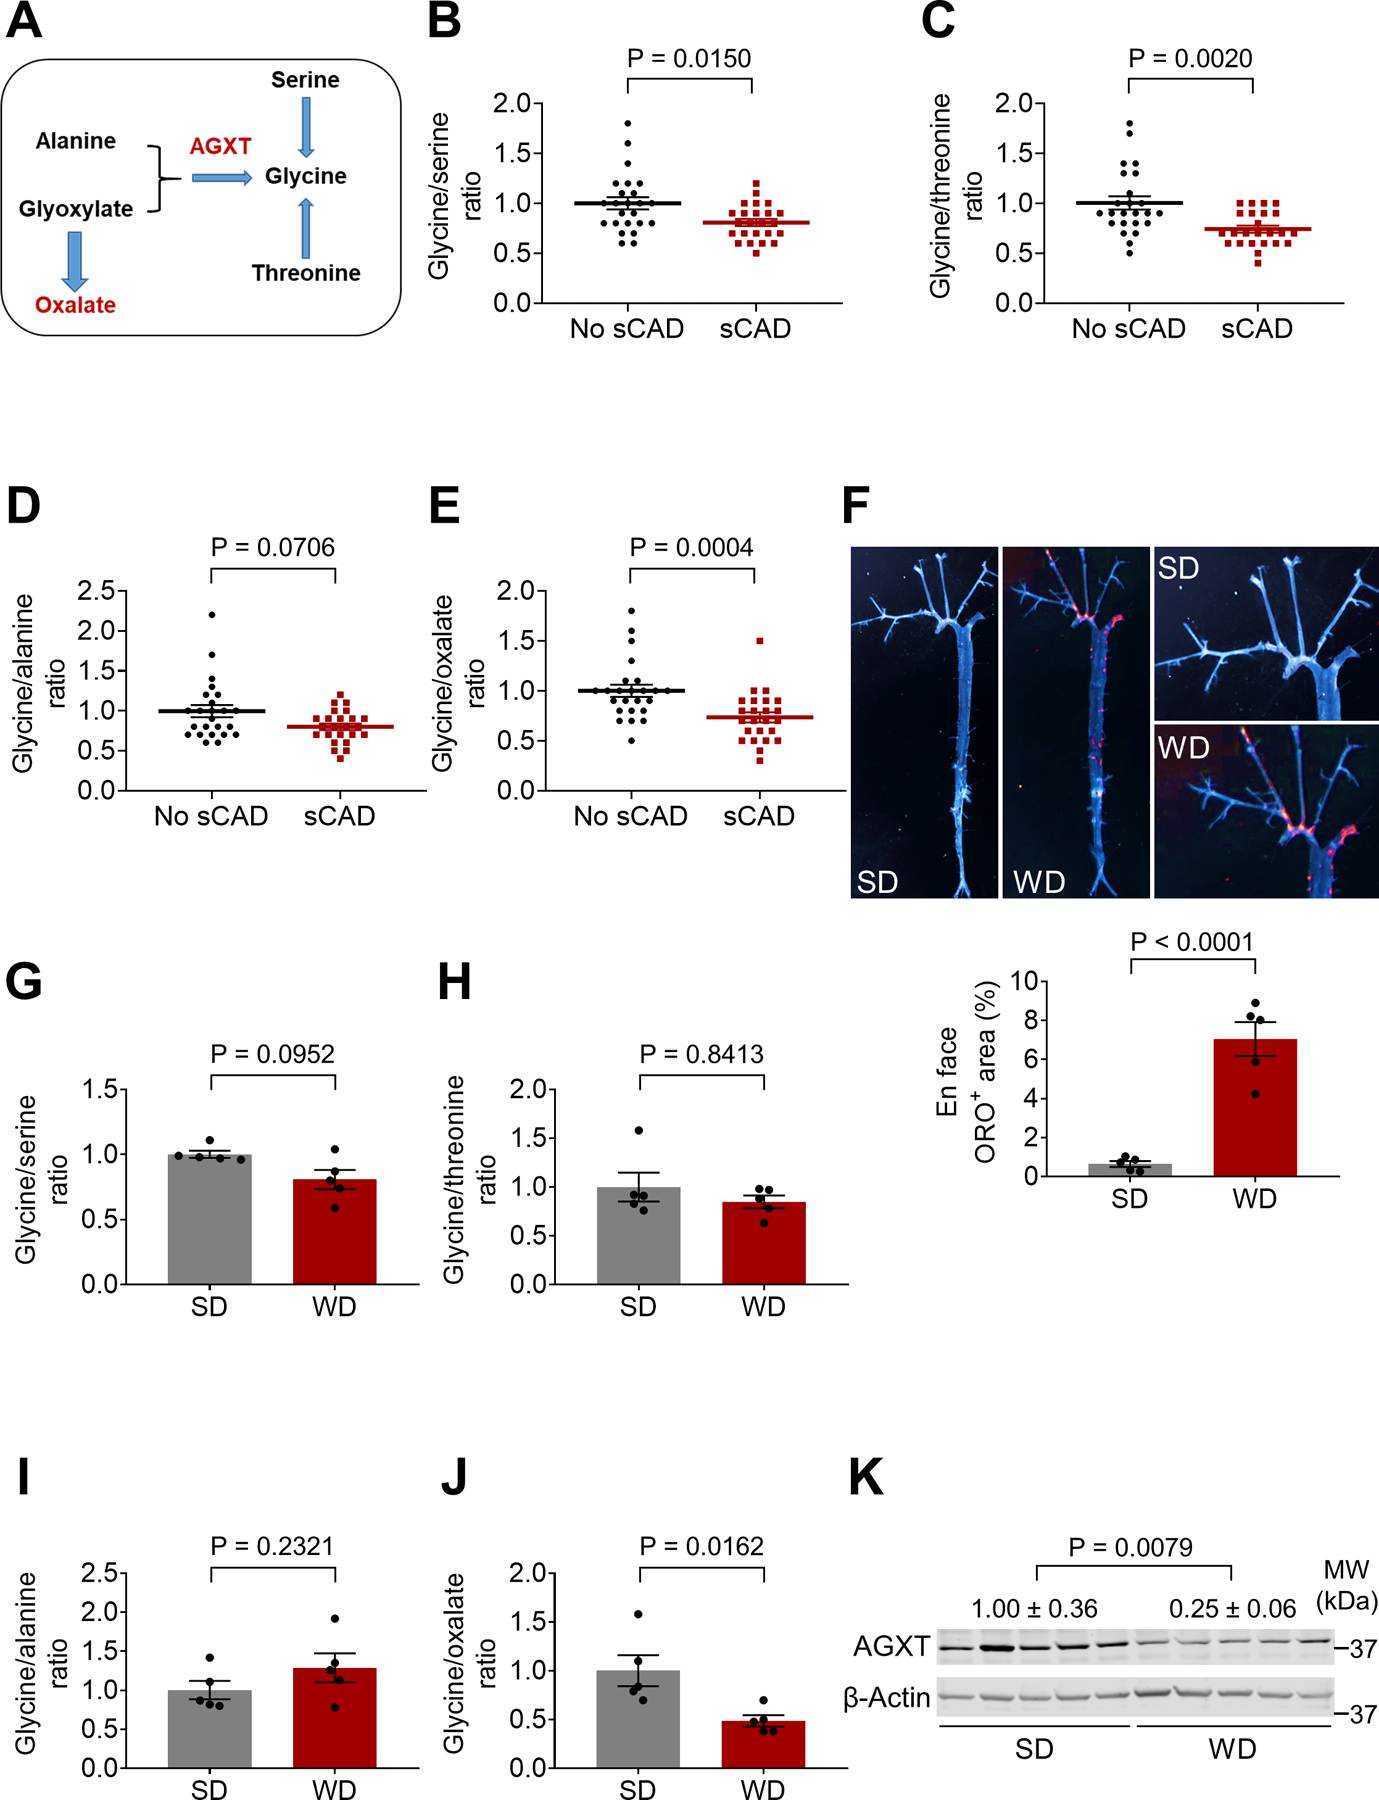
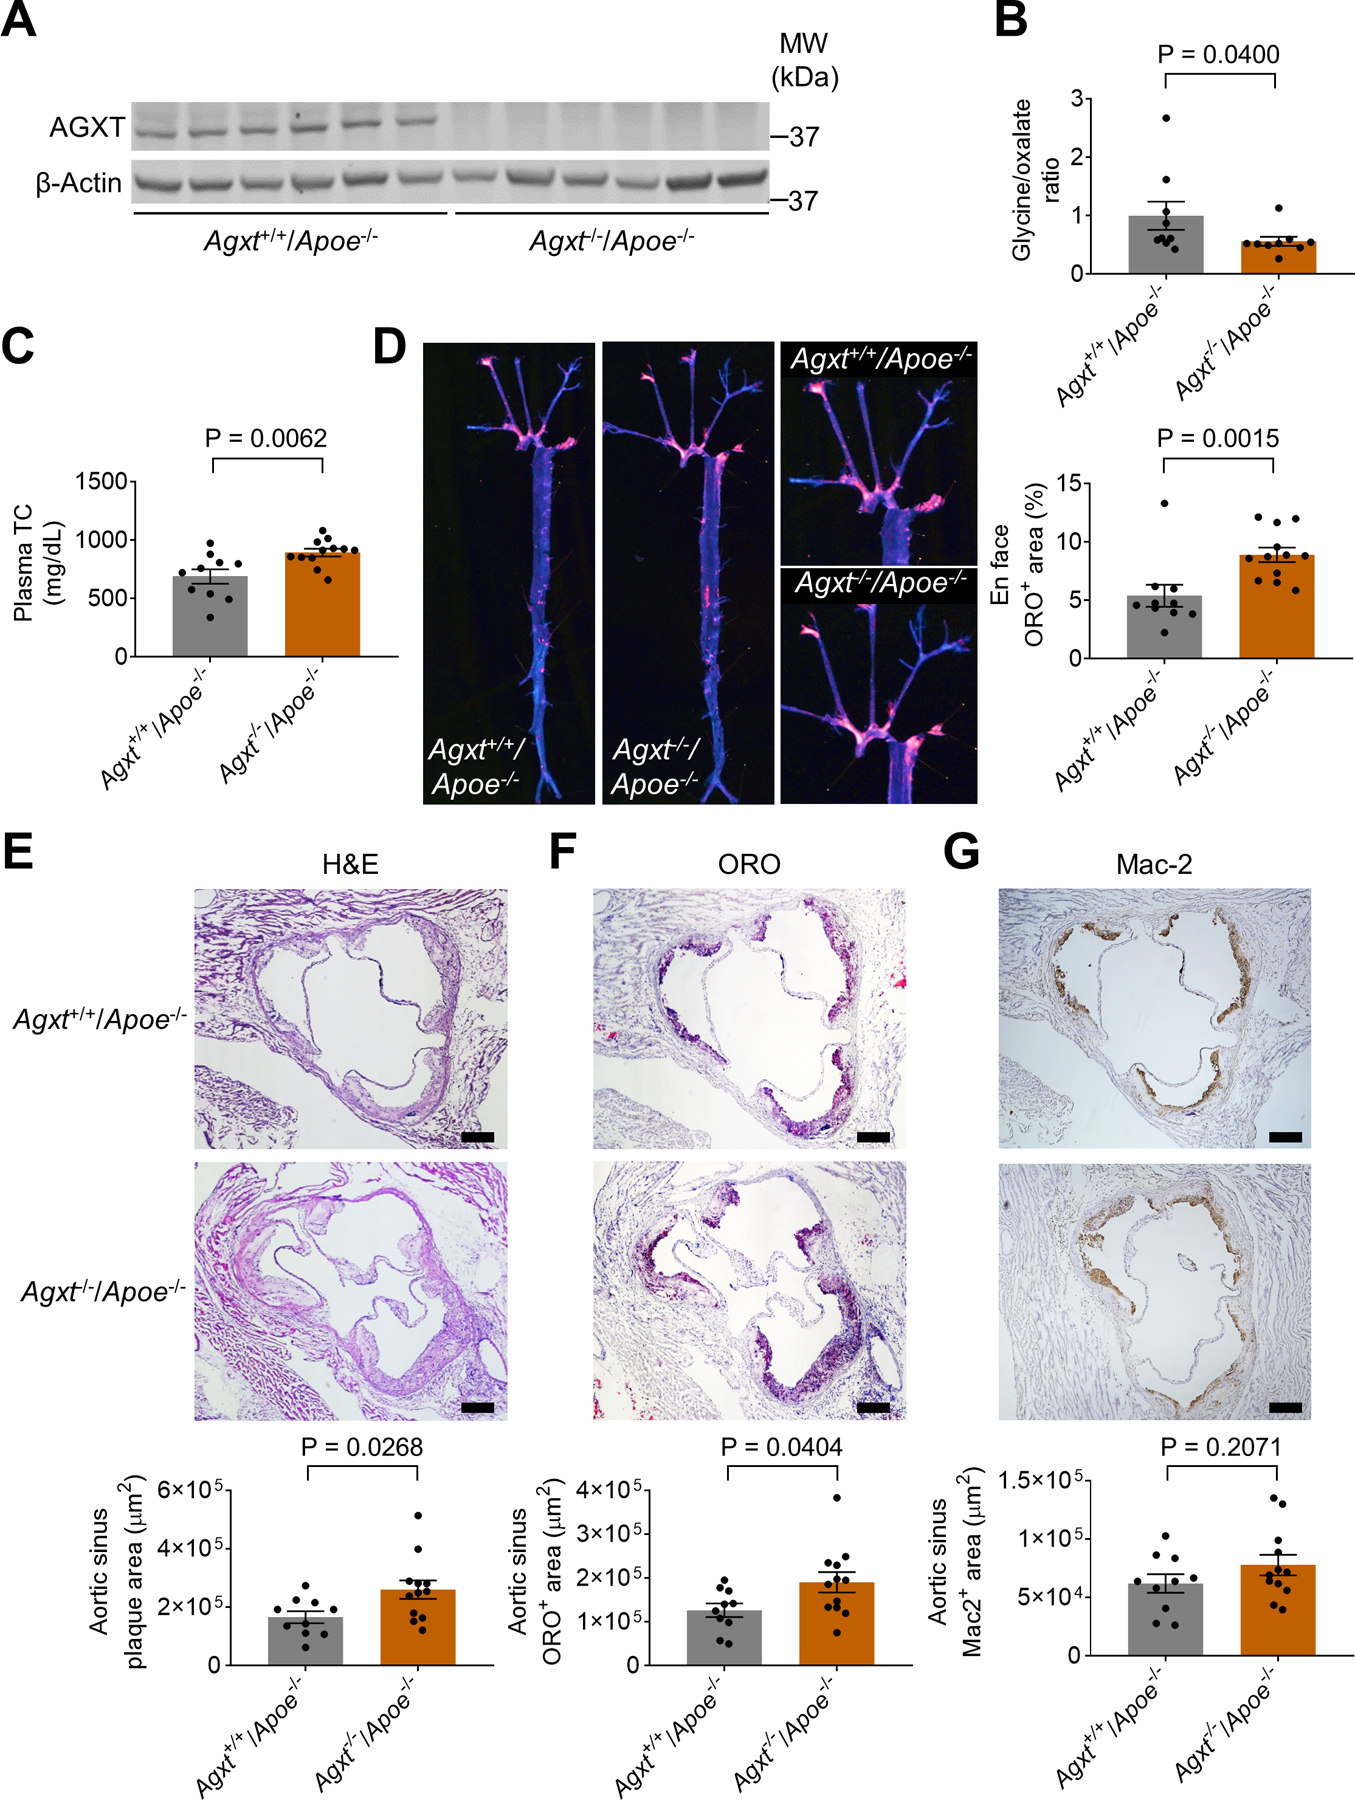
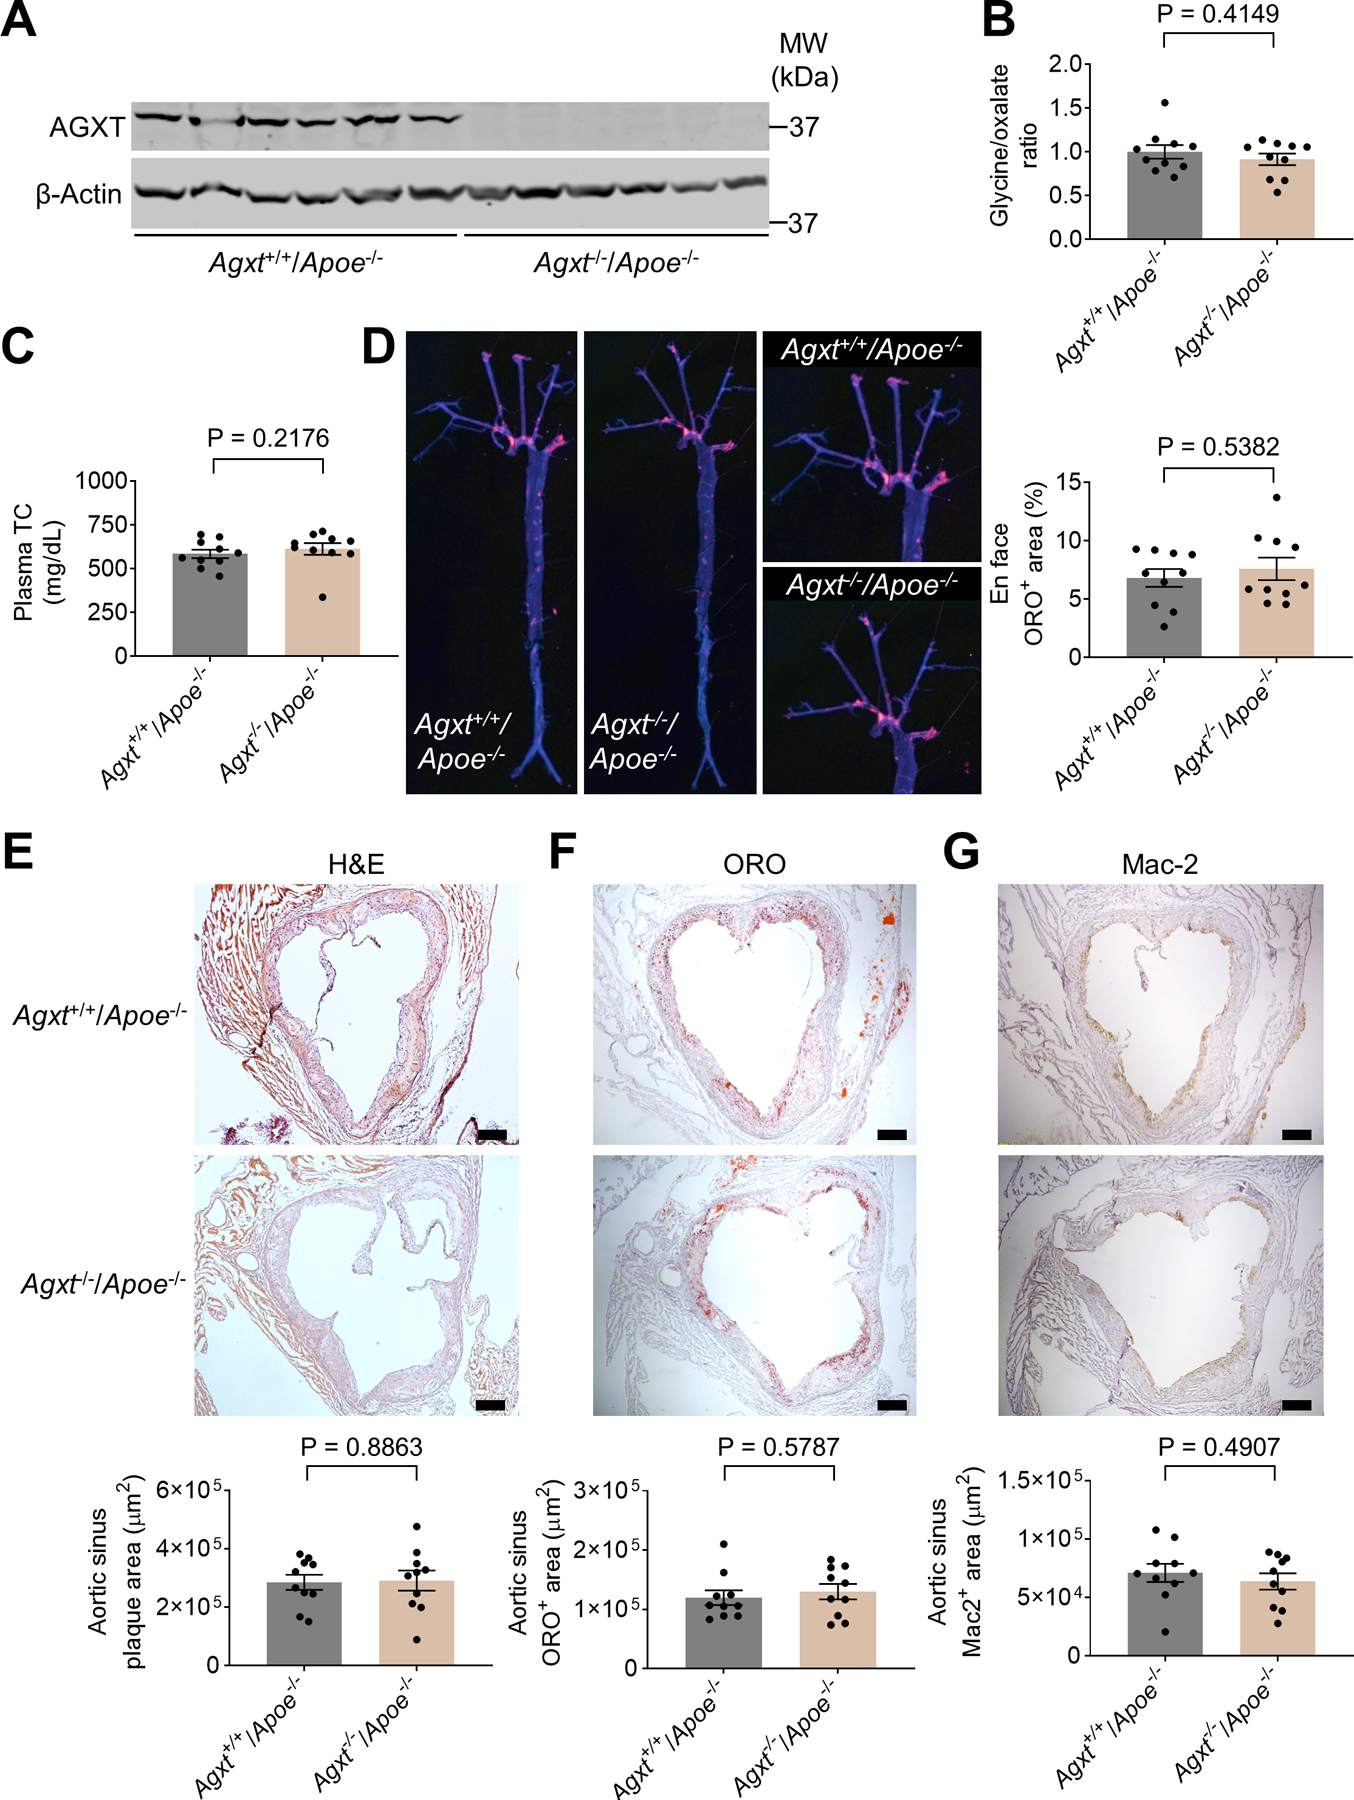
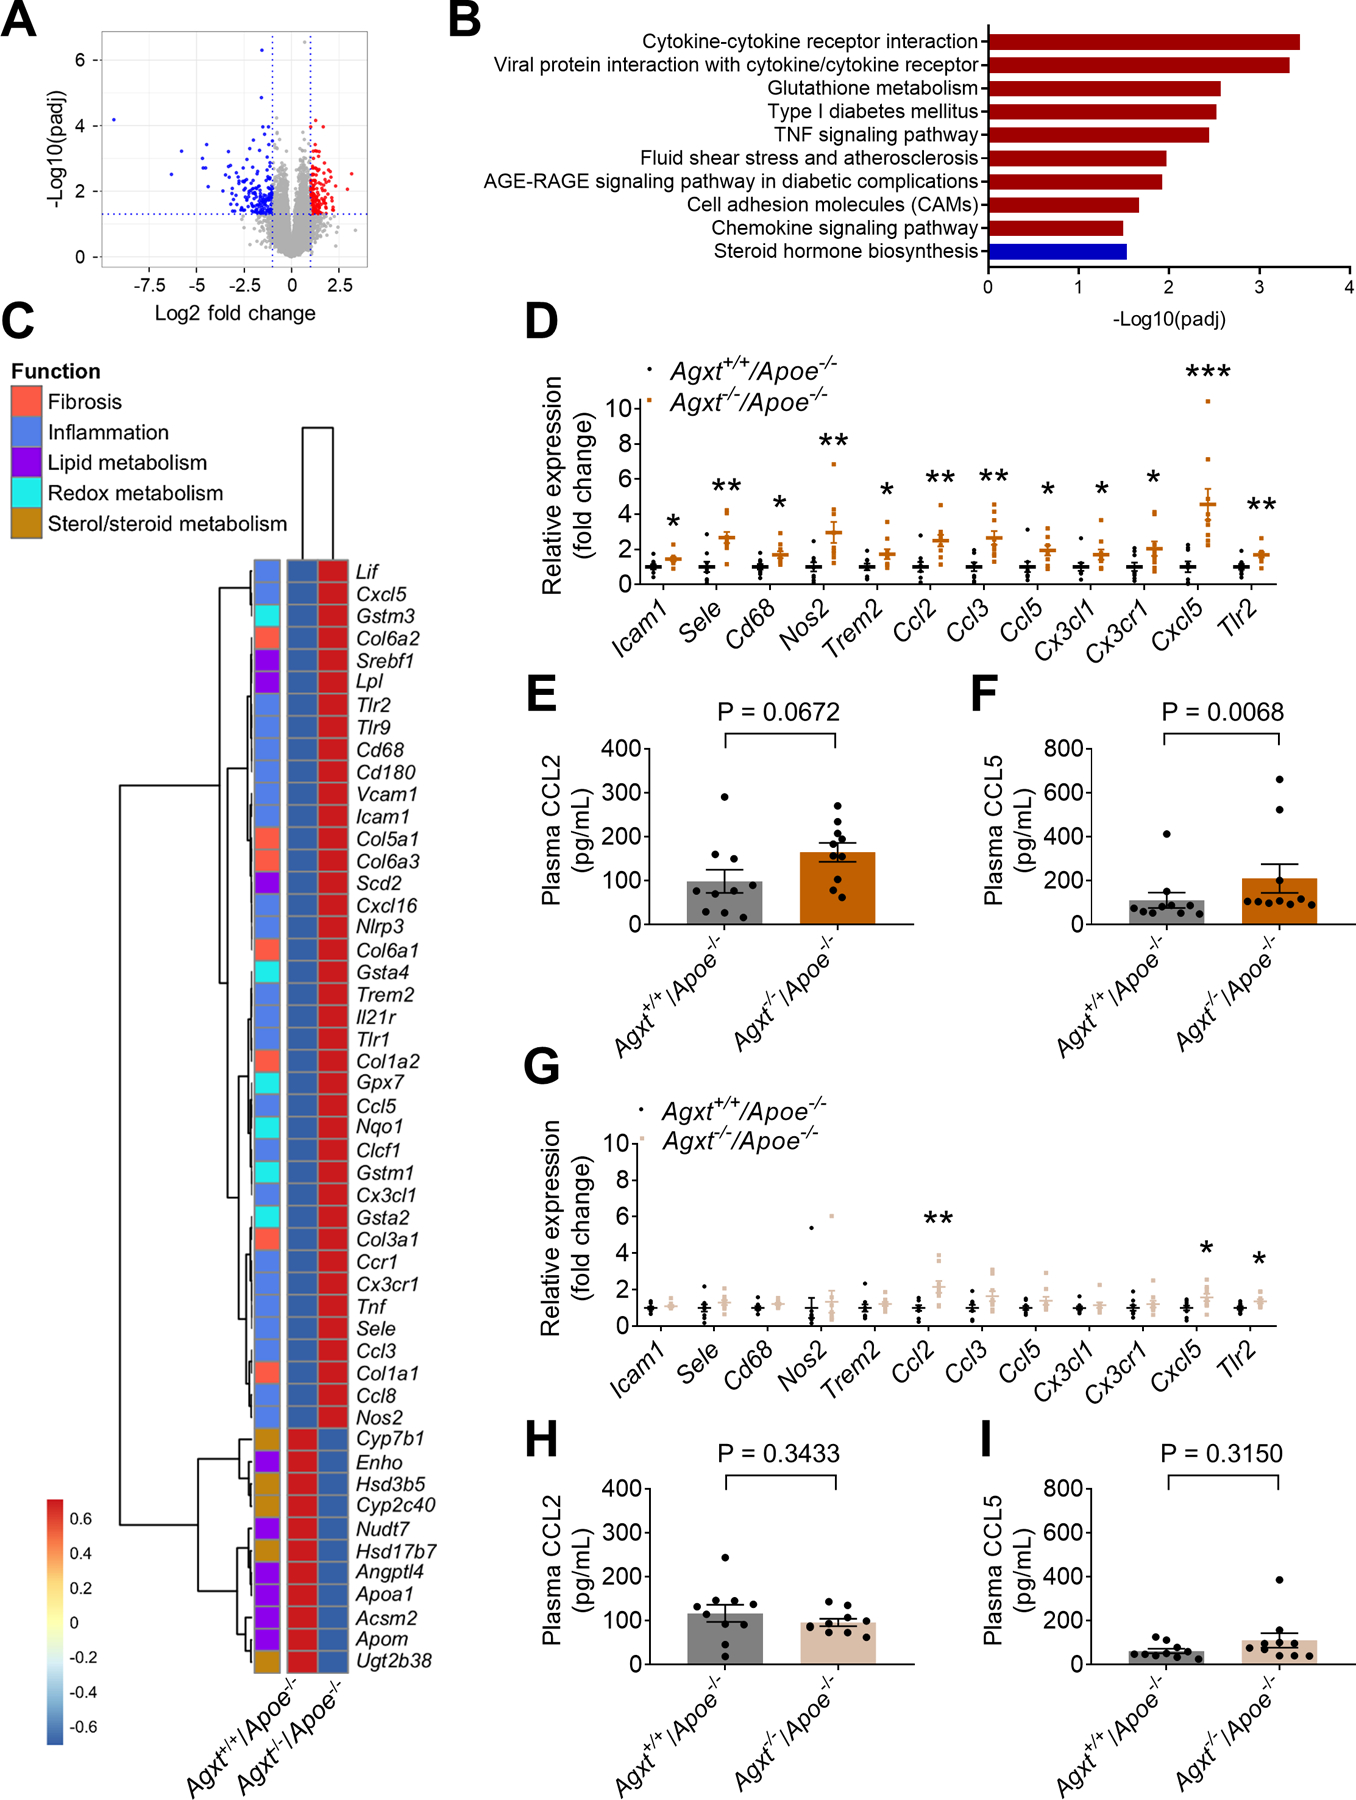
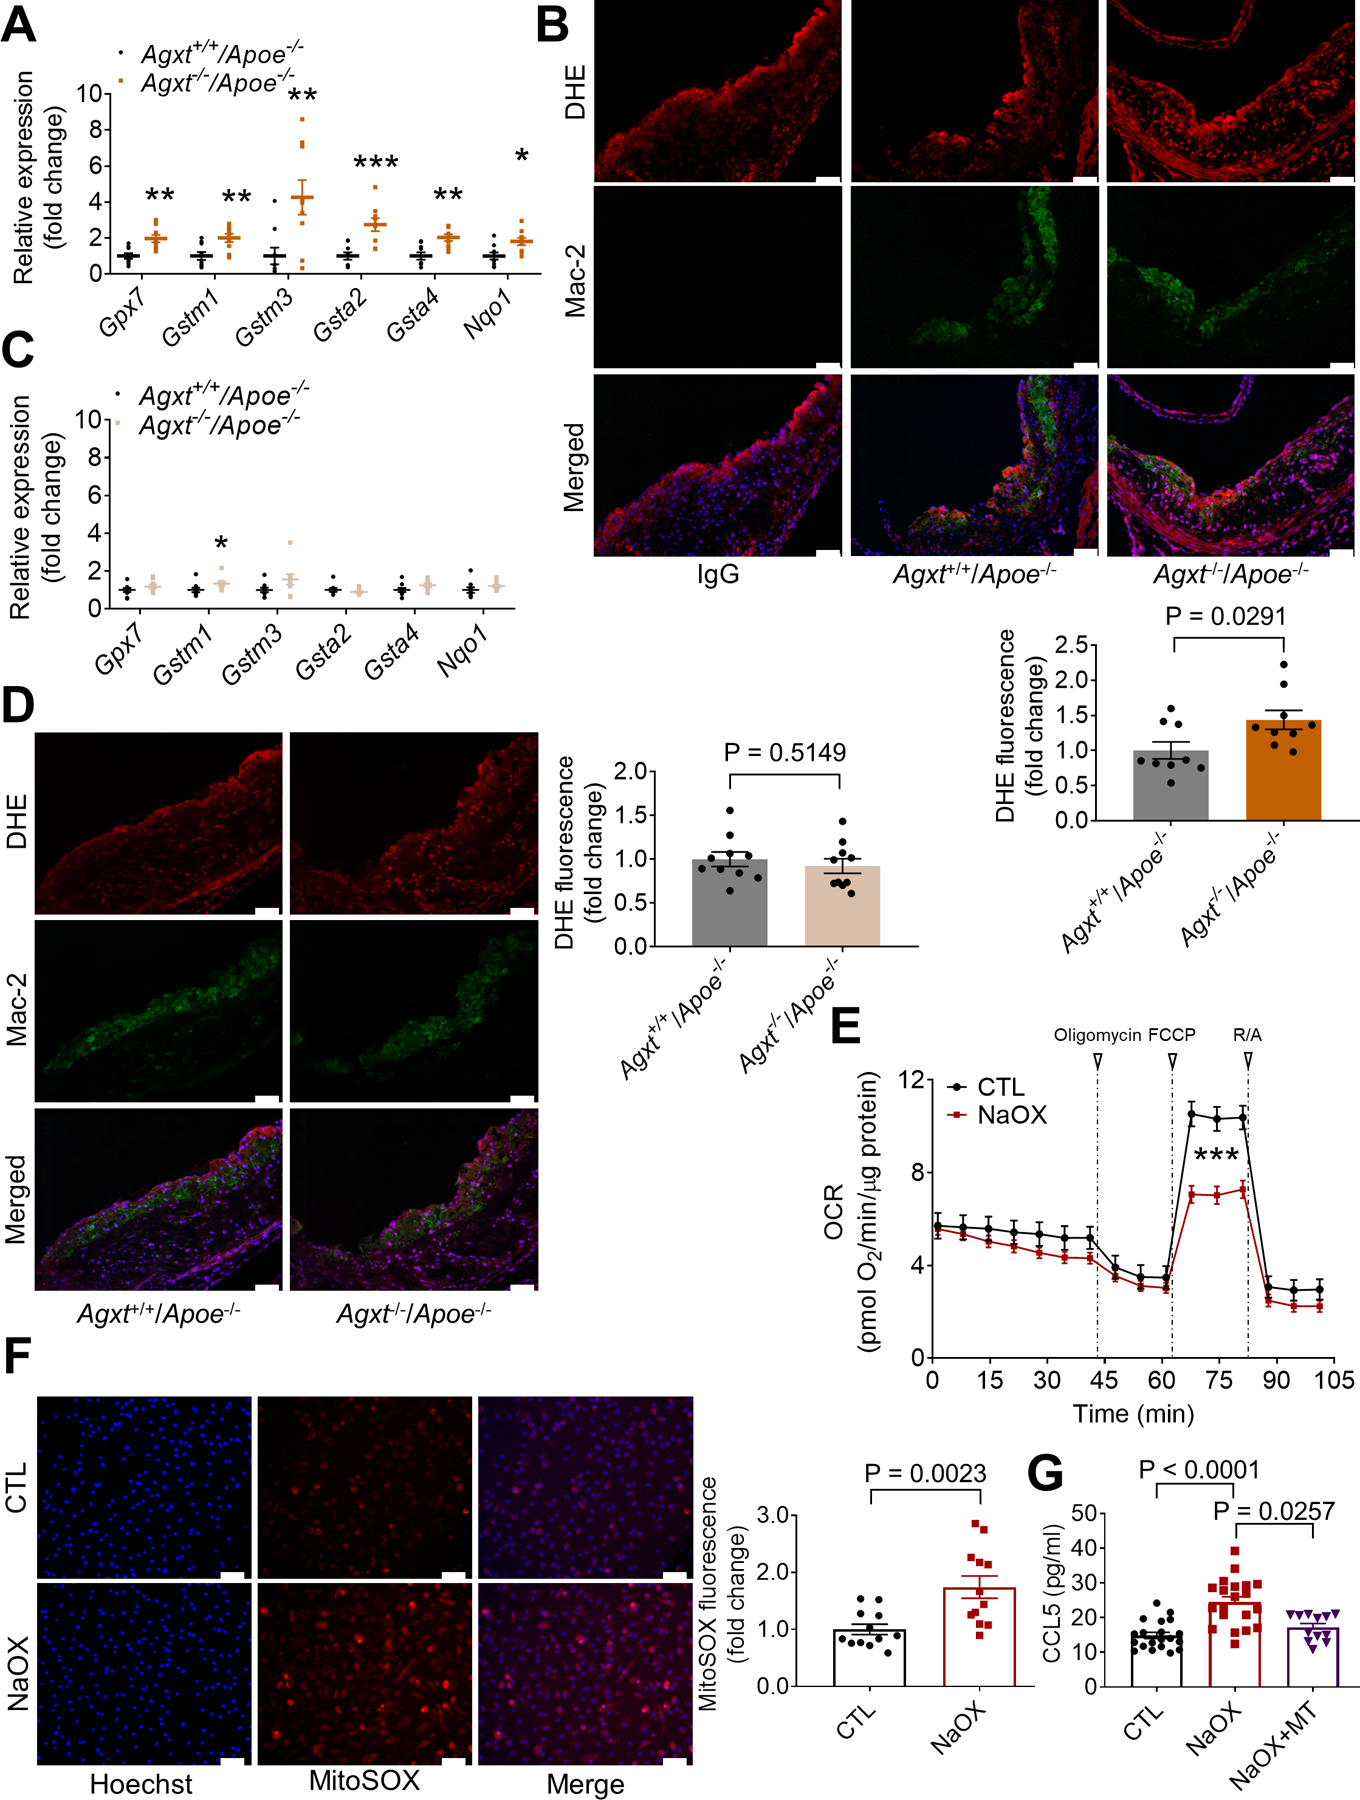
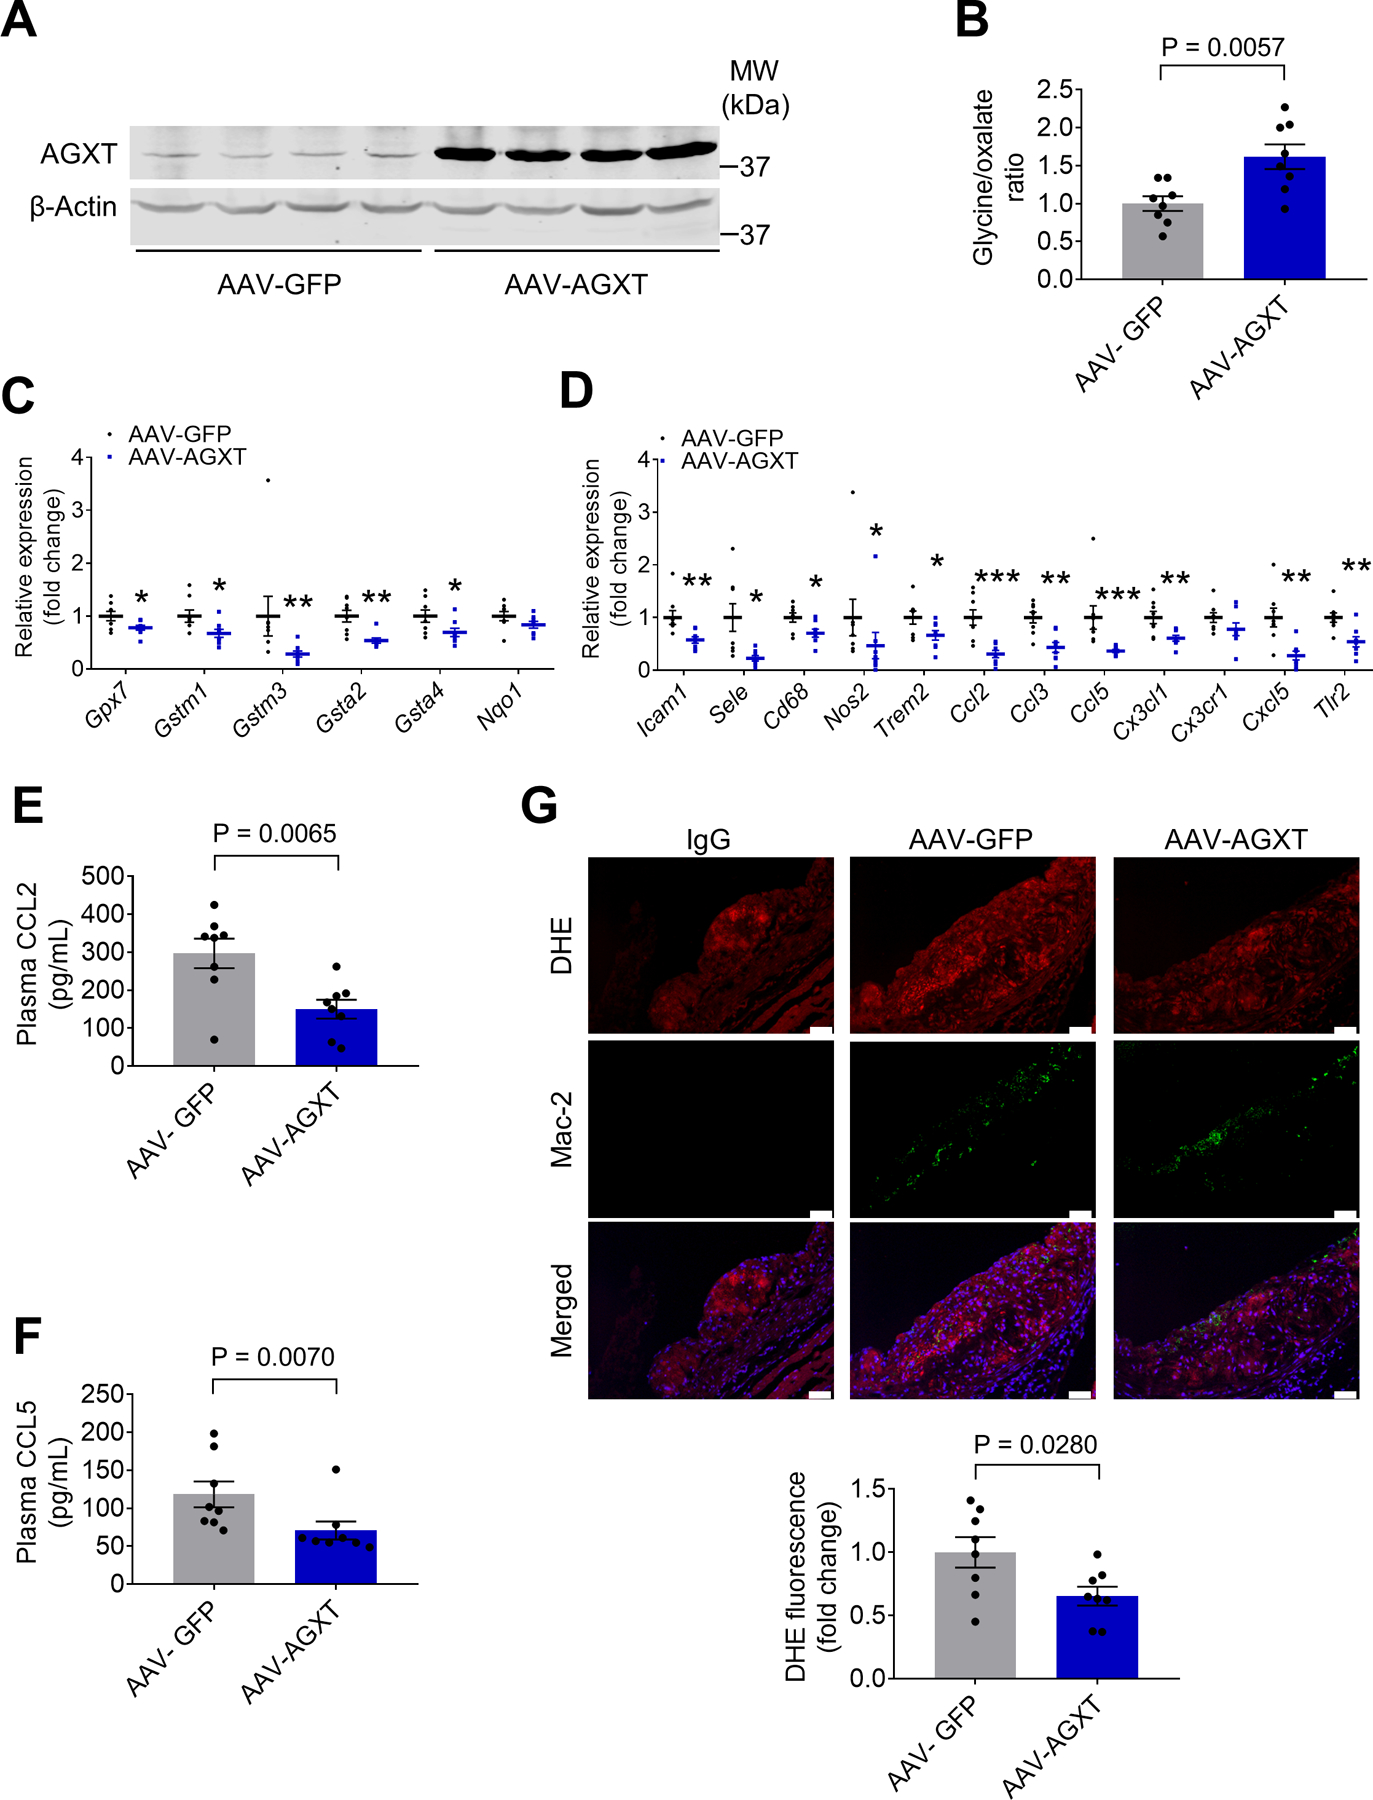
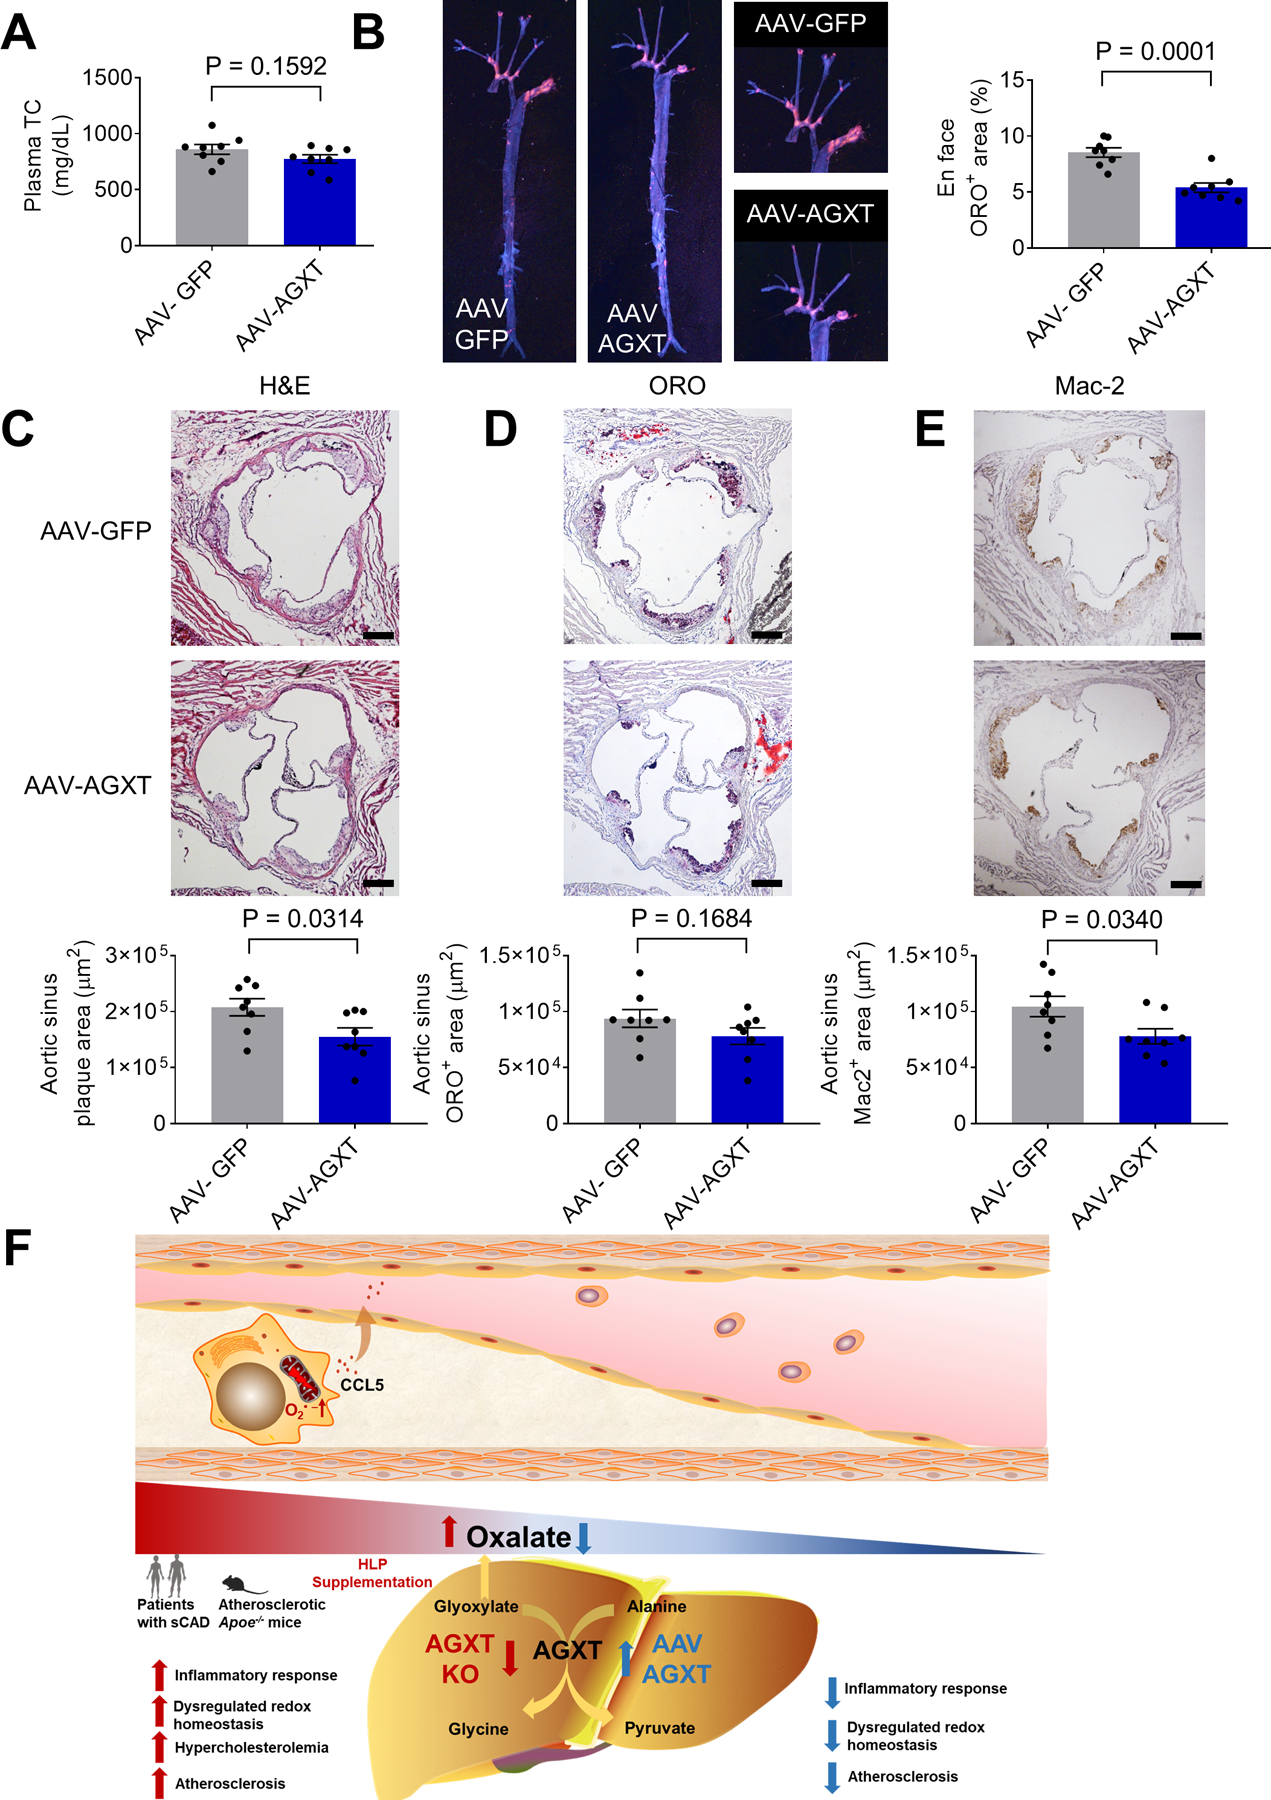
Dysregulated glycine metabolism is emerging as a common denominator in cardiometabolic diseases, but its contribution to atherosclerosis remains unclear. In this study, we demonstrate impaired glycine-oxalate metabolism through alanine-glyoxylate aminotransferase (AGXT) in atherosclerosis. As found in patients with atherosclerosis, the glycine/oxalate ratio is decreased in atherosclerotic mice concomitant with suppression of AGXT. Agxt deletion in apolipoprotein E-deficient (Apoe-/-) mice decreases the glycine/oxalate ratio and increases atherosclerosis with induction of hepatic pro-atherogenic pathways, predominantly cytokine/chemokine signaling and dysregulated redox homeostasis. Consistently, circulating and aortic C-C motif chemokine ligand 5 (CCL5) and superoxide in lesional macrophages are increased. Similar findings are observed following dietary oxalate overload in Apoe-/- mice. In macrophages, oxalate induces mitochondrial dysfunction and superoxide accumulation, leading to increased CCL5. Conversely, AGXT overexpression in Apoe-/- mice increases the glycine/oxalate ratio and decreases aortic superoxide, CCL5, and atherosclerosis. Our findings uncover dysregulated oxalate metabolism via suppressed AGXT as a driver and therapeutic target in atherosclerosis.
Keywords: AGXT; CCL5; amino acids; atherosclerosis; glycine; mitochondrial dysfunction; oxalate.
Copyright © 2021 The Author(s). Published by Elsevier Inc. All rights reserved.
Conflict of interest statement
Declaration of interests The authors declare no competing interests.
Figures
Similar articles
-
Induction of glutathione biosynthesis by glycine-based treatment mitigates atherosclerosis.Redox Biol. 2022 Jun;52:102313. doi: 10.1016/j.redox.2022.102313. Epub 2022 Apr 13. Redox Biol. 2022. PMID: 35447412 Free PMC article.
-
Deficiency in lymphotoxin β receptor protects from atherosclerosis in apoE-deficient mice.Circ Res. 2015 Apr 10;116(8):e57-68. doi: 10.1161/CIRCRESAHA.116.305723. Epub 2015 Mar 4. Circ Res. 2015. PMID: 25740843
-
Batf3-dependent CD8α+ Dendritic Cells Aggravates Atherosclerosis via Th1 Cell Induction and Enhanced CCL5 Expression in Plaque Macrophages.EBioMedicine. 2017 Apr;18:188-198. doi: 10.1016/j.ebiom.2017.04.008. Epub 2017 Apr 6. EBioMedicine. 2017. PMID: 28411140 Free PMC article.
-
Carvedilol reduces the severity of atherosclerosis in apolipoprotein E-deficient mice via reducing superoxide production.Exp Biol Med (Maywood). 2012 Sep;237(9):1039-44. doi: 10.1258/ebm.2012.012022. Epub 2012 Sep 3. Exp Biol Med (Maywood). 2012. PMID: 22946091
-
IGF-1 reduces inflammatory responses, suppresses oxidative stress, and decreases atherosclerosis progression in ApoE-deficient mice.Arterioscler Thromb Vasc Biol. 2007 Dec;27(12):2684-90. doi: 10.1161/ATVBAHA.107.156257. Epub 2007 Oct 4. Arterioscler Thromb Vasc Biol. 2007. PMID: 17916769
Cited by
-
Induction of glutathione biosynthesis by glycine-based treatment mitigates atherosclerosis.Redox Biol. 2022 Jun;52:102313. doi: 10.1016/j.redox.2022.102313. Epub 2022 Apr 13. Redox Biol. 2022. PMID: 35447412 Free PMC article.
-
Oxalate (dys)Metabolism: Person-to-Person Variability, Kidney and Cardiometabolic Toxicity.Genes (Basel). 2023 Aug 29;14(9):1719. doi: 10.3390/genes14091719. Genes (Basel). 2023. PMID: 37761859 Free PMC article. Review.
-
The interplay between nonalcoholic fatty liver disease and atherosclerotic cardiovascular disease.Front Cardiovasc Med. 2023 May 2;10:1116861. doi: 10.3389/fcvm.2023.1116861. eCollection 2023. Front Cardiovasc Med. 2023. PMID: 37200978 Free PMC article. Review.
-
Recent Advances and Perspectives of Metabolomics-Based Investigations in Coronary Heart Disease.Curr Atheroscler Rep. 2025 Jun 9;27(1):63. doi: 10.1007/s11883-025-01304-z. Curr Atheroscler Rep. 2025. PMID: 40488965 Review.
-
Bacterial Degradation of Antinutrients in Foods: The Genomic Insight.Foods. 2024 Jul 29;13(15):2408. doi: 10.3390/foods13152408. Foods. 2024. PMID: 39123599 Free PMC article. Review.
References
-
- Arafa A, Eshak ES, and Iso H (2020). Oxalates, urinary stones and risk of cardiovascular diseases. Med. Hypotheses 137:109570. - PubMed
Publication types
MeSH terms
Substances
Grants and funding
- K99 HL150233/HL/NHLBI NIH HHS/United States
- R01 HL147527/HL/NHLBI NIH HHS/United States
- R00 HL145131/HL/NHLBI NIH HHS/United States
- R01 HL141155/HL/NHLBI NIH HHS/United States
- R01 HL134569/HL/NHLBI NIH HHS/United States
- R01 HL098435/HL/NHLBI NIH HHS/United States
- R00 HL150233/HL/NHLBI NIH HHS/United States
- R01 DK106540/DK/NIDDK NIH HHS/United States
- R01 HL138139/HL/NHLBI NIH HHS/United States
- R01 HL137214/HL/NHLBI NIH HHS/United States
- R01 HL109946/HL/NHLBI NIH HHS/United States
- R01 HL145176/HL/NHLBI NIH HHS/United States
- R01 HL133497/HL/NHLBI NIH HHS/United States
- R01 HL138094/HL/NHLBI NIH HHS/United States
- U2C DK110768/DK/NIDDK NIH HHS/United States
LinkOut - more resources
Full Text Sources
Medical
Molecular Biology Databases
Research Materials
Miscellaneous
