. 2021 Jul 27;36(4):109434.
doi: 10.1016/j.celrep.2021.109434.

SAC1 regulates autophagosomal phosphatidylinositol-4-phosphate for xenophagy-directed bacterial clearance

Affiliations

SAC1 regulates autophagosomal phosphatidylinositol-4-phosphate for xenophagy-directed bacterial clearance

Kai Liu et al. Cell Rep. .

Abstract

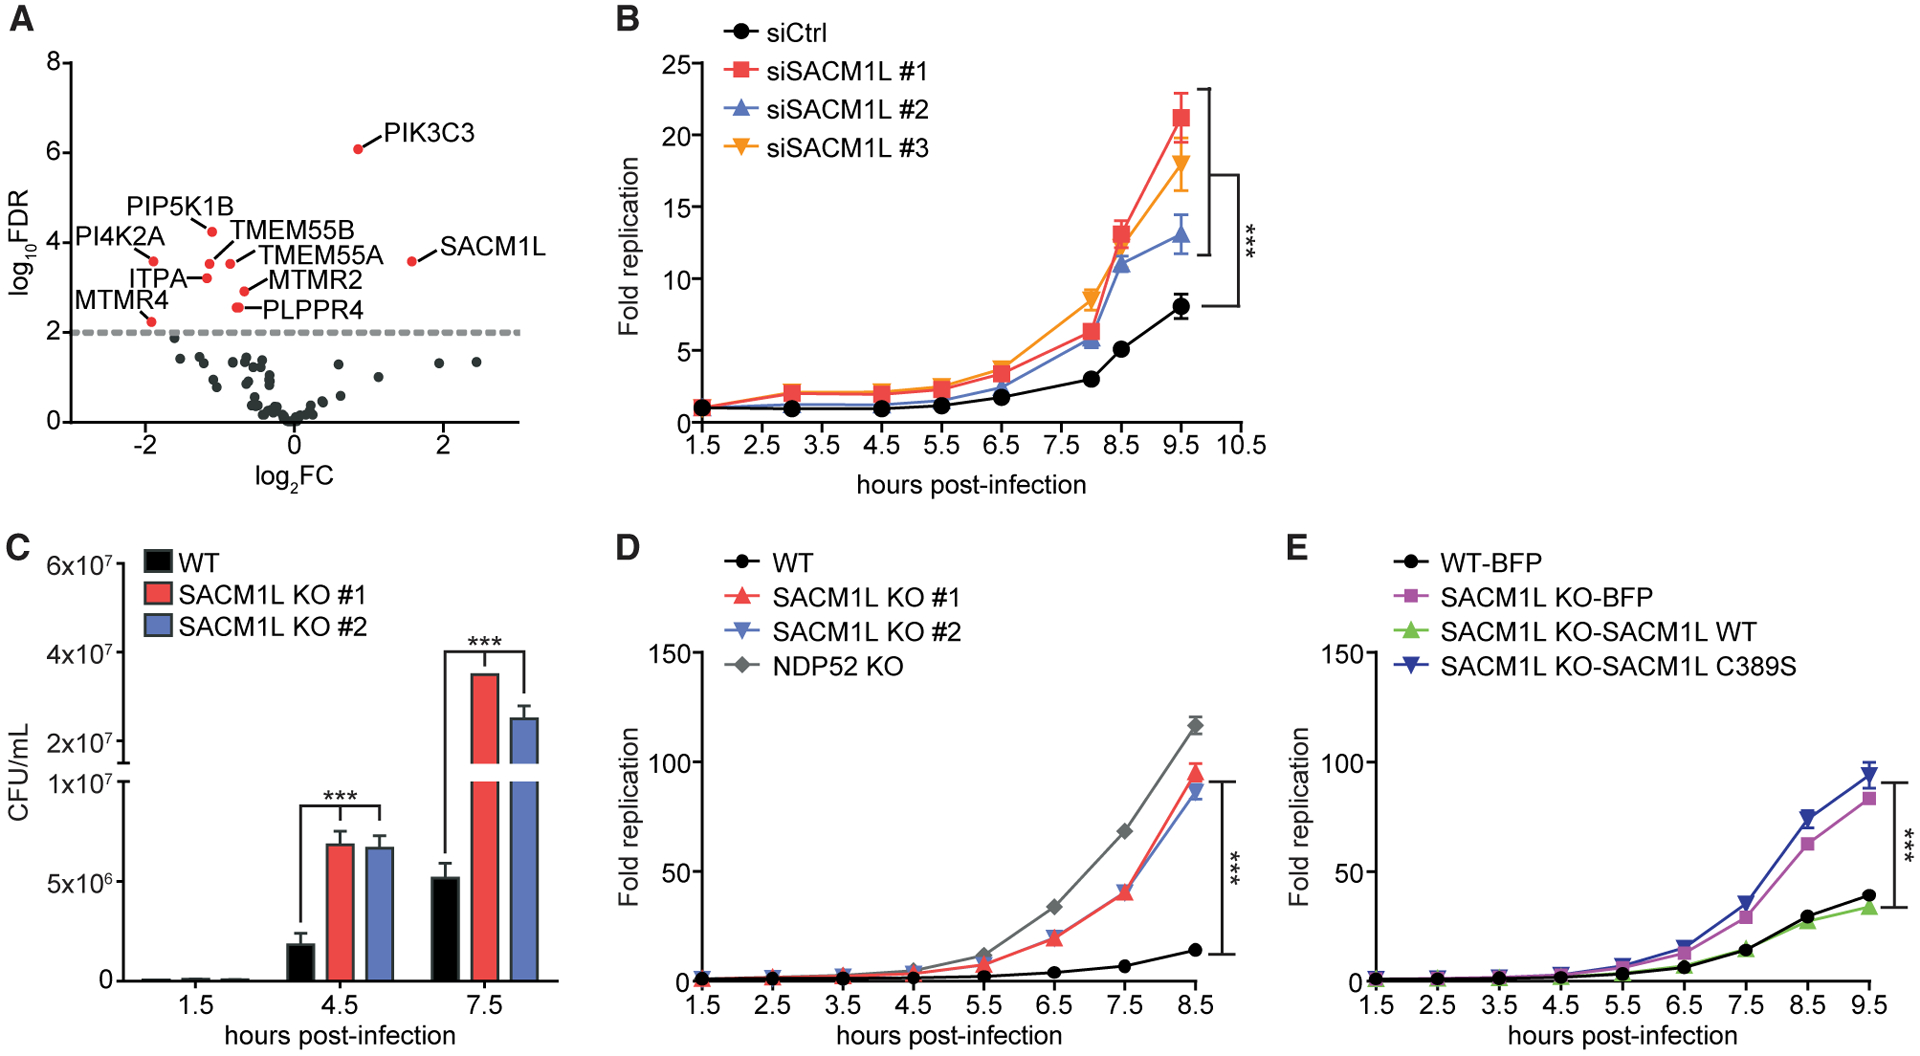
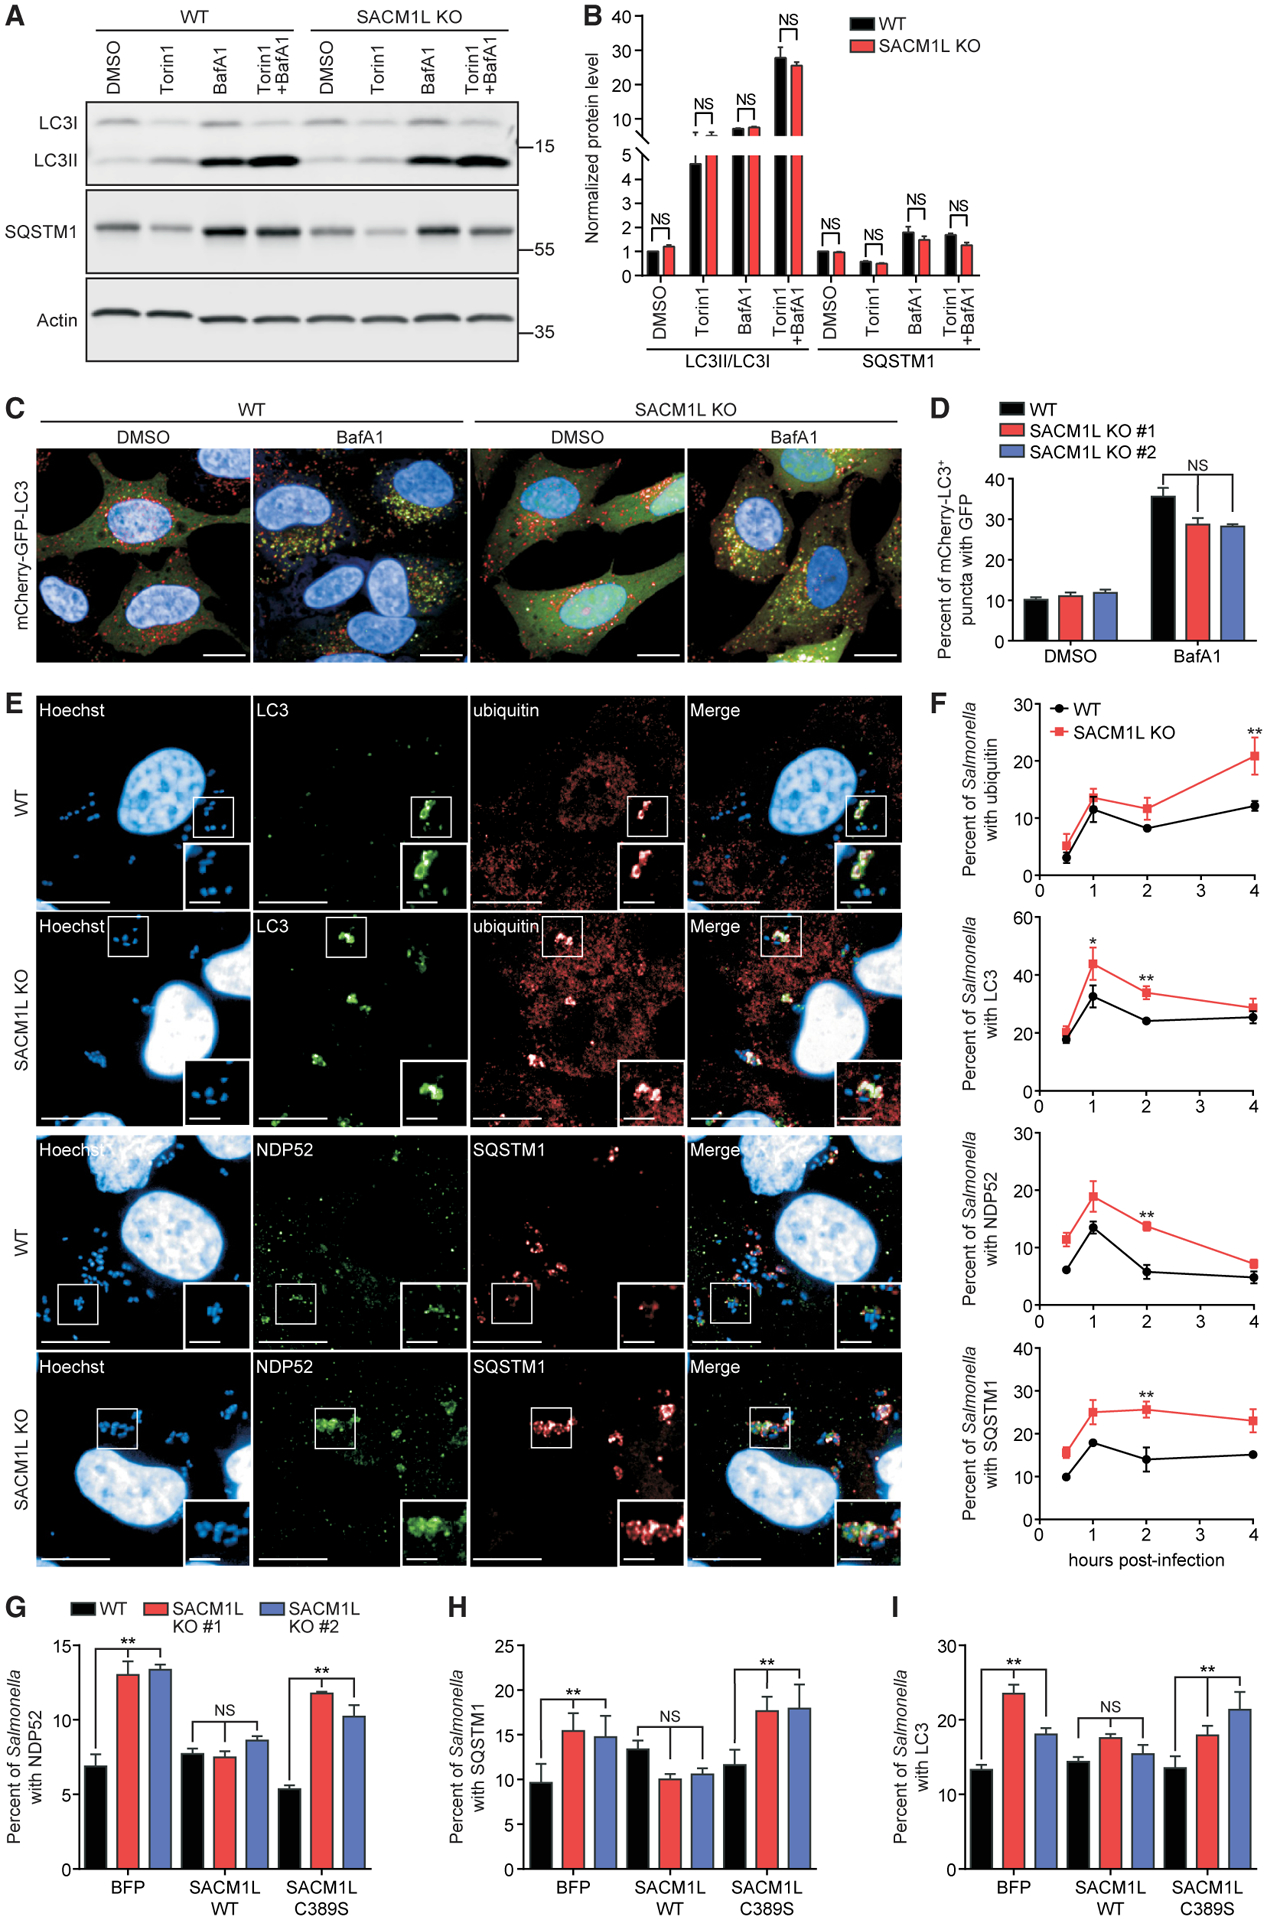
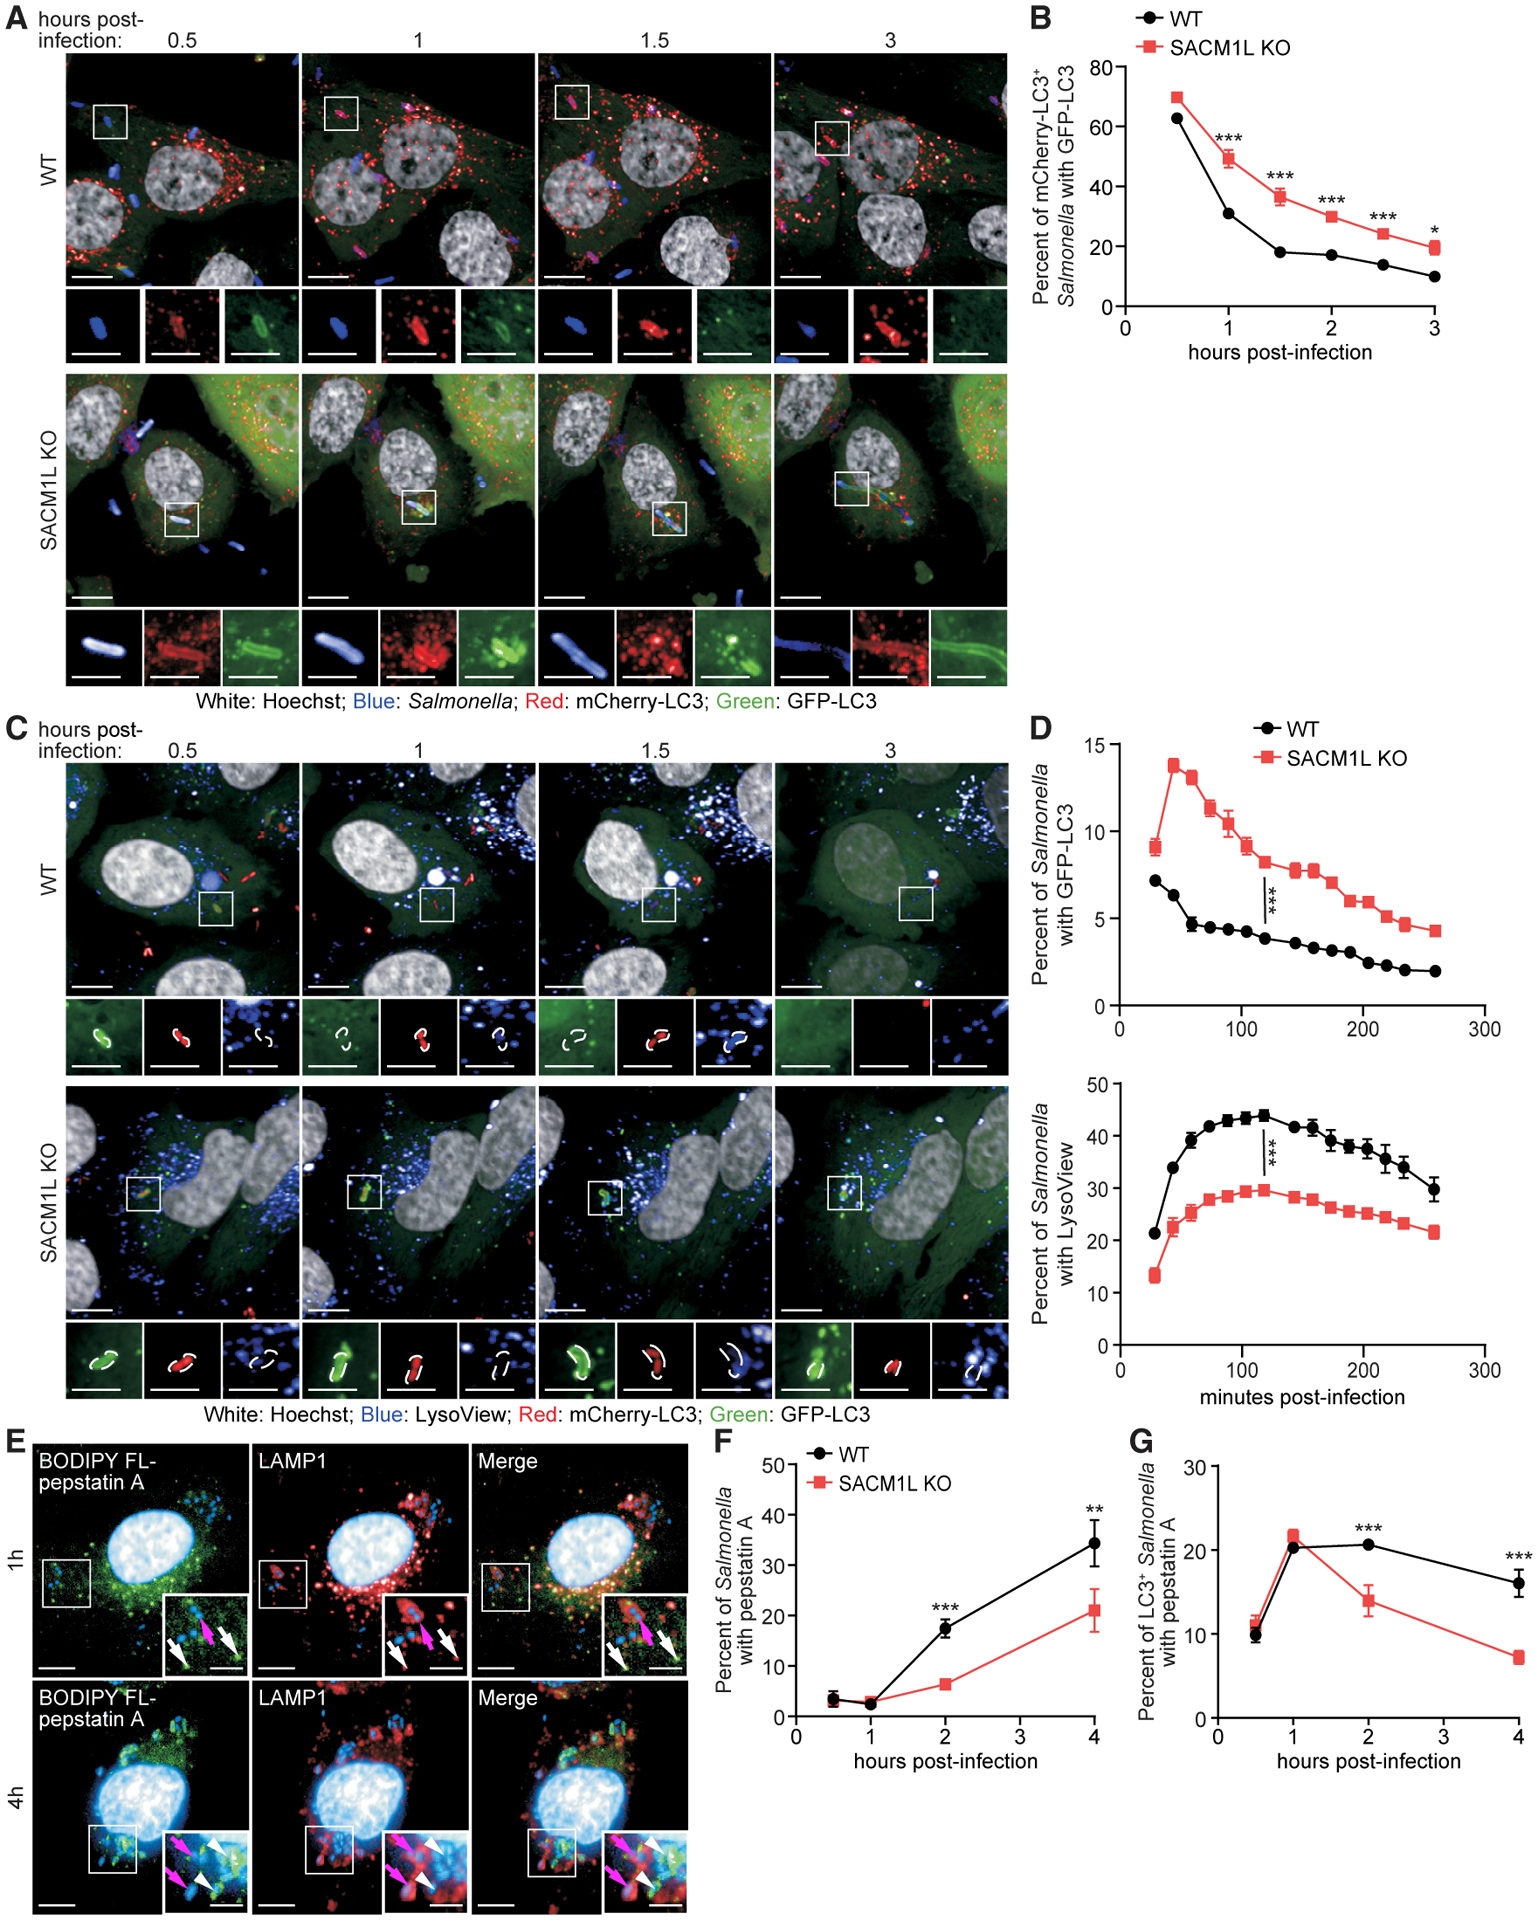
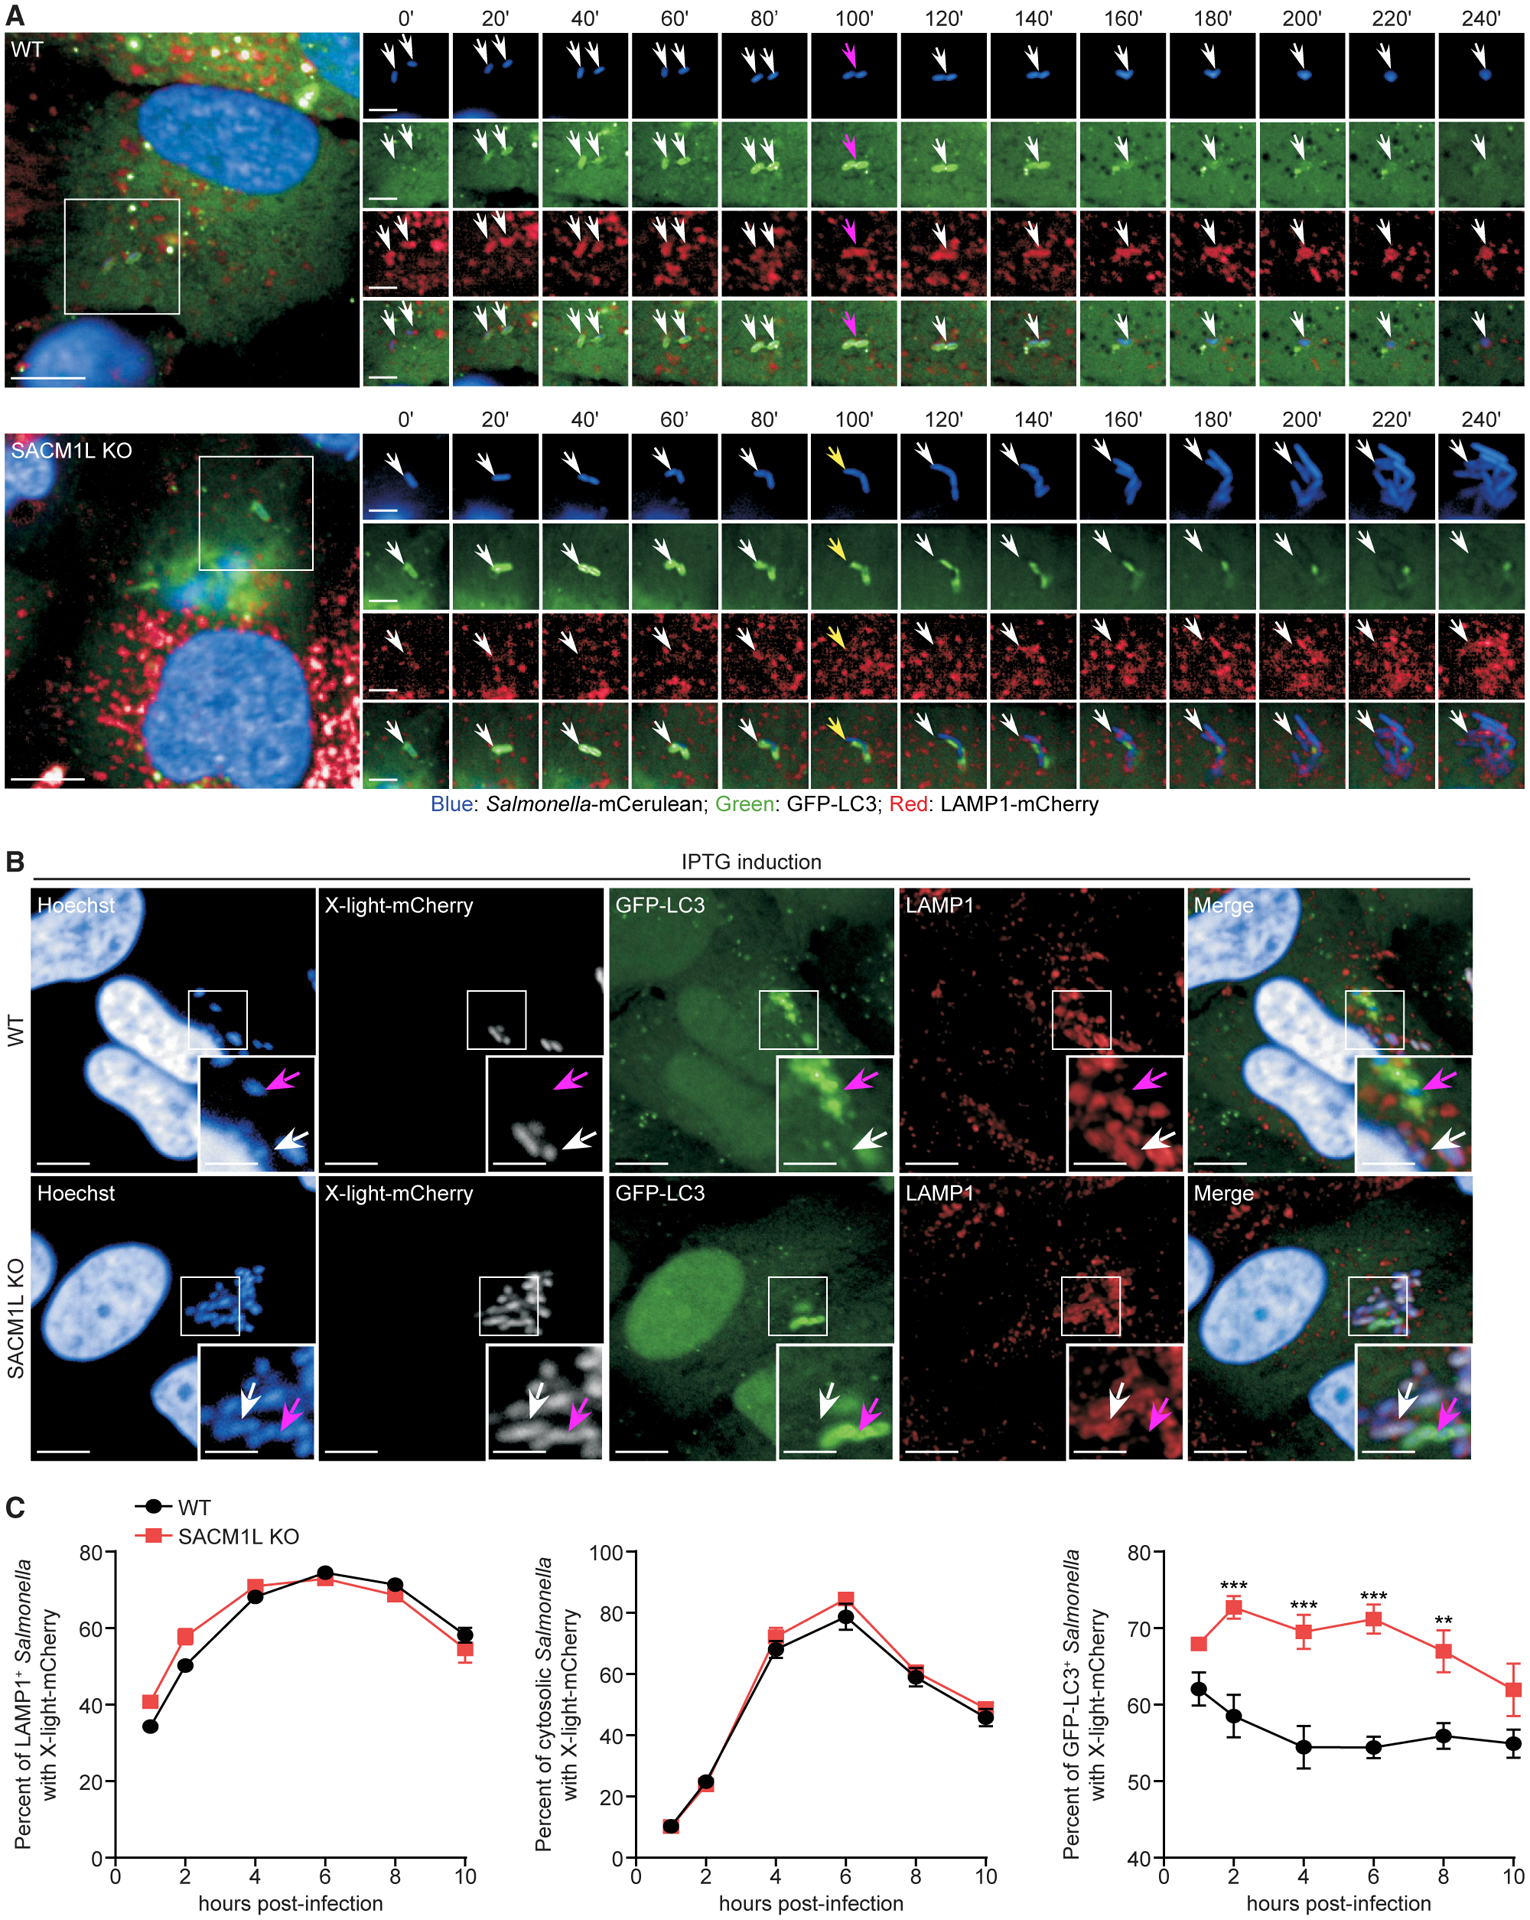
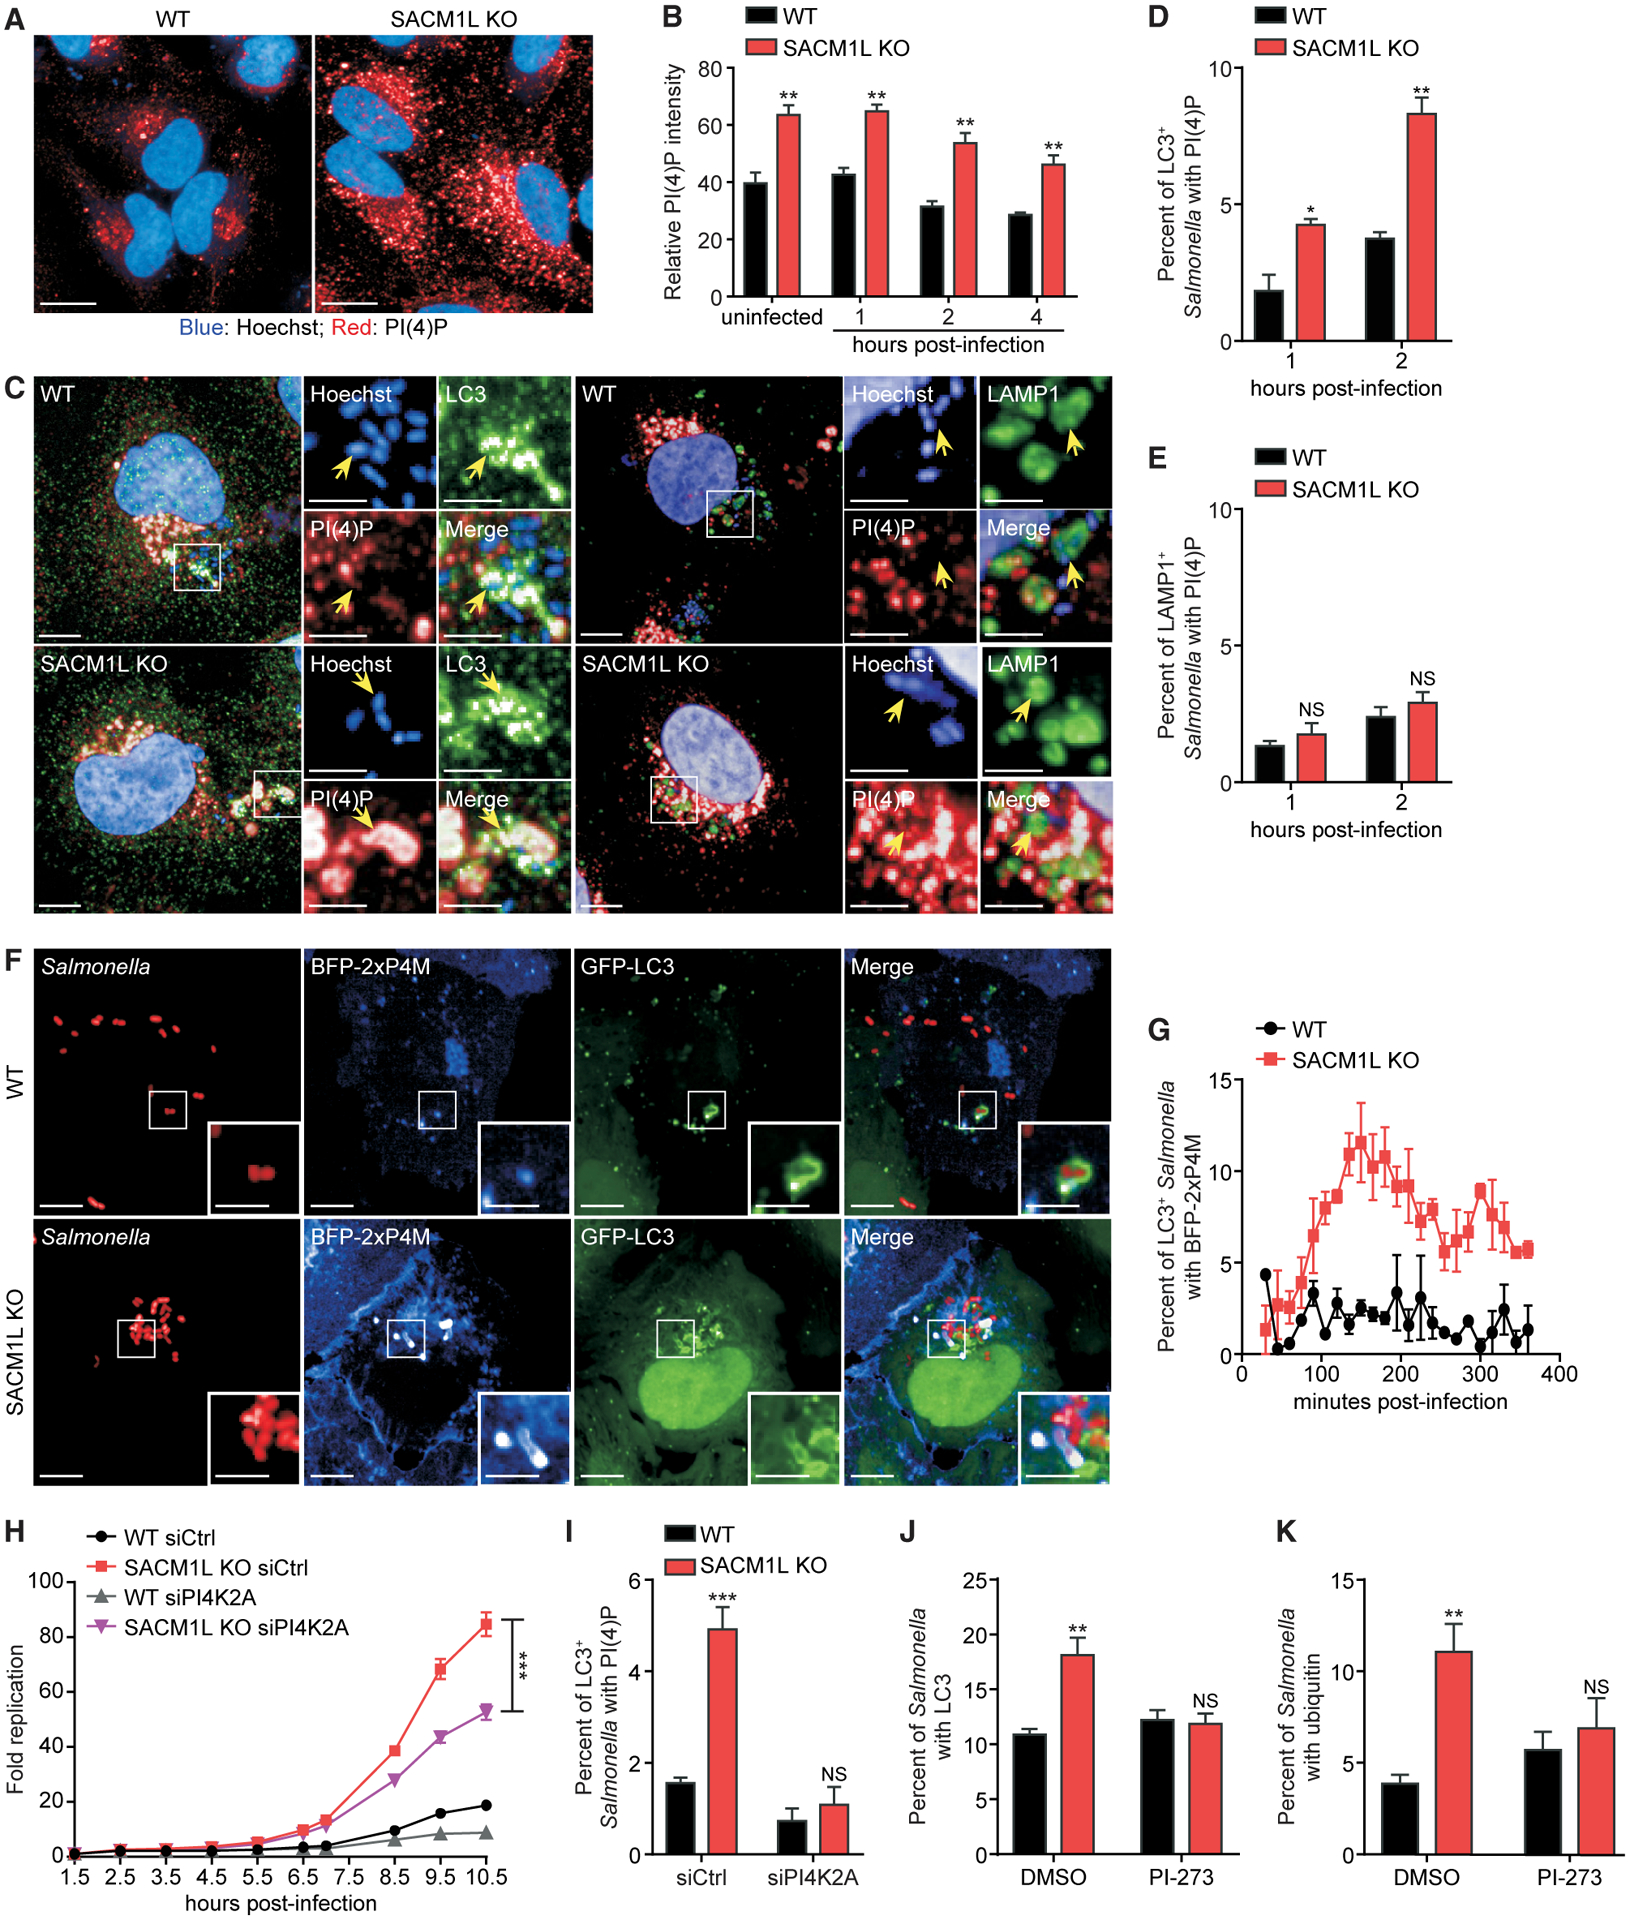
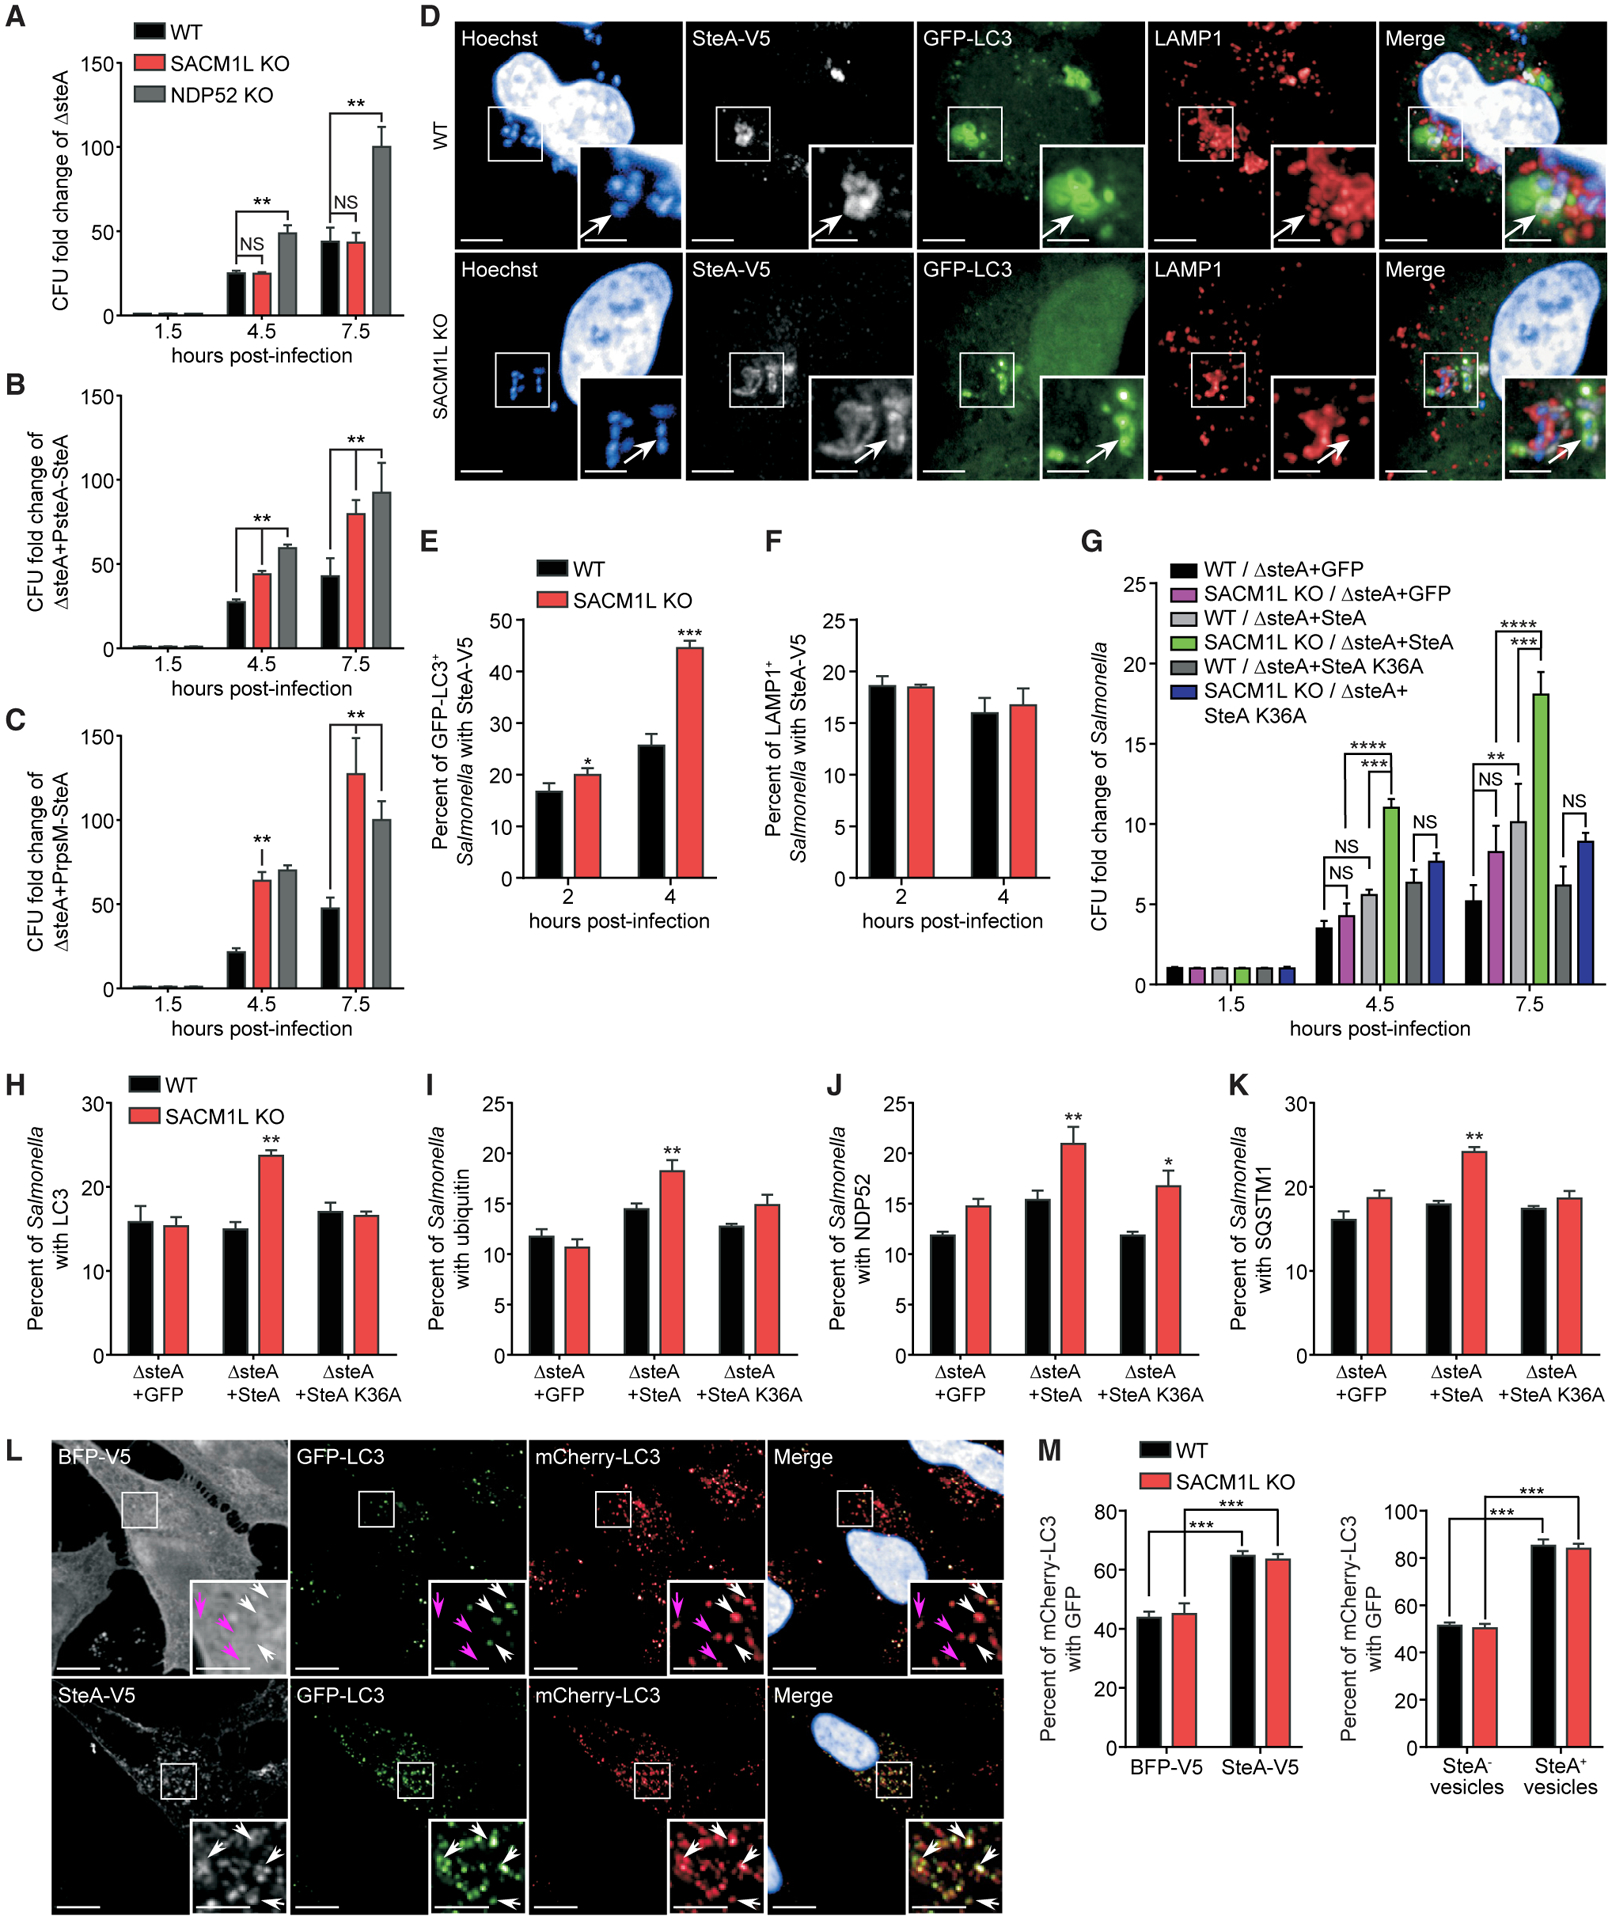
Phosphoinositides are important molecules in lipid signaling, membrane identity, and trafficking that are spatiotemporally controlled by factors from both mammalian cells and intracellular pathogens. Here, using small interfering RNA (siRNA) directed against phosphoinositide kinases and phosphatases, we screen for regulators of the host innate defense response to intracellular bacterial replication. We identify SAC1, a transmembrane phosphoinositide phosphatase, as an essential regulator of xenophagy. Depletion or inactivation of SAC1 compromises fusion between Salmonella-containing autophagosomes and lysosomes, leading to increased bacterial replication. Mechanistically, the loss of SAC1 results in aberrant accumulation of phosphatidylinositol-4-phosphate [PI(4)P] on Salmonella-containing autophagosomes, thus facilitating recruitment of SteA, a PI(4)P-binding Salmonella effector protein, which impedes lysosomal fusion. Replication of Salmonella lacking SteA is suppressed by SAC-1-deficient cells, however, demonstrating bacterial adaptation to xenophagy. Our findings uncover a paradigm in which a host protein regulates the level of its substrate and impairs the function of a bacterial effector during xenophagy.

Keywords: PI(4)P; SAC1; Salmonella; SteA; autophagosome; phosphatidylinositol; phosphoinositide phosphatase; xenophagy.


Conflict of interest statement

Declaration of interests R.J.X. is co-founder of Jnana Therapeutics and Celsius Therapeutics. These organizations had no roles in this study.

Figures

Figure 1.
Figure 1.. SAC1 restricts intracellular bacterial replication
(A) Volcano plot of siRNA screen shows log2 fold change (log2FC) of Salmonella replication compared with that of control siRNA. Data represent combined analysis from three independent experiments. Red dots indicate genes with false discovery rate (FDR) values of <0.01. (B) HeLa cells transfected with control (Ctrl) or one of three independent SACM1L-directed siRNA molecules were infected with Salmonella expressing bacterial luciferase. Luciferase levels were measured over time. Bacterial replication was normalized to baseline infection at 1.5 h post-infection. (C) CFU/mL of Salmonella at indicated times after infection of WT or SACM1L KO cells. (D) Fold change of luciferase-expressing Salmonella replication in WT, SACM1L KO, and NDP52 KO cells (E) WT cells stably expressing BFP and SACM1L KO cells stably expressing BFP, SACM1L WT, or SACM1L C389S were infected with luciferase-expressing Salmonella. Luciferase levels were measured over time. Bacterial replication was normalized to baseline infection at 1.5 h post-infection. For all quantifications, three independent experiments were analyzed using ANOVA (mean ± SEM [standard error of the mean]). ***p < 0.001. See also Figure S1 and Tables S1 and S2.
Figure 2.
Figure 2.. SAC1 activity regulates maturation of Salmonella-containing autophagosomes
(A and B) Representative immunoblot (A) and quantification (B) of LC3 conversion and SQSTM1 in WT and SACM1L KO cells treated with 0.1% DMSO, 1 μM Torin1, 200 ng/ml BafA1, or a combination of Torin1 and BafA1 for 4 h. Quantification of LC3II/LC3I ratio or SQSTM1 protein was normalized to DMSO-treated WT cells. (C and D) Representative confocal images (C) and quantification (D) of mCherry-GFP-LC3 expression in WT and SACM1L KO cells treated with DMSO or BafA1 for 4 h. Scale bars represent 20 μm. (E and F) Representative confocal images (E) and quantifications (F) of Salmonella associated with endogenous ubiquitin, LC3, NDP52, and SQSTM1 in WT and SACM1L KO cells at indicated times post-infection. Images were captured at 2 h post-infection. Insets are boxed regions magnified (1.8×). Hoechst shows HeLa cell nuclei and Salmonella. Scale bars represent 20 μm in full images and 5 μm in insets. (G–I) Percentage of Salmonella associated with endogenous NDP52 (G), SQSTM1 (H), or LC3 (I) in WT and SACM1L KO cells stably expressing BFP, SACM1L WT, or SACM1L C389S at 2 h post-infection. For all quantifications, over 500 cells were analyzed. Three independent experiments were analyzed using ANOVA (mean ± SEM). *p < 0.05, **p < 0.01; NS, not significant. See also Figure S2.
Figure 3.
Figure 3.. SAC1 loss impairs lysosomal fusion
(A and B) WT and SACM1L KO cells stably expressing mCherry-GFP-LC3 were stained with Hoechst, infected with Salmonella labeled with CellTracker deep red dye, washed, imaged by live confocal microscopy (A), and quantified (B). Percentage of GFP-LC3+ Salmonella-containing autophagosomes is shown at indicated times post-infection. (C and D) WT and SACM1L KO cells stably expressing GFP-LC3 were infected with dsRed-expressing Salmonella and stained with LysoView 633 dye and Hoechst. Live confocal microscopy images (C) and percentage (D) of Salmonella positive for GFP-LC3 (top) or LysoView dye (bottom) are shown. Magnified images (2.4×) show separated channels of the boxed region in merged images. Scale bars represent 10 μm in merged images and 5 μm in magnified images. (E) Co-immunostaining of BODIPY FL-pepstatin A, LAMP1, and Hoechst in WT cells at 1 h and 4 h post-infection. Insets are boxed regions magnified (1.8×). Scale bars represent 10 μm in full images and 5 μm in insets. Magenta arrows indicate LAMP1+pepstatin A Salmonella. White arrows (1-h image insets) indicate pepstatin A+ lysosomes. White arrowheads (4-h image insets) indicate pepstatin A+ Salmonella. (F and G) Percentage of Salmonella (F) or LC3+ Salmonella (G) associated with pepstatin A in WT and SACM1L KO cells at indicated times post-infection. For all quantifications, over 500 cells were analyzed for each condition. Three independent experiments were analyzed using ANOVA (mean ± SEM). *p < 0.05, **p < 0.01, ***p < 0.001. See also Figure S3.
Figure 4.
Figure 4.. SAC1 loss impairs the ability of autophagosomes to restrict Salmonella replication
(A) WT and SACM1L KO cells stably transduced with GFP-LC3 and LAMP1-mCherry were stained with Hoechst for 10 min, infected with mCerulean-expressing Salmonella for 15 min, washed, and imaged by live confocal microscopy every 20 min for 6 h. Timescale 0’ to 240’ is the minutes from detection of the bacteria in the cell and focal plane. White arrows indicate Salmonella. Magenta arrows (top) indicate peak GFP-LC3 intensity. Yellow arrows (bottom) show Salmonella escaping from autophagosomes prior to replicating in the host cytoplasm. Image series are boxed regions magnified (1.8×). Scale bars represent 10 μm in image series and 5 μm in full images. (B) Representative confocal images of IPTG-induced mCherry expression in Salmonella within LAMP1+ (SCV) or GFP-LC3+ (autophagosome) compartments in WT and SACM1L KO cells at 6 h post-infection. Magenta arrows indicate GFP-LC3+ Salmonella. White arrows indicate LAMP1+ Salmonella. Insets are boxed regions magnified (2×). Scale bars represent 10 μm in full images and 5 μm in insets. (C) Percentage of induced mCherry signal in LAMP1+, GFP-LC3LAMP1, (cytosolic), or GFP-LC3+ Salmonella in WT and SACM1L KO cells. For quantification, over 3,000 bacteria were analyzed. Two independent experiments were analyzed using ANOVA (mean ± SEM). **p < 0.01, ***p < 0.001. See also Figure S4.
Figure 5.
Figure 5.. SAC1 regulates PI(4)P levels on Salmonella-containing autophagosomes
(A) Immunostaining of endogenous PI(4)P in WT and SACM1L KO cells. Hoechst dye shows nuclei. Scale bars represent 20 μm. (B) Relative PI(4)P staining intensity in uninfected or Salmonella-infected WT and SACM1L KO cells at indicated times post-infection. (C) Representative confocal images of PI(4)P staining on endogenous LC3+ or LAMP1+ Salmonella in WT and SACM1L KO cells at 2 h post-infection. Insets are boxed regions magnified (2.8×). Hoechst dye shows nuclei and Salmonella. Scale bars represent 10 μm in full images and 5 μm in insets. (D and E) Percentage of LC3+ (D) or LAMP1+ (E) Salmonella also positive for PI(4)P at indicated times post-infection. For quantification, over 2,000 bacteria were analyzed. (F and G) Representative confocal images (F) and quantification (G) of co-localization of BFP-2xP4M and GFP-LC3+ Salmonella in WT and SACM1L KO cells. Insets are boxed regions magnified (2.5×). Scale bars represent 10 μm in full images and 5 μm in insets. Data were collected every 15 min for 6 h. For quantification, over 1,000 bacteria were analyzed. (H) Fold change of luciferase-expressing Salmonella replication in WT and SACM1L KO cells transfected with control or PI4K2ɑ siRNA for 48 h prior to infection. Luciferase levels were measured over time. Bacterial replication was normalized to baseline infection. (I) Percentage of LC3+ Salmonella associated with PI(4)P in WT and SACM1L KO cells transfected with control or PI4K2ɑ siRNA 48 h prior to infection. (J and K) Percentage of Salmonella associated with LC3 (J) and ubiquitin (K) in WT and SACM1L KO cells pretreated with DMSO or PI4K2ɑ-specific inhibitor PI-273 (500 nM) for 1 h before infection, then fixed, and stained 2 h after infection. Unless indicated otherwise, over 500 cells were analyzed for quantification. Three independent experiments were analyzed using ANOVA (mean ± SEM). *p < 0.05, **p < 0.01, ***p < 0.001; NS, not significant. See also Figure S5 and Table S2.
Figure 6.
Figure 6.. SteA, a Salmonella effector protein, prevents maturation of Salmonella-containing autophagosomes in a PI(4)P-dependent manner
(A–C) CFU fold change for the ΔsteA mutant (A) and ΔsteA mutant reconstituted with PsteA-SteA (B) or PrpsM-SteA (C) at indicated times post-infection of WT and SACM1L KO cells normalized to the 1.5-h time point. (D) Representative confocal images of Salmonella associated with SteA-V5 (white arrows) in WT and SACM1L KO cells at 2 h post-infection with ΔsteA reconstituted with SteA-V5. Insets are boxed regions magnified (2×). Scale bars represent 10 μm in full images and 5 μm in insets. (E and F) Percentage of LC3+ (E) or LAMP1+ (F) Salmonella associated with SteA-V5 at indicated times post-infection. (G) CFU fold changes normalized to the 1.5-h time points for Salmonella strains at indicated times post-infection of WT and SACM1L KO cells. (H–K) Percentage of LC3+ (H), ubiquitin+ (I), NDP52+ (J), or SQSTM1+ (K) Salmonella in WT and SACM1L KO cells at 2 h post-infection. (L and M) Representative confocal images (L) and quantification (M) of mCherry-GFP-LC3 in WT and SACM1L KO cells transiently expressing BFP-V5 or SteA-V5 after 24 h. Hoechst shows nuclei. Scale bars represent 5 μm. Arrows indicate mCherry+GFP+ (white) and mCherry+GFP (magenta) vesicles. For all quantifications, over 500 cells were analyzed. Three independent experiments were analyzed using ANOVA (mean ± SEM). *p < 0.05, **p < 0.01, ***p < 0.001, ****p < 0.0001; NS, not significant. See also Figure S6.

Similar articles

Cited by

References

    1. Albanesi J, Wang H, Sun HQ, Levine B, and Yin H (2015). GABARAP-mediated targeting of PI4K2A/PI4KIIα to autophagosomes regulates PtdIns4P-dependent autophagosome-lysosome fusion. Autophagy 11, 2127–2129. - PMC - PubMed
    1. Asrat S, de Jesús DA, Hempstead AD, Ramabhadran V, and Isberg RR (2014). Bacterial pathogen manipulation of host membrane trafficking. Annu. Rev. Cell Dev. Biol 30, 79–109. - PubMed
    1. Azimi T, Zamirnasta M, Sani MA, Soltan Dallal MM, and Nasser A (2020). Molecular Mechanisms of Salmonella Effector Proteins: A Comprehensive Review. Infect. Drug Resist 13, 11–26. - PMC - PubMed
    1. Baba T, Toth DJ, Sengupta N, Kim YJ, and Balla T (2019). Phosphatidylinositol 4,5-bisphosphate controls Rab7 and PLEKHM1 membrane cycling during autophagosome-lysosome fusion. EMBO J. 38, e100312. - PMC - PubMed
    1. Barnett TC, Liebl D, Seymour LM, Gillen CM, Lim JY, Larock CN, Davies MR, Schulz BL, Nizet V, Teasdale RD, and Walker MJ (2013). The globally disseminated M1T1 clone of group A Streptococcus evades autophagy for intracellular replication. Cell Host Microbe 14, 675–682. - PMC - PubMed

Publication types