. 2021 Jul 27;36(4):109459.
doi: 10.1016/j.celrep.2021.109459.

In vivo isotope tracing reveals the versatility of glucose as a brown adipose tissue substrate

Affiliations

In vivo isotope tracing reveals the versatility of glucose as a brown adipose tissue substrate

Su Myung Jung et al. Cell Rep. .

Abstract

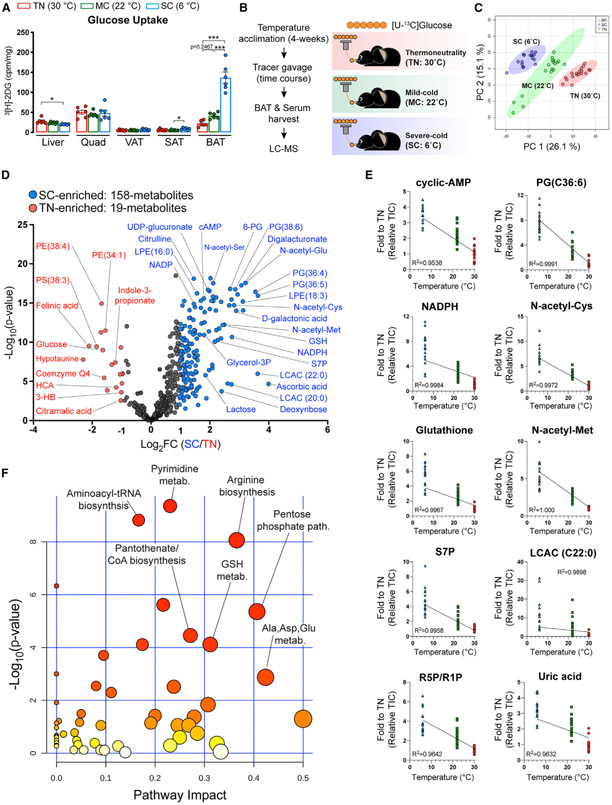
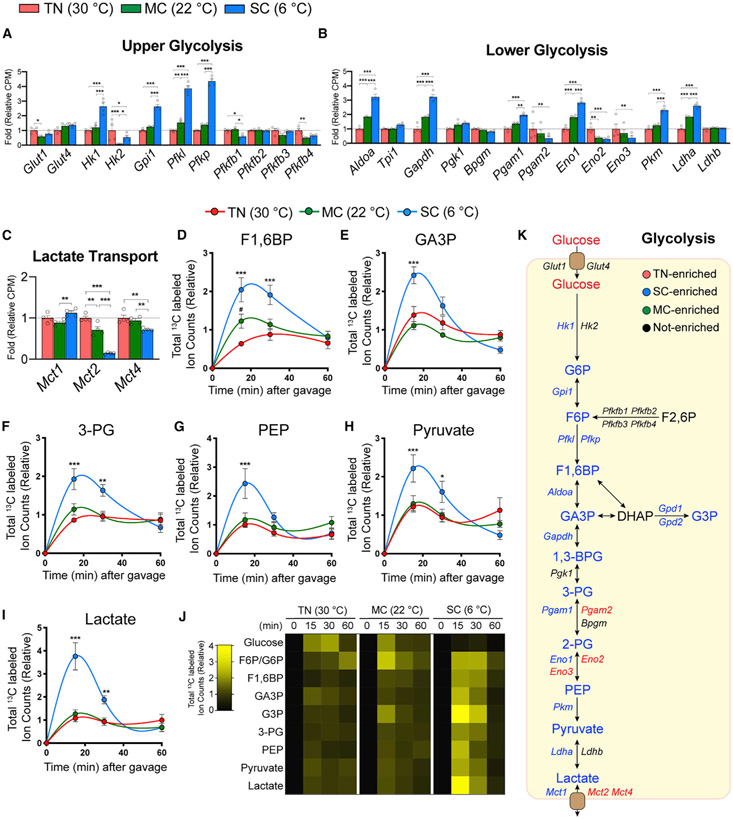
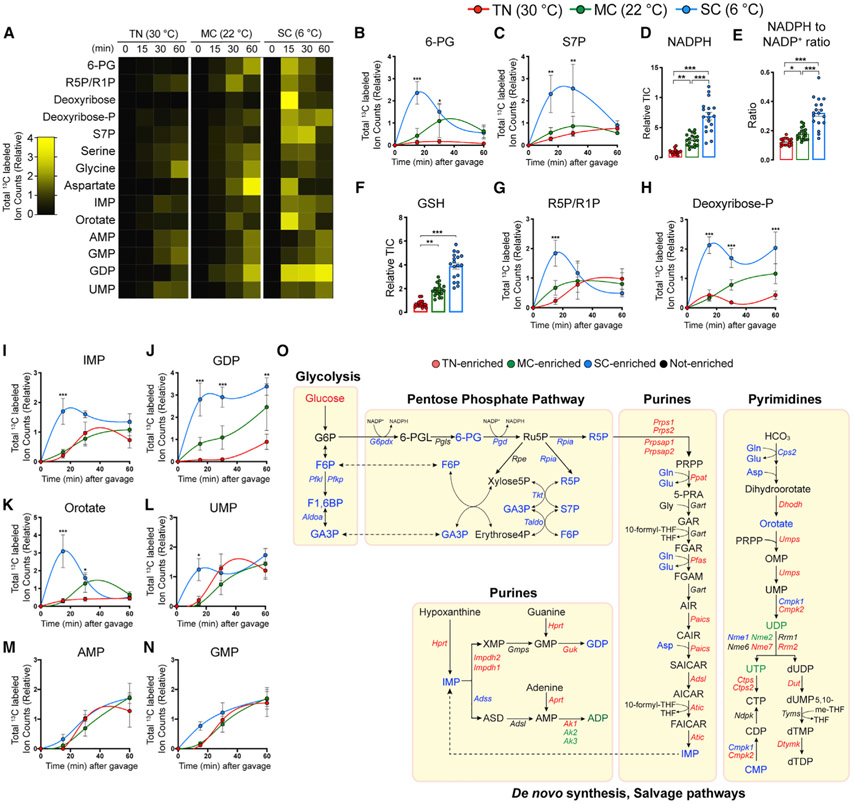
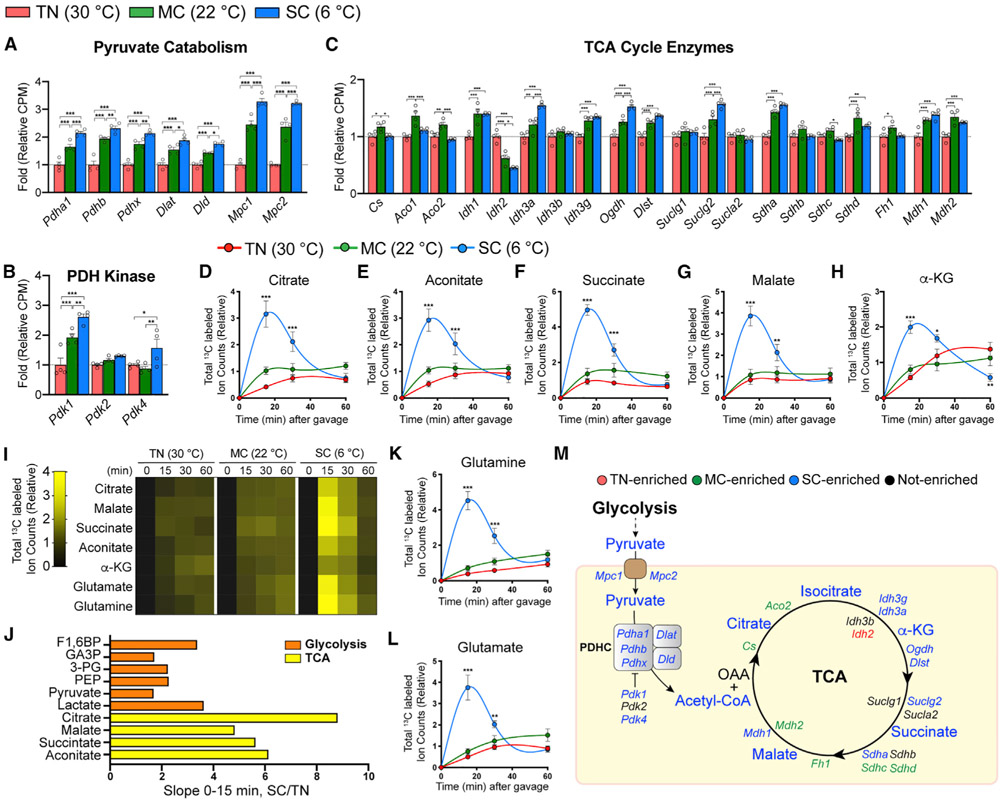
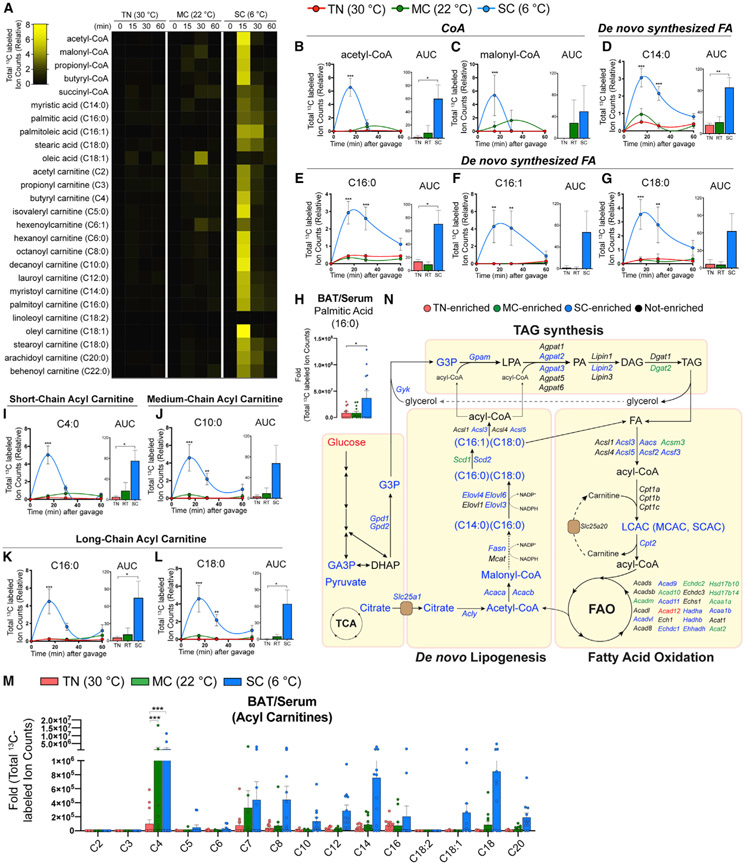
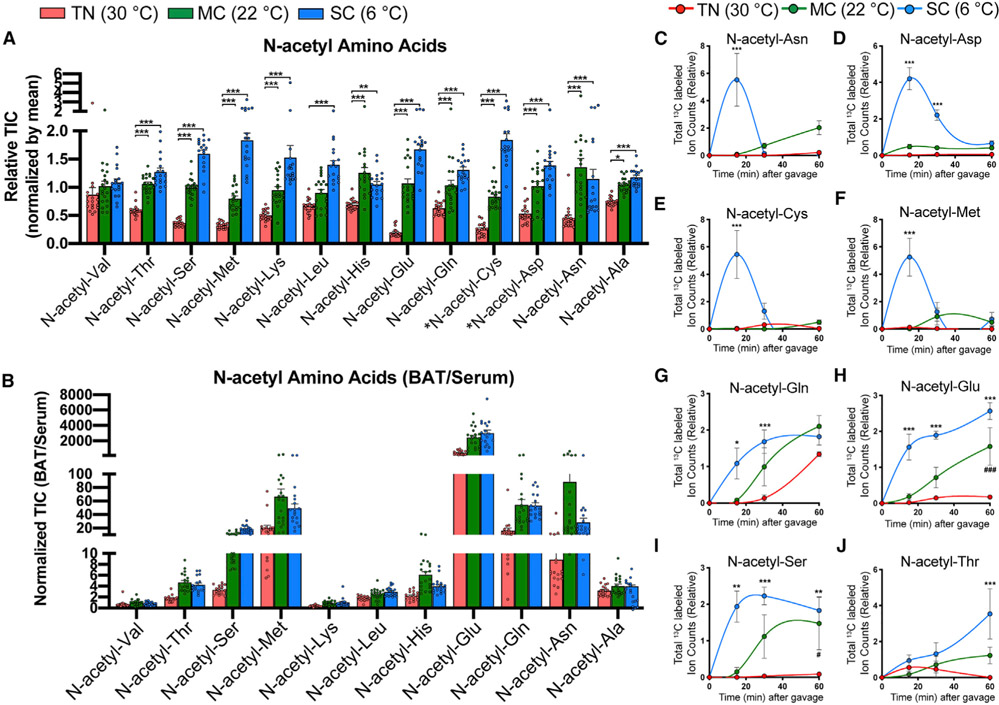
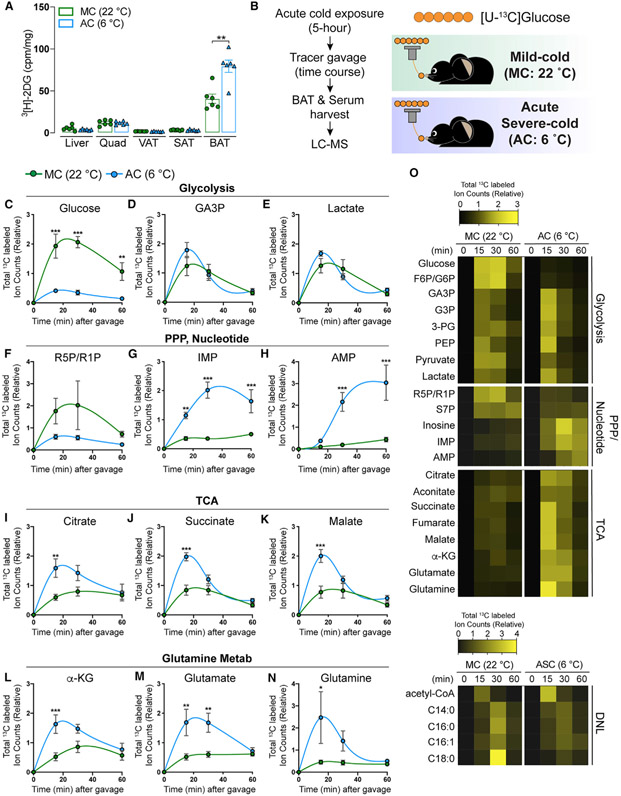
Active brown adipose tissue (BAT) consumes copious amounts of glucose, yet how glucose metabolism supports thermogenesis is unclear. By combining transcriptomics, metabolomics, and stable isotope tracing in vivo, we systematically analyze BAT glucose utilization in mice during acute and chronic cold exposure. Metabolite profiling reveals extensive temperature-dependent changes in the BAT metabolome and transcriptome upon cold adaptation, discovering unexpected metabolite markers of thermogenesis, including increased N-acetyl-amino acid production. Time-course stable isotope tracing further reveals rapid incorporation of glucose carbons into glycolysis and TCA cycle, as well as several auxiliary pathways, including NADPH, nucleotide, and phospholipid synthesis pathways. Gene expression differences inconsistently predict glucose fluxes, indicating that posttranscriptional mechanisms also govern glucose utilization. Surprisingly, BAT swiftly generates fatty acids and acyl-carnitines from glucose, suggesting that lipids are rapidly synthesized and immediately oxidized. These data reveal versatility in BAT glucose utilization, highlighting the value of an integrative-omics approach to understanding organ metabolism.

Keywords: BAT; brown adipocyte; brown adipose tissue; brown fat; glucose metabolism; lipid metabolism; metabolomics; stable isotope tracing; temperature acclimation; thermogenesis.


Conflict of interest statement

Declaration of interests The authors declare no competing interests.

Figures

Figure 1.
Figure 1.. Severe cold (SC) profoundly remodels BAT’s metabolic landscape
(A) Uptake of orally delivered 3H-2-deoxy-glucose (3H-2DG) by the indicated organs in mice acclimated to thermoneutrality (TN; red, 30°C), mild cold (MC; green, 22°C), and SC (blue, 6°C) for 4 weeks (n = 6). For subcutaneous adipose tissue (SAT) and visceral adipose tissue (VAT), inguinal WAT and perigonadal WAT were collected, respectively. (B) Experimental strategy for in vivo isotope tracing and metabolomics of BAT in mice adapted to different temperatures. Mice were acclimated to TN, MC, and SC for 4 weeks. Then, mice received [U-13C]-glucose tracer via oral gavage. Metabolite levels, labeling in serum, and BAT were measured at multiple time points after gavage by LC-MS (n = 5–7 per time point). (C) Principal-component analysis (PCA) of BAT metabolome in mice adapted to TN, MC, and SC (n = 17–20). (D) Volcano plot of BAT metabolome in mice adapted to TN versus SC. The colored dots (blue or red) indicate significantly enriched metabolites at each group (1 ≥ Log2 fold changes compared with counterpart, p < 0.05 after false discovery rate [FDR] correction) (n = 17–20). (E) Metabolites showing a linear relationship between temperatures and fold change of pool size normalized to TN. (F) Metabolic pathway analysis of BAT metabolome in mice adapted to TN versus SC. The top pathways are ranked by the adjusted p values for permutation per pathway (y axis) and the total number of hits per pathway (x axis). The color graduated from white to yellow, orange, and red; circle size (from small to large) and the increase in values of both x and y represent the degree of significance. TIC, total ion count.
Figure 2.
Figure 2.. Integrative transcriptomics and metabolic tracing analysis reveal increased BAT glycolytic flux upon SC
(A–C) Relative gene levels of upper or lower glycolytic enzymes and glucose or lactate transporters in BAT from mice acclimated to TN (red, 30°C), MC (green, 22°C), and SC (SC; blue, 6°C) for 4 weeks, measured by RNA sequencing (n = 4). (D–I) Total labeled carbons in the indicated glycolytic intermediates of BAT (n = 5–7). (J) Heatmap showing relative total labeled carbons in the indicated glycolytic metabolites (n = 5–7). (K) Glycolysis pathway. Colors indicate a temperature group showing significantly higher labeling or transcript abundance than other groups. Data are mean ± SEM. Statistical significance was calculated using two-way ANOVA with Tukey’s multiple comparison test: *,#p < 0.05; **,##p < 0.01; ***,###p < 0.001 (TN versus SC, TN versus MC).
Figure 3.
Figure 3.. SC triggers BAT glucose flux into the pentose phosphate pathway that contributes to antioxidant and nucleotide synthesis
(A) Heatmap showing relative total labeled carbons in the BAT metabolic intermediates in the pentose-phosphate pathway, nucleotides, and key amino acids in nucleotide biosynthesis from mice acclimated to TN (30°C), MC (22°C), and SC (6°C) for 4 weeks followed by fed [U-13C]-glucose via oral gavage (n = 5–7). (B and C) Total labeled carbons in the pentose phosphate pathway intermediates of BAT (TN: red, 30°C; MC: green, 22°C; SC: blue, 6°C; n = 5–7). (D) Relative abundance of total NADPH of BAT (n = 17–20). (E) Relative abundance of NADPH over NADP+ of BAT (n = 17–20). (F) Relative abundance of total glutathione (GSH) of BAT (n = 17–20). (G and H) Total labeled carbons in the ribose phosphate species of BAT (n = 5–7). (I–N) Total labeled carbons in the purine/pyrimidine biosynthesis intermediates of BAT (n = 5–7). (O) Branch pathways of glycolysis, including pentose phosphate pathway and nucleotide, glycogen, and hexosamine biosynthesis and nucleotide-sugar pathways. Data are mean ± SEM. Statistical significance was calculated using two-way ANOVA with Tukey’s multiple comparison test: *,#p < 0.05; **,##p < 0.01; ***,###p < 0.001 (TN versus SC, TN versus MC).
Figure 4.
Figure 4.. SC, but not MC, increases glucose flux into the TCA cycle
(A–C) Relative gene levels of pyruvate catabolism and transporters, PDH kinases, and TCA cycle enzymes in BAT from mice acclimated to TN (red, 30°C), MC (green, 22°C), or SC (blue, 6°C) for 4 weeks, measured by RNA sequencing (n = 4). (D–H) Total labeled carbons in the TCA intermediates of BAT from mice acclimated to TN, MC, and SC for 4 weeks, followed by [U-13C]-glucose provision via oral gavage (n = 5–7). (I) Heatmap showing relative total labeled carbons in the TCA intermediates of BAT (n = 5–7). (J) Bar graph showing each metabolite’s relative slope(0-15 min) of SC over TN. (K and L) Total labeled carbons in glutamine (K) and glutamate (L) of BAT (n = 5–7). (M) TCA cycle map. Colors indicate a temperature group showing significantly higher labeling or transcript abundance than other groups. Data are mean ± SEM. Statistical significance was calculated using two-way ANOVA with Tukey’s multiple comparison test: *,#p < 0.05; **,##p < 0.01; ***,###p < 0.001 (TN versus SC, TN versus MC).
Figure 5.
Figure 5.. BAT glucose usage for fatty acid synthesis and oxidation is accelerated by SC, but not by MC
(A) Heatmap showing relative total labeled carbons of fatty acids and their precursors and acyl-carnitine species in BAT from mice acclimated to TN (30°C), MC (22°C), and SC (6°C) for 4 weeks, followed by [U-13C]-glucose provision via oral gavage (n = 5–7). (B and C) Total labeled carbons in the CoA species of BAT and their area under curve (AUC0–60 min) (TN: red, 30°C; MC: green, 22°C; SC: blue, 6°C; n = 5–7). (D–G) Total labeled carbons in the fatty acids of BAT and their AUC0–60 min (n = 5–7). (H) Relative total labeled carbons in palmitic acid of BAT over serum (n = 12–13). (I–L) Total labeled carbons in the acyl carnitines of BAT and their AUC0–60 min (n = 5–7). (M) Relative total labeled carbons in the acyl carnitine species of BAT over serum (n = 12–13). (N) Pathway map of de novo lipogenesis, triacylglycerol (TAG) synthesis, and fatty acid oxidation. Colors indicate a temperature group showing significantly higher labeling or transcript abundance than other groups. Data are mean ± SEM. Statistical significance was calculated using two-way ANOVA with Tukey’s multiple comparison test: *,#p < 0.05; **,##p < 0.01; ***,###p < 0.001 (TN versus SC, TN versus MC).
Figure 6.
Figure 6.. N-acetyl-amino acids are highly enriched and produced in BAT upon cold
(A) Relative abundance of N-acetyl-amino acids in BAT from mice acclimated to TN (red, 30°C), MC (green, 22°C), and SC (blue, 6°C) for 4 weeks, followed by [U-13C]-glucose provision via oral gavage (n = 17–20). *Note that N-acetyl-cysteine (N-acetyl-Cys) and N-acetyl-aspartate (N-acetyl-Asp) were detected only within BAT, but not in serum. (B) Relative abundance of N-acetyl-amino acids in BAT over serum (n = 17–20). (C–J) Total labeled carbons in the N-acetyl-amino acids of BAT (n = 5–7). Data are mean ± SEM. Statistical significance was calculated using two-way ANOVA with Tukey’s multiple comparison test: *,#p < 0.05; **,##p < 0.01; ***,###p < 0.001 (TN versus SC, TN versus MC).
Figure 7.
Figure 7.. Acute cold increases glucose flux into glycolysis, TCA cycle, and pentose phosphate pathway, but not de novo fatty acid synthesis
(A) Uptake of orally delivered 3H-2DG by the indicated organs in mice acutely challenged with SC (AC: blue, 6°C, 5 h) or acclimated to standard room temperature conditions, which is MC for mice (MC: green, 22°C) (n = 6). For SAT and VAT, inguinal WAT and perigonadal WAT were collected, respectively. (B) Experimental strategy for in vivo isotope tracing and metabolomics of BAT in mice acutely challenged with SC. Mice were exposed to SC for 5 h (AC: blue, 6°C). As a control, mice acclimated to MC (green, 22°C) were used. Then, mice received [U-13C]-glucose tracer via oral gavage. Metabolite levels, labeling in serum, and BAT were measured at multiple time points after gavage by LC-MS (n = 6–8 per time point). (C–E) Total labeled carbons in the glycolytic intermediates of BAT samples from mice acutely exposed to AC and their counterpart (MC) followed by feeding with [U-13C]-glucose via oral gavage (n = 6–8). (F–H) Total labeled carbons in the pentose phosphate pathway and nucleotide biosynthesis of BAT (n = 6–8). (I–K) Total labeled carbons in the TCA intermediates of BAT (n = 6–8). (L–N) Total labeled carbons in α-ketoglutarate (L), glutamate (M), and glutamine (N) (n = 6–8). (O) Heatmap showing relative total labeled carbons in the indicated metabolites (n = 6–8). Data are mean ± SEM. Statistical significance was calculated using two-way ANOVA with Tukey’s multiple comparison test: *,#p < 0.05; **,##p < 0.01; ***,###p < 0.001 (TN versus SC, TN versus MC).

References

    1. Adlanmerini M, Carpenter BJ, Remsberg JR, Aubert Y, Peed LC, Richter HJ, and Lazar MA (2019). Circadian lipid synthesis in brown fat maintains murine body temperature during chronic cold. Proc. Natl. Acad. Sci. USA 116, 18691–18699. - PMC - PubMed
    1. Aksnes H, Ree R, and Arnesen T (2019). Co-translational, Post-translational, and Non-catalytic Roles of N-Terminal Acetyltransferases. Mol. Cell 73, 1097–1114. - PMC - PubMed
    1. Allred JB, and Guy DG (1969). Determination of coenzyme A and acetyl CoA in tissue extracts. Anal. Biochem 29, 293–299. - PubMed
    1. Arnesen T (2011). Towards a functional understanding of protein N-terminal acetylation. PLoS Biol. 9, e1001074. - PMC - PubMed
    1. Ballinger MA, and Andrews MT (2018). Nature’s fat-burning machine: brown adipose tissue in a hibernating mammal. J. Exp. Biol 221 (Suppl 1), jeb162586. - PMC - PubMed

Publication types