Observational Study
. 2022 Jan:65:84-92.
doi: 10.1016/j.annepidem.2021.07.007. Epub 2021 Jul 25.

Increasing concentration of COVID-19 by socioeconomic determinants and geography in Toronto, Canada: an observational study

Affiliations
Observational Study

Increasing concentration of COVID-19 by socioeconomic determinants and geography in Toronto, Canada: an observational study

Sharmistha Mishra et al. Ann Epidemiol. 2022 Jan.

Abstract

Background: Inequities in the burden of COVID-19 were observed early in Canada and around the world, suggesting economically marginalized communities faced disproportionate risks. However, there has been limited systematic assessment of how heterogeneity in risks has evolved in large urban centers over time.

Purpose: To address this gap, we quantified the magnitude of risk heterogeneity in Toronto, Ontario from January to November 2020 using a retrospective, population-based observational study using surveillance data.

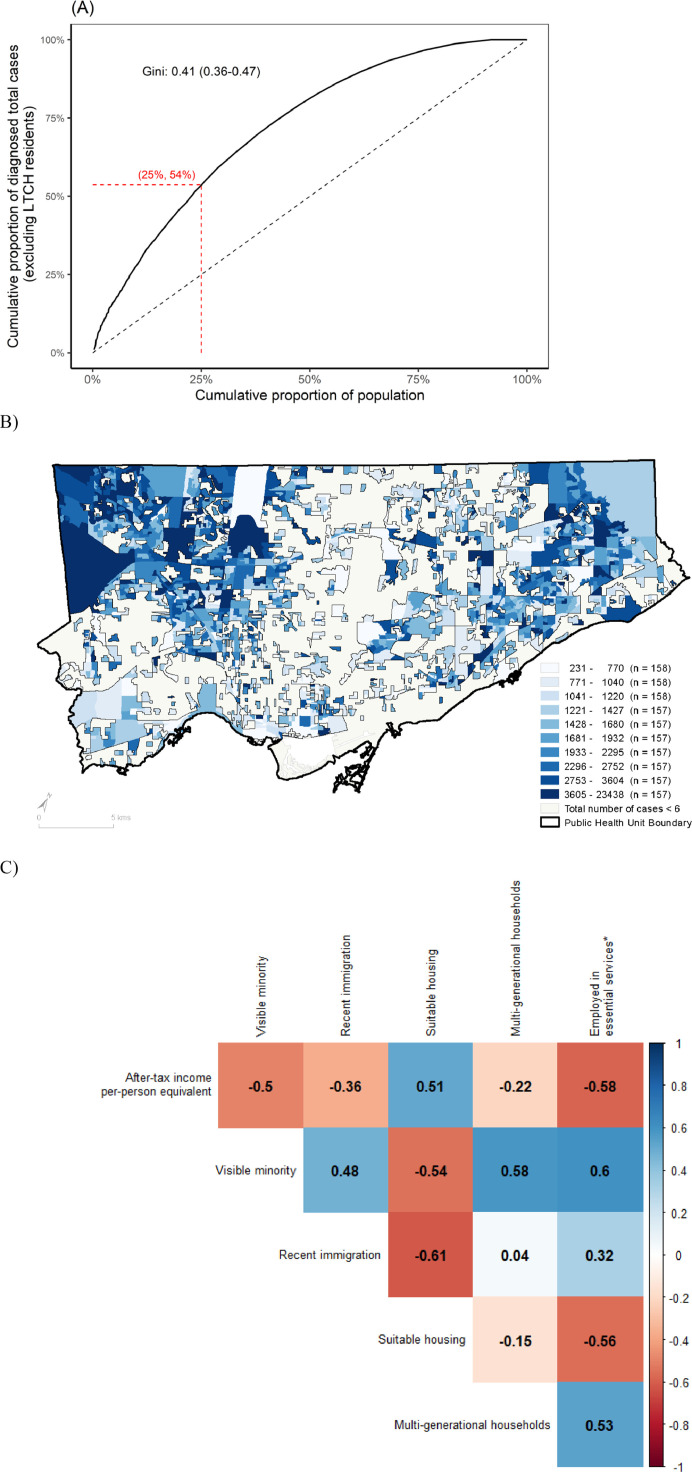
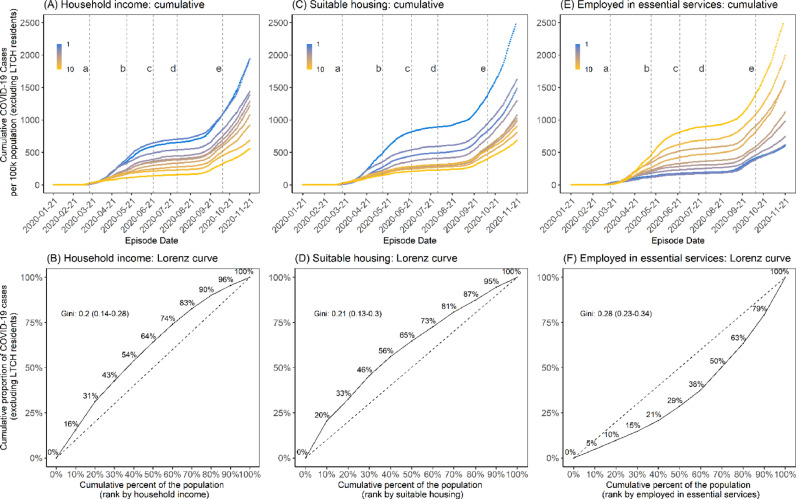
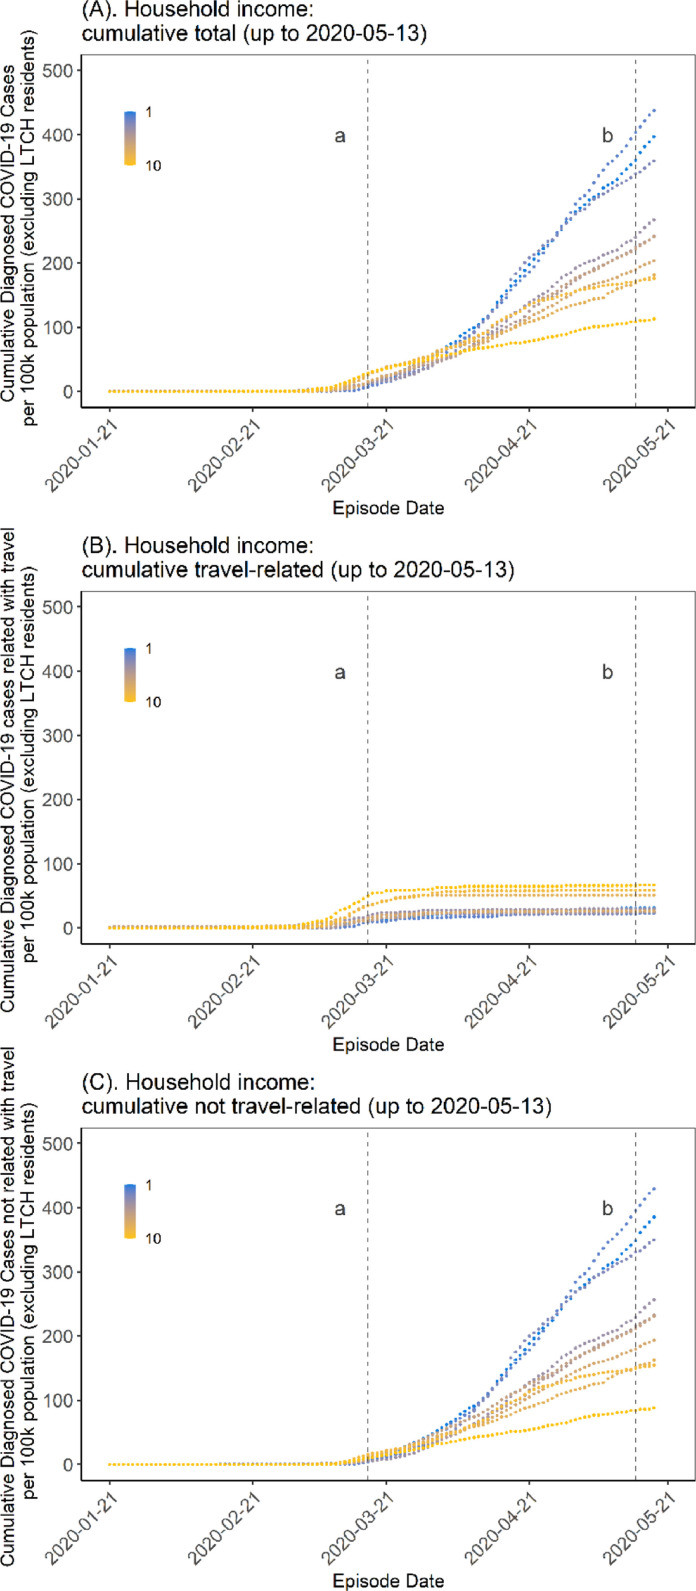
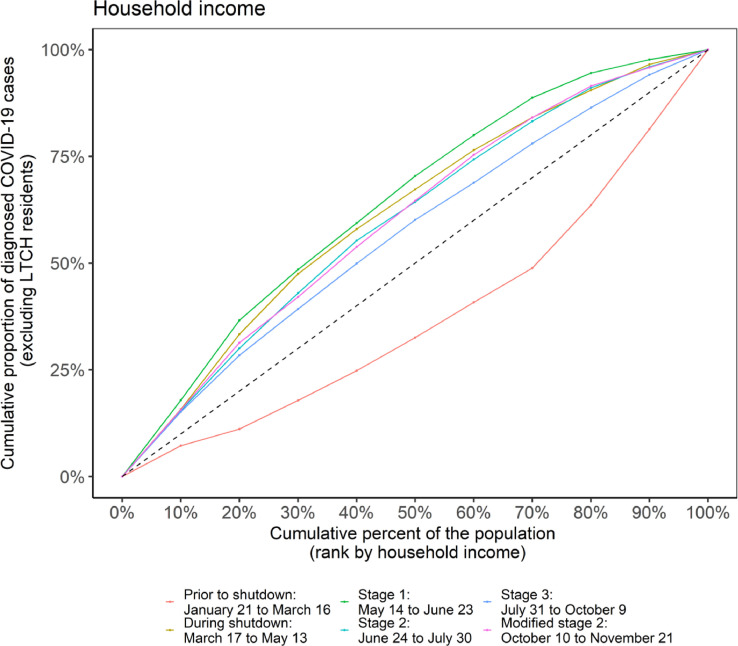
Methods: We generated epidemic curves by social determinants of health (SDOH) and crude Lorenz curves by neighbourhoods to visualize inequities in the distribution of COVID-19 and estimated Gini coefficients. We examined the correlation between SDOH using Pearson-correlation coefficients.

Results: Gini coefficient of cumulative cases by population size was 0.41 (95% confidence interval [CI]:0.36-0.47) and estimated for: household income (0.20, 95%CI: 0.14-0.28); visible minority (0.21, 95%CI:0.16-0.28); recent immigration (0.12, 95%CI:0.09-0.16); suitable housing (0.21, 95%CI:0.14-0.30); multigenerational households (0.19, 95%CI:0.15-0.23); and essential workers (0.28, 95%CI:0.23-0.34).

Conclusions: There was rapid epidemiologic transition from higher- to lower-income neighborhoods with Lorenz curve transitioning from below to above the line of equality across SDOH. Moving forward necessitates integrating programs and policies addressing socioeconomic inequities and structural racism into COVID-19 prevention and vaccination programs.

Keywords: COVID-19; Disease transmission; Gini coefficients; Health inequity; Lorenz curves; SARS-CoV-2; Social determinants of health.


Figures

Fig 1
Fig. 1
Concentration of COVID-19 cases by proportion of population in the City of Toronto, Canada (January 21−November 21, 2020). In Panel A, the Lorenz curve depicts the cumulative proportion of laboratory-confirmed diagnoses, excluding residents of LTCH, by the cumulative proportion of the population by DA. The dashed line represents the line of equality. For example, 53.7% (95% CI: 53.2%−54.3%) of cases were diagnosed among 25% of the population as shown by the dashed horizontal and vertical red lines. Panel B shows the map of lowest to highest deciles with respect to laboratory-confirmed diagnoses per capita by DA for the City of Toronto public health unit; and excluding cases among LTCH residents. Panel C depicts a heat map of the correlation between social determinants at the DA, where 1 represents a perfect positive correlation and −1 represents a perfect negative correlation. Abbreviation: DA = dissemination area; LTCH = long-term care homes.
Fig 2
Fig. 2
Cumulative epidemic curve and cumulative Lorenz curve by 3 social determinants (income, suitable housing, and essential services). Panels A and B represent income (after-tax, per-person equivalent) deciles where the lowest decile (decile 1) represents areas with the lowest average total after-tax income and the highest decile (decile 10) represents areas with the highest average total after-tax income. Panels C and D represent suitable housing deciles where the lowest decile (decile 1) represents areas with the highest proportion of homes deemed suitable housing; and the highest decile (decile 10) represents areas with the lowest proportion of homes deemed suitable housing. Panels E and F represent essential services where the lowest decile (decile 1) represents DAs with the fewest essential workers and the highest decile (decile 10) represents the highest prevalence of individuals employed in essential services. The Lorenz curves (Panels B, D, and F) depict the concentration of cases by each determinant and the dashed line represents the line of equality; for example, 30% of the population residing in the lowest income areas account for 42.7% (95% CI: 42.2%−43.3%) of cumulative cases (Panel B). The time-periods are: (A) March 17, 2020, start of shutdown; (B) May 14, 2020, start of stage 1 reopening; (C) June 24, 2020, start of stage 2 reopening; (D) July 31, 2020, start of stage 3 reopening; and (E) October 10, 2020, start of modified stage 2. Abbreviations: DA = dissemination area; LTCH = long-term care homes.
Fig 3
Fig. 3
Cumulative epidemic curve by household income at the start of the COVID-19 epidemic in Toronto, Canada (January 21, 2020-May 13, 2020). Panel A depicts all cases (excluding cases in LTCH) and demonstrates a cross-over in epidemic trajectories by DA-level income (per-person equivalent, after-tax). Early in the epidemic, per-capita rates were highest in higher-income neighborhoods but this pattern quickly reversed by early April 2020. Panel B depicts the trajectory restricted to among travel-acquired cases which were concentrated in higher-income neighborhoods, as were the early cases before the cross-over among those not acquired through travel (Panel C). The time-periods are: (A) March 17, 2020, start of shutdown; and (B) May 14, 2020, start of stage 1 reopening. Abbreviations: DA = dissemination area; LTCH = long-term care homes.
Fig 4
Fig. 4
Lorenz curve and Gini coefficient of COVID-19 cases over time by income in Toronto, Canada (January 21, 2020–November 21, 2020). The dashed line is the line of equality. The colored solid lines represent the time-periods associated with the stages of intervention: prior to shutdown (January 21, 2020–March 16, 2020); during shutdown (March 17, 2020–May 13, 2020); stage 1 reopening (May 14, 2020–June 23, 2020); stage 2 reopening (June 24, 2020–July 30, 2020); stage 3 reopening (July 31, 2020–October 9, 2020); and modified stage 2 reopening (October 10, 2020–November 21, 2020). Income values described are per-person equivalent and after-tax. The number of cases were initially disproportionately lower in neighborhoods of lower income (light pink) before quickly concentrating in higher-income neighbourhoods. There was less heterogeneity at the beginning of the second wave in Stage 3 (dark blue), but the epidemic concentrated again quickly by neighborhood level income by the modified stage 2 (dark pink). (For interpretation of the references to color in this figure legend, the reader is referred to the web version of this article.)

References

    1. Subedi R., Greenberg L., Turcotte M. COVID-19 mortality rates in Canada's ethno-cultural neighbourhoods 2020 [updated Oct 28, 2020]. Available from: https://www150.statcan.gc.ca/n1/pub/45-28-0001/2020001/article/00079-eng.... (Accessed 14 Jan 2021)
    1. Millet G.A., Jones A.T., Benkeser D., Baral S.D., Mercer L., Beyrer C., et al. Assessing differential impacts of COVID-19 on black communities. Ann Epidemiol. 2020;47:37–44. - PMC - PubMed
    1. Sohn A., Phanuphak N., Baral S., Kamarulzaman A. Know your epidemic, know your response: understanding and responding to the heterogeneity of the COVID-19 epidemics across Southeast Asia. J Int AIDS Soc. 2020;23(7):e25557. - PMC - PubMed
    1. Phaswana-Mafuya N., Shisana O., Gray G., Zungu N., Bekker L-G, Kuonza L., et al. The utility of 2009 H1N1 pandemic data in understanding the transmission potential and estimating the burden of COVID-19 in South Africa to guide mitigation strategies. S Afr Med J. 2020;110(7):576–577. - PubMed
    1. Gonzalez-Reiche A.S., Hernandez M.M., Sullivan M.J., Ciferri B., Alshammary H., Obla A., et al. Introductions and early spread of SARS-CoV-2 in the New York City area. Science. 2020;369(65011):297–301. - PMC - PubMed

Publication types