. 2021 Aug 19;184(17):4480-4494.e15.
doi: 10.1016/j.cell.2021.07.004. Epub 2021 Jul 27.

Selective activation of PFKL suppresses the phagocytic oxidative burst

Affiliations

Selective activation of PFKL suppresses the phagocytic oxidative burst

Neri Amara et al. Cell. .

Abstract

In neutrophils, nicotinamide adenine dinucleotide phosphate (NADPH) generated via the pentose phosphate pathway fuels NADPH oxidase NOX2 to produce reactive oxygen species for killing invading pathogens. However, excessive NOX2 activity can exacerbate inflammation, as in acute respiratory distress syndrome (ARDS). Here, we use two unbiased chemical proteomic strategies to show that small-molecule LDC7559, or a more potent designed analog NA-11, inhibits the NOX2-dependent oxidative burst in neutrophils by activating the glycolytic enzyme phosphofructokinase-1 liver type (PFKL) and dampening flux through the pentose phosphate pathway. Accordingly, neutrophils treated with NA-11 had reduced NOX2-dependent outputs, including neutrophil cell death (NETosis) and tissue damage. A high-resolution structure of PFKL confirmed binding of NA-11 to the AMP/ADP allosteric activation site and explained why NA-11 failed to agonize phosphofructokinase-1 platelet type (PFKP) or muscle type (PFKM). Thus, NA-11 represents a tool for selective activation of PFKL, the main phosphofructokinase-1 isoform expressed in immune cells.

Keywords: LDC7559; NA-11; NADPH; NETosis; NOX2; PFKL; ROS; neutrophils.


Conflict of interest statement

Declaration of interests N.A., T.M., K.Y., Z.L., D.S., N.K., K.N., S.T.S., and V.M.D. are employees of Genentech.

Figures
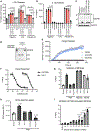
Figure 1.
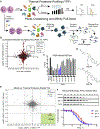
Figure 1.. LDC7559 and NA-11 inhibit NETosis independent of GSDMD but elicit identical phenotypes in neutrophils
(A and B) LDH (A) or IL-1β (B) released from primary human monocytes. Bars show the mean ± SEM of monocytes from three donors. (C) Western blots of monocytes at 1 h after electroporation with LPS. FL, full length GSDMD; NT, N-terminal fragment of GSDMD. Results representative of three independent experiments. (D) Coomassie blue staining of recombinant GSDMD. Results representative of three independent experiments. (E) TR-FRET assay measuring Europium-labeled biotin released from liposomes exposed to caspase-4 and GSDMD. Symbols indicate the mean ± SD of three independent experiments. (F and G) Percentage of polymorphonuclear leukocytes (PMNs) undergoing NETosis induced by PMA (F) or the stimuli indicated (G). Data are the mean ± SD of cells from three donors. (H) ROS production by PMNs. Bars show the mean ± SEM of PMNs from three donors. p values (two-way ANOVA, means compared to medium alone) are shown if p < 0.05. (I) Percentage of PMNs undergoing PMA-induced NETosis. The x axis indicates when NA-11 was added relative to the addition of PMA (t = 0). Bars show the mean ± SEM of PMNs from three donors. p values (one-way ANOVA, means compared to medium alone) are shown if p < 0.05. See also Figure S1.
Figure 2.
Figure 2.. Chemoproteomic analysis of the global interactors and specific targets of NA-11
(A) Dual chemoproteomic workflow. (B) TPP analysis of neutrophil lysates. Graph plots the ΔTm induced by NA-11 between 37°C and 65°C versus log2(fold change in the area under the melting curve from 44°C to 58°C). Each circle represents a different protein. Top hits with an upward shift in Tm are boxed. p values were determined by paired Student’s t test. (C) Percentage of PMNs undergoing PMA-induced NETosis. Bars show the mean ± SD of cells from three donors. (D) Structures of PALP1 and PALP6. (E) Scatterplot shows the TPP (x axis) and affinity pull-down data (y axis; fold change of affinity pull-down using PALP1 ± NA-11). Dot size indicates the p values from the affinity pull-downs (paired Student’s t test). The green quadrant shows proteins that are selectively targeted by NA-11 in both methods. (F) Western blots of THP-1 lysates heated for 3 min. Graph indicates PFKL band intensities quantified using ImageJ. Data are the mean ± SD of three independent experiments. See also Figures S2 and S3.
Figure 3.
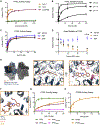
Figure 3.. NA-11 binds at the AMP/ADP allosteric effector site to activate PFKL
(A–D) Activity of recombinant PFKL. Data are the mean ± SEM of three independent experiments (A) or three measurements using two independent preparations of protein (B–D). In (D), p values at 1 h (paired Student’s t test) are shown when p < 0.05. (E) Cryo-EM structure of NA-11-bound PFKL. Regulatory and catalytic domains of one monomer are colored light and dark blue, respectively, with remaining monomers in gray. Higher magnifications of the NA-11 binding site are boxed in orange. V545, V582, and K315 are highlighted in pink. (F) Comparison of the orientation of NA-11 (orange) to ADP (yellow) in the nucleotide effector site of rabbit muscle PFK (PDB: 3O8N). (G and H) Activity of wild-type and mutant forms of PFKL (G) or PFKM (H). Data are the mean ± SEM of three measurements using two independent preparations of protein. Assay conditions in (A)–(C) and (G) are listed in Tables 1 and S1. See also Figures S4, S5, and S6.
Figure 4.
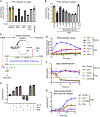
Figure 4.. Reduced PFKL activity in NOX2-stimulated neutrophils is prevented by NA-11
(A and B) PFK1 activity in PMN lysates. Bars show the mean ± SD of PMNs from three donors. (C) Model for why activation of PFKL by NA-11 reduces NADPH availability for the oxidative burst. (D) ROS production by PMNs. Data are the mean ± SD of PMNs from three donors. (E–G) NADPH:NADP+ ratios in PMNs. Data are the mean ± SEM (E) or mean ± SD (F and G) of PMNs from three donors. In (G), apocynin was added 30 min after the treatments indicated, and ROS was measured over the course of 30 min to measure the rate of NADPH replenishment. See also Figure S7.
Figure 5.
Figure 5.. NA-11 prevents a switch in glycolytic flux in activated neutrophils
Relative abundance of glycolysis and pentose phosphate pathway metabolites in PMNs treated with NA-11 or DMSO vehicle for 30 min and then PMA for 30 min. Box and whisker plots show the mean ± minimum and maximum of PMNs from six donors. p values (one-way ANOVA, multiple comparisons) are shown when p < 0.05.
Figure 6.
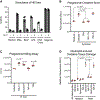
Figure 6.. NA-11 impairs neutrophil defenses and prevents tissue damage
(A) Percentage of PMNs undergoing NETosis. LPS indicates extracellular LPS. Bars show the mean ± SEM of PMNs from four donors. (B) ROS produced by PMNs during zymosan-induced phagocytosis. Data are the mean ± SEM of PMNs from three donors. p values (two-way ANOVA, multiple comparisons) are shown when p < 0.05. (C) E. coli colony-forming units (C.F.U.) recovered from PMNs after bacterial phagocytosis. Bars show the mean ± SEM of PMNs from five donors. p values (two-way ANOVA, means compared to vehicle) are shown when p < 0.05. (D) Graph indicates the amount of FITC-dextran to migrate through a monolayer of HBECs in the presence or absence of PMNs treated as indicated. RFU, relative fluorescence units. Data are the mean ± SEM of PMNs from three donors. p values (two-way ANOVA, multiple comparisons) are shown when p < 0.05. See also Figure S7.

Comment in

References

    1. Adams PD, Afonine PV, Bunkóczi G, Chen VB, Davis IW, Echols N, Headd JJ, Hung LW, Kapral GJ, Grosse-Kunstleve RW, et al. (2010). PHENIX: a comprehensive Python-based system for macromolecular structure solution. Acta Crystallogr. D Biol. Crystallogr 66, 213–221. - PMC - PubMed
    1. Aglietti RA, Estevez A, Gupta A, Ramirez MG, Liu PS, Kayagaki N, Ciferri C, Dixit VM, and Dueber EC (2016). GsdmD p30 elicited by caspase-11 during pyroptosis forms pores in membranes. Proc. Natl. Acad. Sci. USA 113, 7858–7863. - PMC - PubMed
    1. Amulic B, Cazalet C, Hayes GL, Metzler KD, and Zychlinsky A (2012). Neutrophil function: from mechanisms to disease. Annu. Rev. Immunol 30, 459–489. - PubMed
    1. Andrés V, Carreras J, and Cussó R (1990). Regulation of muscle phosphofructokinase by physiological concentrations of bisphosphorylated hexoses: effect of alkalinization. Biochem. Biophys. Res. Commun 172, 328–334. - PubMed
    1. Banaszak K, Mechin I, Obmolova G, Oldham M, Chang SH, Ruiz T, Radermacher M, Kopperschlager G, and Rypniewski W (2011). The crystal structures of eukaryotic phosphofructokinases from baker’s yeast and rabbit skeletal muscle. J. Mol. Biol 407, 284–297. - PubMed

Publication types

MeSH terms

Substances