

Dual-energy CT imaging with limited-angular-range data
- PMID: 34320478
- PMCID: PMC8704637
- DOI: 10.1088/1361-6560/ac1876
Dual-energy CT imaging with limited-angular-range data
Abstract
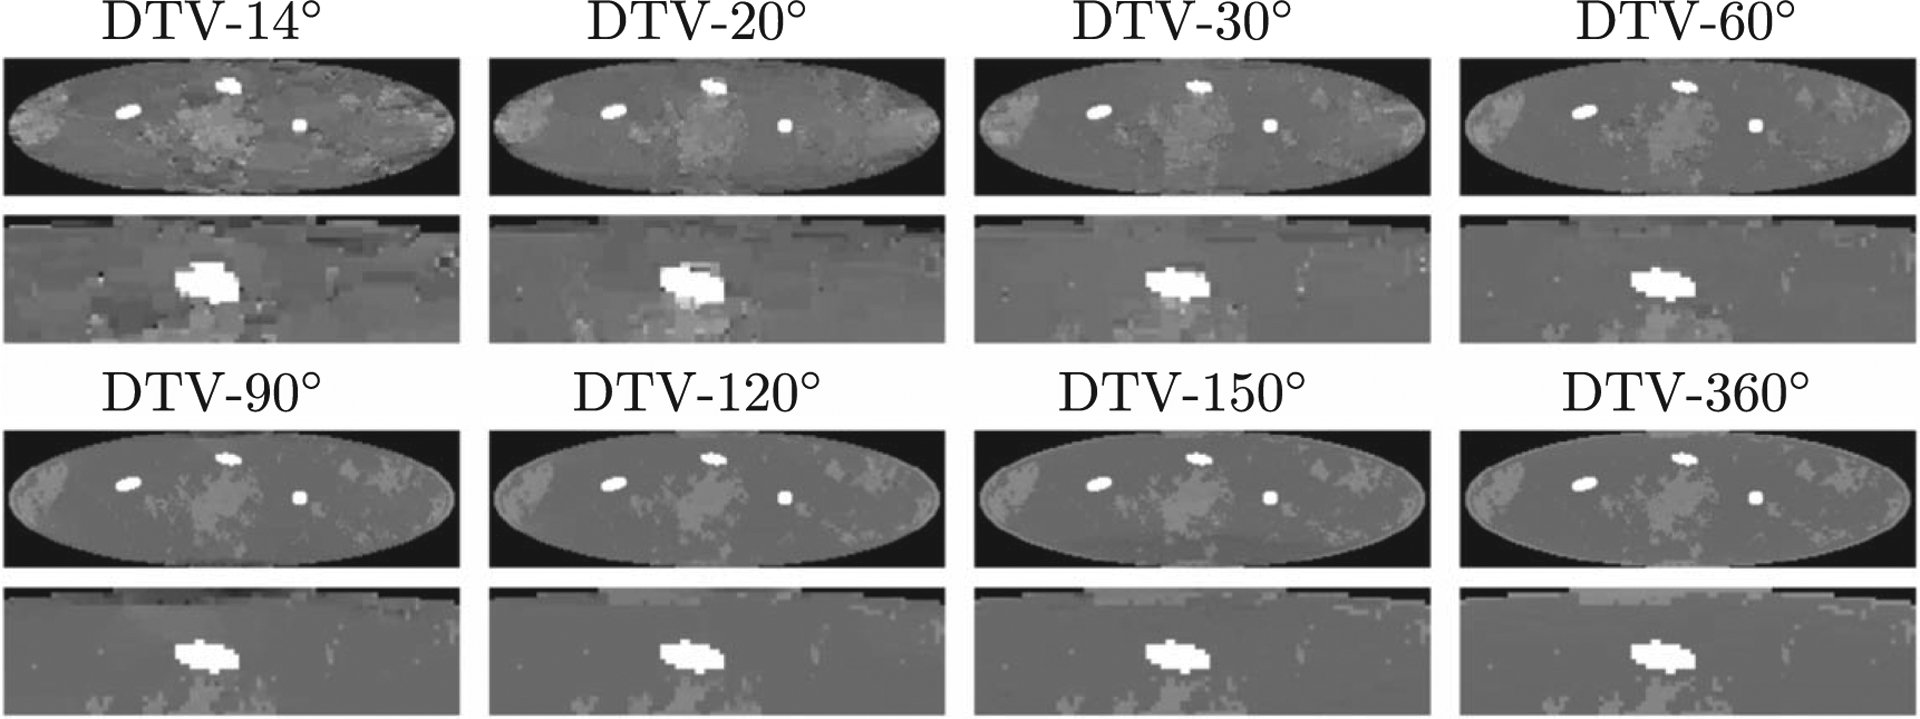
In dual-energy computed tomography (DECT), low- and high-kVp data are collected often over a full-angular range (FAR) of 360°. While there exists strong interest in DECT with low- and high-kVp data acquired over limited-angular ranges (LARs), there remains little investigation of image reconstruction in DECT with LAR data.Objective: we investigate image reconstruction with minimized LAR artifacts from low- and high-kVp data over LARs of ≤180° by using a directional-total-variation (DTV) algorithm.Methods: image reconstruction from LAR data is formulated as a convex optimization problem in which data-ℓ2is minimized with constraints on image's DTVs along orthogonal axes. We then achieve image reconstruction by applying the DTV algorithm to solve the optimization problem. We conduct numerical studies from data generated over arcs of LARs, ranging from 14° to 180°, and perform visual inspection and quantitative analysis of images reconstructed.Results: monochromatic images of interest obtained with the DTV algorithm from LAR data show substantially reduced artifacts that are observed often in images obtained with existing algorithms. The improved image quality also leads to accurate estimation of physical quantities of interest, such as effective atomic number and iodine contrast concentration.Conclusion: our study reveals that from LAR data of low- and high-kVp, monochromatic images can be obtained that are visually, and physical quantities can be estimated that are quantitatively, comparable to those obtained in FAR DECT.Significance: as LAR DECT is of high practical application interest, the results acquired in the work may engender insights into the design of DECT with LAR scanning configurations of practical application significance.
Keywords: atomic number; directional-total-variation; dual-energy CT; iodine cocentration; limited-angular-range reconstruction.
© 2021 Institute of Physics and Engineering in Medicine.
Figures


Similar articles
-
Dual-energy CT imaging over non-overlapping, orthogonal arcs of limited-angular ranges.J Xray Sci Technol. 2021;29(6):975-985. doi: 10.3233/XST-210974. J Xray Sci Technol. 2021. PMID: 34569984 Free PMC article.
-
Accurate Image Reconstruction in Dual-Energy CT with Limited-Angular-Range Data Using a Two-Step Method.Bioengineering (Basel). 2022 Dec 6;9(12):775. doi: 10.3390/bioengineering9120775. Bioengineering (Basel). 2022. PMID: 36550981 Free PMC article.
-
Prototyping optimization-based image reconstructions from limited-angular-range data in dual-energy CT.Med Image Anal. 2024 Jan;91:103025. doi: 10.1016/j.media.2023.103025. Epub 2023 Nov 7. Med Image Anal. 2024. PMID: 37976869 Free PMC article.
-
Dual-energy CT revisited with multidetector CT: review of principles and clinical applications.Diagn Interv Radiol. 2011 Sep;17(3):181-94. doi: 10.4261/1305-3825.DIR.3860-10.0. Epub 2010 Nov 14. Diagn Interv Radiol. 2011. PMID: 20945292 Review.
-
Pearls, Pitfalls, and Problems in Dual-Energy Computed Tomography Imaging of the Body.Radiol Clin North Am. 2018 Jul;56(4):625-640. doi: 10.1016/j.rcl.2018.03.007. Radiol Clin North Am. 2018. PMID: 29936951 Review.
Cited by
-
Dual-energy CT imaging over non-overlapping, orthogonal arcs of limited-angular ranges.J Xray Sci Technol. 2021;29(6):975-985. doi: 10.3233/XST-210974. J Xray Sci Technol. 2021. PMID: 34569984 Free PMC article.
-
4D-image reconstruction directly from limited-angular-range data in continuous-wave electron paramagnetic resonance imaging.J Magn Reson. 2023 May;350:107432. doi: 10.1016/j.jmr.2023.107432. Epub 2023 Apr 5. J Magn Reson. 2023. PMID: 37058955 Free PMC article.
-
Accurate Image Reconstruction in Dual-Energy CT with Limited-Angular-Range Data Using a Two-Step Method.Bioengineering (Basel). 2022 Dec 6;9(12):775. doi: 10.3390/bioengineering9120775. Bioengineering (Basel). 2022. PMID: 36550981 Free PMC article.
-
Dual-Energy CT in Cardiothoracic Imaging: Current Developments.Diagnostics (Basel). 2023 Jun 19;13(12):2116. doi: 10.3390/diagnostics13122116. Diagnostics (Basel). 2023. PMID: 37371011 Free PMC article. Review.
-
Multi-basis-image reconstruction from conventional data acquired in standard CT.Phys Med Biol. 2025 May 22;70(11):115005. doi: 10.1088/1361-6560/add789. Phys Med Biol. 2025. PMID: 40354817 Free PMC article.
References
-
- Alvarez RE and Macovski A 1976. Energy-selective reconstructions in x-ray computerised tomography Phys. Med. Biol 21 733–44 - PubMed
-
- Attix FH 2008. Introduction to Radiological Physics and Radiation Dosimetry (New York: Wiley; )
-
- Batenburg KJ and Sijbers J 2011. DART: a practical reconstruction algorithm for discrete tomography IEEE Trans. Imag. Proc 20 2542–53 - PubMed
Publication types
MeSH terms
Substances
Grants and funding
LinkOut - more resources
Full Text Sources
Medical
Miscellaneous