. 2021 Sep;597(7875):268-273.
doi: 10.1038/s41586-021-03841-4. Epub 2021 Jul 28.

Rapid and stable mobilization of CD8+ T cells by SARS-CoV-2 mRNA vaccine

Affiliations

Rapid and stable mobilization of CD8+ T cells by SARS-CoV-2 mRNA vaccine

Valerie Oberhardt et al. Nature. 2021 Sep.

Abstract

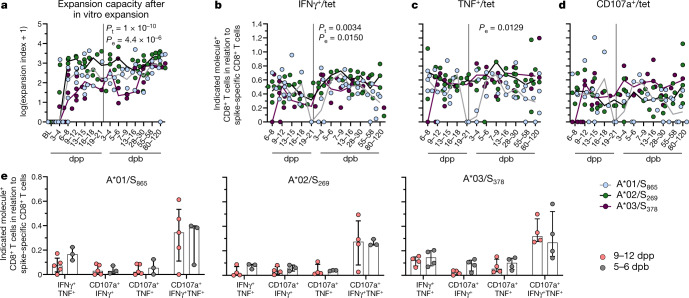
SARS-CoV-2 spike mRNA vaccines1-3 mediate protection from severe disease as early as ten days after prime vaccination3, when neutralizing antibodies are hardly detectable4-6. Vaccine-induced CD8+ T cells may therefore be the main mediators of protection at this early stage7,8. The details of their induction, comparison to natural infection, and association with other arms of vaccine-induced immunity remain, however, incompletely understood. Here we show on a single-epitope level that a stable and fully functional CD8+ T cell response is vigorously mobilized one week after prime vaccination with bnt162b2, when circulating CD4+ T cells and neutralizing antibodies are still weakly detectable. Boost vaccination induced a robust expansion that generated highly differentiated effector CD8+ T cells; however, neither the functional capacity nor the memory precursor T cell pool was affected. Compared with natural infection, vaccine-induced early memory T cells exhibited similar functional capacities but a different subset distribution. Our results indicate that CD8+ T cells are important effector cells, are expanded in the early protection window after prime vaccination, precede maturation of other effector arms of vaccine-induced immunity and are stably maintained after boost vaccination.


Conflict of interest statement

The authors declare no competing interests.

Figures

Fig. 1
Fig. 1. Vaccine-elicited epitope-specific CD8+ T cells.
a, Calculated ex vivo frequency indicated at baseline (BL), dpp and dpb for spike-specific CD8+ T cells. Detection limit: 5 × 10−6. b, Percentage of CD38, Ki-67 and T-BEThi expressing spike-specific non-naive CD8+ T cells. c, Diffusion map showing flow cytometry data for A*02/S269-specific CD8+ T cells in relation to dpp (shades of red) and dpb (shades of grey) in one individual. Expression levels of CD38, T-BET, TOX and BCL-2 are plotted on the diffusion map (blue denotes low expression; red denotes high expression). d, e, Calculated ex vivo frequencies of non-naive spike-specific CD8+ T cells expressing CD127 or TCF-1 for spike-specific CD8+ T cells. Line indicates median. P values determined by two-way ANOVA with main effects only comparing the effect of the different epitopes (Pe) and of time course (Pt:). Source data
Fig. 2
Fig. 2. Functional capacities of vaccine-elicited spike-specific CD8+ T cells.
a, Expansion capacity of spike-specific CD8+ T cells after in vitro expansion. bd, Percentage of CD8+ T cells producing effector molecules related to the frequency of spike-specific CD8+ T cells. e, Bar graphs depicting the polyfunctionality of spike-specific CD8+ T cells comparing 9–12 dpp and 5–6 dpb vaccination. Line indicates median. Bar charts show the median with interquartile range (IQR). P values determined by two-way ANOVA with main effects only comparing the effect of the different epitopes and of time course (ad) or by Mann–Whitney test with Holm–Šídák method (e). Source data
Fig. 3
Fig. 3. Circulating spike-specific CD4+ T cells, B cells and antibodies.
a, Calculated ex vivo frequency of DRB1*15:01/S236-specific CD4+ T cells ex vivo after pMHCII tetramer-based enrichment is indicated at baseline, dpp and dpb. Detection limit: 1.25 × 104. b, ICOS+CD38++ and Ki-67 expression within non-naive, DRB1*15:01/S236-specific CD4+ T cells. c, ICOS+CD38++ and Ki-67-expressing non-naive DRB1*15:01/S236-specific CD4+ T cells on 9–12 dpp within TFH (CXCR5+PD-1+) and TH1-like (CXCR5CXCR3+) cells. d, Anti-SARS-CoV-2 spike IgG at baseline and after vaccination (<35.2 binding antibody units (BAU) per ml: negative, ≥35.2 BAU ml−1: positive; upper limit of quantification: 3,000 BAU ml−1). e, Antibody neutralization activity is depicted as 50% plaque reduction neutralization tests (PRNT50) at baseline, dpp and dpb vaccination for the SARS-CoV-2 variant B.1. Numbers indicate non-logarithmic median value. Detection limit: 5 log2PRNT50. f, Percentage spike-specific B cells depicted at baseline, dpp and dpb as well as in natural infection for S1 and RBD. Detection limit: 0.05%. g, Secreted anti-SARS-CoV-2 spike IgG from PBMCs after in vitro stimulation with CpG and IL-2 (<35.2 BAU ml−1: negative, ≥35.2 BAU ml−1: positive). Line indicates median. Bar charts show the median and IQR. P values determined by one-way ANOVA with a mixed effects model comparing the effect of the time course (a, b, f), a Wilcoxon test (c) or a two-way ANOVA with main effects only comparing the effect of the different epitopes and of time course (g). Source data
Fig. 4
Fig. 4. Early memory CD8+ T cells after vaccination and natural infection.
a, Calculated frequency of spike-specific CD8+ T cells 80–200 dpb vaccination or dps in natural infection. Detection limit: 5 × 10−6. b, Distribution of spike-specific CD8+ T cell memory subsets 80–200 dpb/dps. c, t-SNE representation of flow cytometry data, depicting spike-specific CD8+ T cells more than 80 dpb vaccination and dps of natural infection (grey: vaccination, black: natural infection) for A*01/S865- (vaccination n = 9, natural infection n = 9), A*02/S269-(vaccination n = 10, natural infection n = 8) and A*03/S378- (vaccination n = 9, natural infection n = 9) specific CD8+ T cells. d, Left, expansion index of spike-specific CD8+ T cells after in vitro expansion at 80-200 dpb/dps. Right, percentage of IFNγ-producing CD8+ T cells related to the frequency of spike-specific CD8+ T cells after in vitro expansion at 80–200 dpb/dps. TTM, transitional memory T cells. Bar charts show the median with IQR. P values were determined by Mann–Whitney test with Holm–Šídák method. Source data
Extended Data Fig. 1
Extended Data Fig. 1. Spike-specific CD8+ T cell epitopes following vaccination.
(a) Timeline showing blood and serum collection before and after prime and boost vaccination. (b) Gating strategy of flow cytometry data. A*01/S865-, A*02/S269- and A*03/S378-specific CD8+ T cells were identified via pMHCI tetramer-based analysis. (c) Comparison of epitope sequences with amino acid sequences of SARS-CoV-1/2, MERS and common cold coronaviruses amino acid sequences (upper panel) and with circulating SARS-CoV-2 variants of concern (VOC) (middle panel), respectively for A*01/S865, A*02/S269 and A*03/S378-specific CD8+ T cell epitopes. (Lower panel) A*01/S865, A*02/S269 and A*03/S378 peptide characteristics, comparing different prediction methods for the estimation of MHC I binding affinity, half-life and processing. (d) Heatmap showing the percentage of patients with a CD8+ T cell response to spike overlapping peptides/fine-mapped minimal optimal epitope in relation to the total number of patients tested with the respective HLA type. n = 16 OLP: overlapping peptide. Parts of the figure were drawn by using pictures from Servier Medical Art (http://smart.servier.com/) and licensed under a Creative Common Attribution 3.0 Generic License (a). Source data
Extended Data Fig. 2
Extended Data Fig. 2. Spike-specific CD8+ T cells before and after enrichment.
(a, b) Dot plots showing A*01/S865-, A*02/S269- and A*03/S378-specific CD8+ T cells ex vivo without pMHCI tetramer-based enrichment (a) and after pMHCI tetramer-based enrichment (b) at BL, before and after boost vaccination. (c) Exemplary dot plots (5-6 dpb) depicting the expression levels of CD38, Ki-67, T-BET, GRZB, PD-1 and CXCR3 in A*02/S269- (green) specific and bulk (grey) CD8+ T cells. (d) % of GRZB, PD-1 and CXCR3 expressing A*01/S865-, A*02/S269- and A*03/S378-specific non-naïve CD8+ T cells. (e) Exemplary dot plot (5-6 dpb) depicting the expression levels of CD39 and TOX in A*02/S269- (green) specific and bulk (grey) CD8+ T cells. % expression among A*01/S865-, A*02/S269-and A*03/S378-specific non-naïve CD8+ T cells is shown on the right side. BL: baseline; dpp: days post prime; dpb: days post boost; GRZB: granzyme B. (d-e) Two-way ANOVA with main effects only comparing the effect of the different epitopes and of time course. All statistically significant results are marked with the respective exact p-value (pe: epitope, pt: time). Source data
Extended Data Fig. 3
Extended Data Fig. 3. Expression levels of CD38, T-BET, TOX, PD-1 and BCL-2 after prime and boost vaccination.
(a) t-SNE representation of flow cytometry data comparing A*01/S865-, A*02/S269- and A*03/S378-specific CD8+ T cells after prime and boost vaccination (prime 4, 3 and 5 and boost 3, 3 and 5 individuals for A*01/S865, A*02/S269 and A*03/S378, respectively). Expression levels of TOX, PD-1 and T-BET are indicated for A*01/S865, A*02/S269 and A*03/S378 (colour-code: blue, low expression; red, high expression). (b) Diffusion map showing flow cytometry data for A*01/S865- and A*03/S378-specific CD8+ T cells of one representative donor at dpp (shades of red) and dpb (shades of grey) with CD38, T-BET, TOX and BCL-2 expression levels plotted on the diffusion map (colour-code: blue, low expression; red, high expression). dpp: days post prime; dpb: days post boost; t-SNE: t-distributed stochastic neighbour embedding.
Extended Data Fig. 4
Extended Data Fig. 4. Spike-specific CD8+ T cells in SARS-CoV-2 convalescents after a single vaccination and expression of early memory marker after prime and boost vaccination.
(a-c) Data of two donors who recovered from SARS-CoV-2 infection >365 day ago and received a single dose Bnt162b2 vaccination. (a) The calculated ex vivo frequency for A*02/S269-specific CD8+ T cells in two donors is indicated at baseline (cSARS-CoV-2) and days after single dose vaccination. % of CD38, Ki-67, T-BEThi (b) and TOXhi (c) expressing A*02/S269- specific non-naïve CD8+ T cells. (d-e) Exemplary dot plots depicting the expression levels of CD127 (d) and TCF-1 (e) in A*02/S269- (green) specific and bulk (grey) CD8+ T cells 6 dpb. % A*01/S865-, A*02/S269- and A*03/S378-specific non-naïve CD8+ T cells expressing CD127 (d) and TCF-1 (e) were determined. Correlation of indicated marker with dpb is depicted on the right. (f) Exemplary dot plots depicting the expression levels of BCL-2 in A*02/S269- (green) specific as well as on bulk (grey) CD8+ T cells 6 dpb. nMFI (MFI normalized to naïve CD8+ T cells) of A*01/S865-, A*02/S269- and A*03/S378-specific non-naïve CD8+ T cells expressing BCL-2 was determined. Correlation of nMFI BCL-2 with dpb is depicted on the right. cSARS: convalescent SARS; dpv: days post vaccination; BL: baseline; dpp: days post prime; dpb: days post boost; nMFI: normalized Median Fluorescent Intensity, epi: epitope. (d-f) Two-way ANOVA with main effects only comparing the effect of the different epitopes and of time course (left) and Spearman correlation (right) was performed. All statistically significant results are marked with the respective exact p-value (pe: epitope, pt: time). Source data
Extended Data Fig. 5
Extended Data Fig. 5. Frequency and functional capacity of spike-specific CD8+ T cells following prime and boost vaccination.
(a) Gating strategy of flow cytometry data. Cytokine secretion of A*01/S865-, A*02/S269- and A*03/S378-specific CD8+ T cells was determined after in vitro expansion. (b) Workflow depicting peptide-specific in vitro expansion of CD8+ T cells. (c) Frequency of A*01/S865-, A*02/S269- and A*03/S378 -specific CD8+ T cells after 14 day of in vitro expansion. (d-g) Dot plots showing A*01/S865-, A*02/S269- and A*03/S378 -specific CD8+ T cells after in vitro expansion (d) and IFN-γ- (e), TNF- (f) and CD107a- (g) producing CD8+ T cells after in vitro expansion (5-6 dpb). (c) Two-way ANOVA with main effects only comparing the effect of the different epitopes and of time course. BL: baseline; dpp: days post prime; dpb: days post boost, epi: epitope. Two-way ANOVA with main effects only comparing the effect of the different epitopes and of time course. All statistically significant results are marked with the respective exact p-value (pe: epitope, pt: time). Source data
Extended Data Fig. 6
Extended Data Fig. 6. Circulating spike-specific CD4+ T cells following prime and boost vaccination.
(a) Gating strategy of flow cytometry data. DRB1*15:01/S236-specific CD4+ T cells were identified via pMHCII tetramer-based enrichment used in further analyses. (b) Dot plots showing DRB1*15:01/S236-specific CD4+ T cells ex vivo after pMHCII tetramer-based enrichment at BL, before and after boost vaccination. (c) Comparison of DRB1*15:01/S236 epitope sequence with amino acid sequences of SARS-CoV-1/2, MERS and common cold coronaviruses (left) and of circulating SARS-CoV-2 variants of concern (VOC) (right). (d) Number of responses (left) and the calculated ex vivo frequencies (middle) of DRB1*15:01/S236-specific CD4+ T cells in historic controls (HC, n = 8). % naïve within total DRB1*15:01/S236-specific CD4+ T cells in historic controls (right). Detection limit: 1.25*10−4. (e) % naïve of total DRB1*15:01/S236-specific CD4+ T cells. (f) Representative dot plots of ICOS+CD38++ and Ki-67+ expression (grey: bulk, black: DRB1*15:01/S236-specific CD4+ T cells). (g) % CXCR5-CXCR3+ TH1 cells and of CXCR5+PD-1+ TFH within non-naïve DRB1*15:01/S236-specific CD4+ T cells with representative dot plots (grey: bulk, black: DRB1*15:01/S236-specific CD4+ T cells). BL: baseline, dpp: days post prime, dpb: days post boost; TFH: follicular helper T cells; TH1: T helper cells 1-like cells. Bar charts show the median with IQR. (e, g) One-way ANOVA with a mixed effects model comparing the effect of the time course. All statistically significant results are marked with the respective exact p-value (pt: time). Source data
Extended Data Fig. 7
Extended Data Fig. 7. Circulating B cells, antibodies and antibody neutralization activity after prime and boost vaccination.
(a) Gating strategy of flow cytometry data for different B cell subpopulations. (b) % of CD19+, naïve, switched memory, ASCs, CD69+aN and CD95+ aN cells within bulk B cells was determined at BL, post prime/boost. Nonlinear fit was calculated in red. (c) Detection of spike IgM in serum at BL, post prime/boost by ELISA. Level of secreted IgM was determined in supernatant of PBMC from BL, post prime/boost and after natural infection after in vitro stimulation for 9 d with CpG and IL-2. Detection limit: O.D. 8.5*10−2. (d) Antibody neutralization activity is depicted as PRNT50 at BL, dpp and dpb vaccination for the SARS-CoV-2 VOC alpha and beta. (e) Antibody neutralization capacity is depicted as PRNT50 at different dps in natural SARS-CoV-2 infection with SARS-CoV-2 ancestral variant B.1. (d-e) Numbers indicate non-logarithmic median value. Detection limit: 5 log2PRNT50. (f) Dot plots showing double tetramer positive B cells for S1 and RBD epitope at 28-30 dpb. (g) Dot plots representing co-expression of IgD/IgM (left), IgG/CD27 (middle) and CD95/CD71 (right) on concatenated flies of S1-specific B cells at 28-30 dpb. (h) Donut plots representing co-expression of CD27/IgG (upper) and CD71/CD95 (lower) in concatenated analysis of S1-specific B cells populations (n indicated the number of individual files concatenated) after boost vaccination. sw memory: switched memory; aN: activated naïve; BL: baseline; dpp: days post prime; dpb: days post boost; dps: days post symptoms; O.D.: optical density; PRNT50: plaque-reduction neutralization titer 50. Bar charts show the median with IQR. (c-e) One-way ANOVA with a mixed effects model comparing the effect the time course. All statistically significant results are marked with the respective exact p-value (pt:: time). Source data
Extended Data Fig. 8
Extended Data Fig. 8. Comparison of spike-specific CD8+ T cells after vaccination and natural infection.
(a) Distribution of dpb and dps of donors analysed for A*01/S865-, A*02/S269- and A*03/S378-specific CD8+ T cells after vaccination and natural infection. (b) Calculated frequency of A*01/S865-, A*02/S269- and A*03/S378-specific CD8+ T cells ex vivo after pMHCI tetramer-based enrichment at 20-39 and 40-80 dpb/dps. Detection limit: 5*10−6. (c) Plotted expression levels of T-BET, TCF-1, BCL-2, CCR7, CD38 and PD1 on t-SNE depicting all spike-specific CD8+ T cells >80 dpb vaccination (upper) and >80 dps in natural SARS-CoV-2 infection (lower) are indicated for A*01/S865, A*02/S269 and A*03/S378 (colour-code: blue, low expression; red, high expression). dpb: days post boost; dps: days post symptom onset; t-SNE: t-distributed stochastic neighbour embedding. Bar charts show the median with IQR. (a) 2-way ANOVA including Tukey’s multiple comparisons test were performed. (b) Statistical analyses of vaccination vs. natural infection was performed by Mann–Whitney test with Holm-Šídák method. All statistically significant results are marked with the respective exact p-value. Source data
Extended Data Fig. 9
Extended Data Fig. 9. Subset distribution of spike-specific CD8+ T cell after vaccination and natural infection.
(a) Gating strategy of memory CD8+ T cell populations among A*02/S269- (green) (36 dps) specific CD8+ T cells, (grey/black: bulk CD8+ T cells). (b) Distribution of spike-specific CD8+ T-cell memory subsets TED, TCM, TTM and TEM1 at 20-39 and 40-80 dpb/dps. (c) Distribution of spike-specific CD8+ T-cell memory subsets TEM2, TEM3 and TEMRA at 20-39, 40-80 and >80 dpb/dps. dpb: days post boost; dps: days post symptoms; ; TED: early differentiated, TCM: central memory T cells and TEM1: effector memory T cells 1 ; TEM2: effector memory T cells 2; TEM3: effector memory T cells 3, TEMRA terminally differentiated effector memory cells re‐expressing CD45RA. Bar charts show the median with IQR. (b-c) Statistical analyses of vaccination vs. natural infection was performed by Mann–Whitney test with Holm-Šídák method. All statistically significant results are marked with the respective exact p-value. Source data
Extended Data Fig. 10
Extended Data Fig. 10. Expression levels of BCL-2, TCF1 and CD38 and polyfunctionality of spike-specific CD8+ T cells after vaccination and natural infection.
(a) Plotted expression levels of TCF-1 on t-SNE depicting spike-specific CD8+ T cells >80 dpb vaccination and dps of natural infection for A*01/S865- (vaccination n = 9, natural infection n = 9), A*02/S269-(vaccination n = 10, natural infection n = 8) and A*03/S378- (vaccination n = 9, natural infection n = 9) (colour-code: blue, low expression; red, high expression). (b, c) nMFI (normalized to naïve CD8+ T cells) of BCL-2 (b, upper), TCF1 (b, middle) and CD38 (c, lower) spike-specific non-naïve CD8+ T cells at 20-39, 40-80 and >80 dpb/dps. (d) % of TNF-producing CD8+ T cells in relation to the frequency of spike-specific CD8+ T cells after in vitro expansion. (e) Bar graphs depicting the polyfunctionality of the respective spike-specific CD8+ T cells comparing vaccination and natural infection. dpb: days post boost; dps: days post symptom onset. Bar charts show the median with IQR. (b-e) Statistical analyses of vaccination vs. natural infection was performed by Mann–Whitney test with Holm-Šídák method. All statistically significant results are marked with the respective exact p-value. Source data

References

    1. Krammer F. SARS-CoV-2 vaccines in development. Nature. 2020;586:516–527. doi: 10.1038/s41586-020-2798-3. - DOI - PubMed
    1. Baden LR, et al. Efficacy and safety of the mRNA-1273 SARS-CoV-2 vaccine. N. Engl. J. Med. 2021;384:403–416. doi: 10.1056/NEJMoa2035389. - DOI - PMC - PubMed
    1. Polack FP, et al. Safety and efficacy of the BNT162b2 mRNA COVID-19 vaccine. N. Engl. J. Med. 2020;383:2603–2615. doi: 10.1056/NEJMoa2034577. - DOI - PMC - PubMed
    1. Sahin U, et al. COVID-19 vaccine BNT162b1 elicits human antibody and TH1 T cell responses. Nature. 2020;586:594–599. doi: 10.1038/s41586-020-2814-7. - DOI - PubMed
    1. Sahin U, et al. BNT162b2 vaccine induces neutralizing antibodies and poly-specific T cells in humans. Nature. 2021;595:572–577. doi: 10.1038/s41586-021-03653-6. - DOI - PubMed

Publication types

MeSH terms