. 2021 Jul 28;19(1):147.
doi: 10.1186/s12915-021-01080-7.

Altered neuronal physiology, development, and function associated with a common chromosome 15 duplication involving CHRNA7

Affiliations

Altered neuronal physiology, development, and function associated with a common chromosome 15 duplication involving CHRNA7

Kesavan Meganathan et al. BMC Biol. .

Abstract

Background: Copy number variants (CNVs) linked to genes involved in nervous system development or function are often associated with neuropsychiatric disease. While CNVs involving deletions generally cause severe and highly penetrant patient phenotypes, CNVs leading to duplications tend instead to exhibit widely variable and less penetrant phenotypic expressivity among affected individuals. CNVs located on chromosome 15q13.3 affecting the alpha-7 nicotinic acetylcholine receptor subunit (CHRNA7) gene contribute to multiple neuropsychiatric disorders with highly variable penetrance. However, the basis of such differential penetrance remains uncharacterized. Here, we generated induced pluripotent stem cell (iPSC) models from first-degree relatives with a 15q13.3 duplication and analyzed their cellular phenotypes to uncover a basis for the dissimilar phenotypic expressivity.

Results: The first-degree relatives studied included a boy with autism and emotional dysregulation (the affected proband-AP) and his clinically unaffected mother (UM), with comparison to unrelated control models lacking this duplication. Potential contributors to neuropsychiatric impairment were modeled in iPSC-derived cortical excitatory and inhibitory neurons. The AP-derived model uniquely exhibited disruptions of cellular physiology and neurodevelopment not observed in either the UM or unrelated controls. These included enhanced neural progenitor proliferation but impaired neuronal differentiation, maturation, and migration, and increased endoplasmic reticulum (ER) stress. Both the neuronal migration deficit and elevated ER stress could be selectively rescued by different pharmacologic agents. Neuronal gene expression was also dysregulated in the AP, including reduced expression of genes related to behavior, psychological disorders, neuritogenesis, neuronal migration, and Wnt, axonal guidance, and GABA receptor signaling. The UM model instead exhibited upregulated expression of genes in many of these same pathways, suggesting that molecular compensation could have contributed to the lack of neurodevelopmental phenotypes in this model. However, both AP- and UM-derived neurons exhibited shared alterations of neuronal function, including increased action potential firing and elevated cholinergic activity, consistent with increased homomeric CHRNA7 channel activity.

Conclusions: These data define both diagnosis-associated cellular phenotypes and shared functional anomalies related to CHRNA7 duplication that may contribute to variable phenotypic penetrance in individuals with 15q13.3 duplication. The capacity for pharmacological agents to rescue some neurodevelopmental anomalies associated with diagnosis suggests avenues for intervention for carriers of this duplication and other CNVs that cause related disorders.

Keywords: CHRNA7; Chromosome 15q13.3 duplication; Copy number variants; Cortical neurons; Induced pluripotent stem cells; Neurodevelopmental disorders; Psychiatric disease.


Conflict of interest statement

F. Urano received JTV-519 from the National Center for Advancing Translational Sciences for developing small molecule-based therapies for ER stress-related disorders and shares the intellectual property rights related to JTV-519 with the National Institutes of Health. F. Urano is an inventor of the patent related to ER calcium stabilizers, 10,441,574, B2 TREATMENT FOR WOLFRAM SYNDROME AND OTHER ER STRESS DISORDERS. The other authors declare that they have no competing interests.

Figures

Fig. 1
Fig. 1
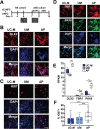
Characterization of cExNPCs and cINPCs from patient-derived iPSCs. a Differentiation schemes for generating cExNPCs and cINPCs, including timeline, small molecules used, and maintenance as a suspended or adherent embryoid body (EB/aEB). b CHRNA7 expression in cExNPCs and cINPCs was analyzed by RT-qPCR. Data is the average +/-SEM from four independent biological replicate experiments (n = 4). c cExNPCs were seeded in equal numbers for each line tested and counted after four days of maintenance (n = 7 biological replicates). d cExNPCs were stained with propium iodide for DNA content and analyzed by FACS. S and 4N (M phase) cells were quantified for each study subject. Average values are shown from seven independent biological replicates (n = 7). e cINPCs were seeded in equal numbers for each line tested and counted after 4 days of maintenance (n = 7 biological replicates). f cINPCs were stained with propidium iodide for DNA content and analyzed by FACS. S and 4N (M phase) cells were quantified for each model. Values are from seven independent biological replicate experiments (n = 7). All significant findings in this manuscript were confirmed in three or more independent biological replicate experiments performed using two clonal lines for the UM and AP models, and one clonal line for the UC-F and UC-M models, as summarized in Additional file 4. Clones used, replicates, and data values are in Additional file 4. Plot shows the median value, calculated by using a Kruskal-Wallis non-parametric test as described in the Methods. P values: *P < 0.05, **P < 0.01, and ***P < 0.001
Fig. 2
Fig. 2
Generation and characterization of cortical neuroids. a Schematic of method used to generate cortical neuroids, by combining cExNPCs and cINPCs (1:1 ratio) and differentiating and maturing them for 15 days. ABC=ascorbic acid, BDNF, and cAMP. See the “Methods” section for further details. bd Immunocytochemistry with antibodies indicated detects cINPCs (DLX2), proliferating NPCs (Ki67), and cExNPCs (TBR1 and PAX6), with representative images from one clonal line per subject shown. e RNA-seq analysis defined differences in gene expression between the AP, UM, and UC-M neuroids for the markers shown (n = 4 independent biological replicates from one clonal line per subject). f Immunocytochemical quantification of the percentage of cells expressing the proliferative marker Ki67, n = 4 biological replicate experiments utilizing two clonal lines for the AP and UM and one clonal line for the UC-M. Clones used, replicates, and data values are in Additional file 4. Scale bars=50μm
Fig. 3
Fig. 3
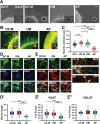
Morphometric analysis of differentiated cortical neuroids. ac Five days after plating cortical neuroids in differentiation media, neurite length was analyzed for each sample type. a Representative light microscopy images are shown. Quantification was performed as described in the “Methods” section, by defining the distance between the border of the plated neuroid and the tips of neurites extending from that neuroid on a per-EB basis. Scale bar=250 μm. b Immunocytochemical analysis of neurite extension using MAP2 staining, with representative images shown. Scale bar=150 μm. c Quantification of neurite extension is shown for seven biological replicate experiments (n = 7). Plot shows the median value, calculated by using Kruskal-Wallis non-parametric tests, as described in the Methods. (d-d’) Neurite length was analyzed in plated MAP2 immunostained neurons, using data from three independent biological replicate experiments (n = 3). (e-e”) Expression of the GABA and glutamate transporters, VGAT and VGLUT, was assessed by immunocytochemical analysis of these neurons. Representative images are shown in e and synaptic puntae were quantified in (e’-e”) for VGAT (e’) and VGLUT (e”). Data were derived by quantifying ~15 stained neuroids derived from four independent biological replicate experiments (n = 4). Clones used, replicates, and data values are in Additional file 4. Scale bar=75 μm. Plot shows the median value, calculated by using Kruskal-Wallis non-parametric tests as described in the “Methods” section. P values: *P < 0.05, **P < 0.01, and ***P < 0.001
Fig. 4
Fig. 4
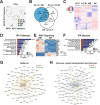
Transcriptomic analysis of differentiated cortical neuroids, defining differential gene expression between the AP and UM. RNA-seq was conducted on cortical neuroids after 15 days of differentiation. a Principal Component Analysis (PCA) of gene expression in differentiated neuroids derived from the UC-M, UC-F, UM, and AP models is displayed as a multidimensional scaling plot derived from four independent biological replicate experiments (n = 4) performed using one clonal line for each subject. Data values are in Additional file 5. b Venn diagram showing differentially expressed genes (DEGs) defined by pairwise comparisons of the AP versus (vs.) UM, AP vs. UC-M, and AP vs. UC-F datasets. AP vs. UM-specific DEGs are shown in blue. c These AP-specific DEGs were further analyzed by hierarchical clustering analysis, with the other samples included for comparison. dh DEGs were assessed by Ingenuity Pathway Analysis (IPA), identifying de AP-enriched pathways, and f disease-related GO terms. d IPA-pathway analysis identified differential enrichment for Wnt signaling-related gene expression, with expression of these genes visualized as a heat map in e; inset at right shows protein levels of two targets in the UM and AP, as assessed by Western blotting, with GAPDH as a loading control. In d and f, the number of genes related to each term is represented on the x-axis, while red and blue color indicates up and downregulated genes, respectively. P values for each term are indicated to the right of each bar. f IPA disease GO terms identified gene networks associated with g behavior and h nervous system development and function. Numbers (#) of upregulated and downregulated genes in each network are indicated. Within each network, red and green symbols indicate upregulated and downregulated genes, respectively, while color intensity indicates the relative degree of differential expression
Fig. 5
Fig. 5
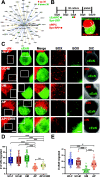
Neuronal migration is compromised in AP-derived cINs and this phenotype is partially reversed by CHIR-99021. a IPA analysis of AP-enriched DEGs (versus the UM sample, Fig. 4 above) identified a cluster of genes which regulate neuronal migration. b Schematic depicting the migration assay, which involves generating neuroids containing Synapsin promoter (Syn)-GFP-expressing cExNPCs (green) and Syn-RFP-expressing (red) cINPCs, apposition of these neuroids, and differentiation and migration of neurons in these co-cultures, with analysis at day 10. Neurons that migrated into the opposite neuroid are indicated by white arrowheads. c Migration of red cINs into the green cExN neuroid, and vice versa, is shown in representative confocal images from assays performed with neuroid co-cultures from all four models. d The number of cINs (red) that migrated into the cExN neuroid were quantified from six independent biological replicate experiments (n = 6), which used two clonal lines for the UM and AP models and one clonal line for the UC-M and UC-F models. Reduced cIN migration in the AP model was partially reversed by addition of CHIR-99021 (CHIR). e Numbers of cExNs (green) that migrated into the cIN neuroid were quantified, using data from six independent biological replicate experiments (n = 6) that used two clonal lines for the UM and AP models and one clonal line for the UC-F/UC-M models. Clones used, replicates, and data values are in Additional file 4. Scale bars=150 μm and higher magnification (BOX)=100 μm. P values: *P < 0.05, **P < 0.01, and ***P < 0.001 were calculated by using Kruskal-Wallis non-parametric tests as described in the “Methods” section. Plot shows the median value, calculated as described in the “Methods” section
Fig. 6
Fig. 6
AP-derived cINPCs exhibit elevated ER stress, which is rescued by the ryanodine receptor antagonist JTV-519. a, b Analysis of differential gene expression between the models did not identify a significant difference in expression of ER chaperones or ER stress genes in a, while b AP-derived cortical neuroids exhibited increased expression of the neural-enriched ryanodine receptor RYR3. RNA-seq data is derived from four biological replicate experiments (n = 4), which used one clonal line per model as described in the “Methods” section. Clones, replicates, and data values are in Additional file 5. c Expression of a Secreted ER Calcium Monitoring Protein Gaussia Luciferase stress sensor (SERCaMP-GLUC) in cINPCs demonstrated elevated ER stress in AP-derived cINPCs. d The use of the SERCaMP-GLUC reporter assay in the AP model demonstrated that this elevated ER stress phenotype could be suppressed by treatment with the ryanodine receptor antagonist JTV-519, but not with the chemical chaperones PBA and TUDCA or with another ryanodine receptor antagonist, dantrolene. Four independent biological replicate experiments (n = 4) were performed using two clonal lines for the AP and UM models and one clonal line for the UC-F and UC-M models. Clones, replicates, and data values are in Additional file 4. Plot shows the median value, calculated by using a Kruskal-Wallis non-parametric test as described in the Methods. P values: *P < 0.05, **P < 0.01, and ***P < 0.001
Fig. 7
Fig. 7
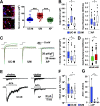
Functional differences in neurons derived from these models were assessed by voltage clamp analysis. a Quantitation of neuron soma area revealed a larger soma size in UM-derived neurons. Left: representative confocal images comparing the AP and UM models, with arrows highlighting a cell soma; Right: quantitation of neuron soma area for the three models. Data is derived from three biological replicate experiments (n = 3) using two clonal lines for the AP and UM models, and one clonal line for the UC-M model. Data values are in Additional file 4. Plot shows the median value, calculated by using a Kruskal-Wallis non-parametric test as described in the “Methods” section. b UM-derived neurons exhibit significantly higher cell capacitance and lower input resistance than UC-M- or AP-derived neurons. c Steady-state outward current density at 0mV was significantly greater for UC-M- than for UM- or AP-derived neurons. Whole-cell inward and outward current density for currents were evoked by a voltage step from −80 to 0 mV. d Collectively, iPSC-derived cINs from all three subject-derived models exhibited higher input resistance than cExNs. e Whole-cell currents were evoked by 500 μM Choline or ACh in neurons, with representative data shown for the UC-M (left) versus AP (right) models. f The integrated ACh-evoked current density was significantly smaller for AP-derived neurons and g the ACh/choline ratio for integrated current was smaller for both AP- and UM-derived neurons, by comparison with UM-C. Data were derived from three biological replicate experiments (n = 3), which used two clonal lines for the AP and UM models, and one clonal line for the UC-M model. Box plots show combined data from cExNs and cINs except in panel (d). P <0.05, was determined by 2-way ANOVA on ranks with post hoc Student-Newman-Keuls test. A complete summary of the physiological recordings performed is provided in Additional file 13
Fig. 8
Fig. 8
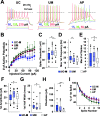
Functional differences in neurons derived from these models were assessed by current clamp analysis. ac Action potentials elicited by three different 800 msec depolarizing current injections in iPSC-derived cExNs from the UC-M, UM, and AP models. b Exponential fits (smooth curves) indicate significantly fewer action potentials elicited on average by current injections up to 120 pA in neurons derived from the UC-M model, by comparison with the UM and AP models (p < 0.05, F-statistic). Recordings under current clamp also revealed c a more depolarized threshold for action potential initiation in UC-M-derived neurons compared with both UM- and AP-derived models and d a higher initial spike frequency in UC-M compared with UM-derived neurons. eg UM-derived neurons exhibited a significantly higher e maximal number of spikes and f first spike amplitude, and a G briefer first spike half-width than UC-M or AP neurons. h-i Compared to UC-M and UM neurons, AP-derived neurons exhibited h a substantially lower rheobase and I a more significant decline in average action potential peak amplitude with each succeeding spike (a and i). Plots show combined data from cExNs and cINs (n = 3). P < 0.05 was defined by 2-way ANOVA on ranks with post hoc Student-Newman-Keuls test. A complete summary of the physiological recordings performed is also provided in Additional file 13

Similar articles

Cited by

References

    1. Grayton HM, Fernandes C, Rujescu D, Collier DA. Copy number variations in neurodevelopmental disorders. Prog Neurobiol. 2012;99(1):81–91. doi: 10.1016/j.pneurobio.2012.07.005. - DOI - PubMed
    1. Cook EH, Jr, Scherer SW. Copy-number variations associated with neuropsychiatric conditions. Nature. 2008;455(7215):919–923. doi: 10.1038/nature07458. - DOI - PubMed
    1. Deshpande A, Weiss LA. Recurrent reciprocal copy number variants: roles and rules in neurodevelopmental disorders. Dev Neurobiol. 2018;78(5):519–530. doi: 10.1002/dneu.22587. - DOI - PubMed
    1. Rosenfeld JA, Coe BP, Eichler EE, Cuckle H, Shaffer LG. Estimates of penetrance for recurrent pathogenic copy-number variations. Genet Med. 2013;15(6):478–481. doi: 10.1038/gim.2012.164. - DOI - PMC - PubMed
    1. Newman S, Hermetz KE, Weckselblatt B, Rudd MK. Next-generation sequencing of duplication CNVs reveals that most are tandem and some create fusion genes at breakpoints. Am J Hum Genet. 2015;96(2):208–220. doi: 10.1016/j.ajhg.2014.12.017. - DOI - PMC - PubMed

Publication types

Substances