

Onset of effects of non-pharmaceutical interventions on COVID-19 infection rates in 176 countries
- PMID: 34320982
- PMCID: PMC8318058
- DOI: 10.1186/s12889-021-11530-0
Onset of effects of non-pharmaceutical interventions on COVID-19 infection rates in 176 countries
Abstract
Background: During the initial phase of the global COVID-19 outbreak, most countries responded with non-pharmaceutical interventions (NPIs). In this study we investigate the general effectiveness of these NPIs, how long different NPIs need to be in place to take effect, and how long they should be in place for their maximum effect to unfold.
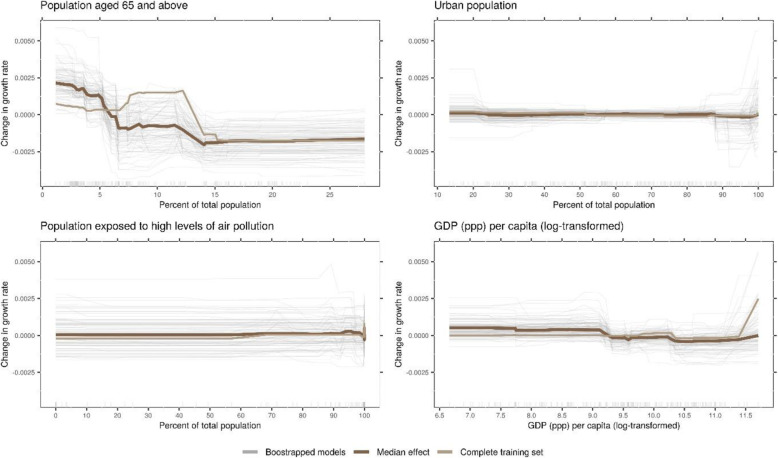
Methods: We used global data and a non-parametric machine learning model to estimate the effects of NPIs in relation to how long they have been in place. We applied a random forest model and used accumulated local effect (ALE) plots to derive estimates of the effectiveness of single NPIs in relation to their implementation date. In addition, we used bootstrap samples to investigate the variability in these ALE plots.
Results: Our results show that closure and regulation of schools was the most important NPI, associated with a pronounced effect about 10 days after implementation. Restrictions of mass gatherings and restrictions and regulations of businesses were found to have a more gradual effect, and social distancing was associated with a delayed effect starting about 18 days after implementation.
Conclusions: Our results can inform political decisions regarding the choice of NPIs and how long they need to be in place to take effect.
Keywords: Accumulated local effect plots; COVID-19; Containment measures; Coronavirus; Crosscountry study; Government measures; Health policy; Infection rate; Machine learning; Mitigation measures; Non-pharmaceutical interventions.
© 2021. The Author(s).
Conflict of interest statement
The authors declare that they have no competing interests.
Figures


References
-
- WHO. Coronavirus disease 2019 (COVID-19) situation report 97. 2020. https://www.who.int/docs/default-source/coronaviruse/situation-reports/2.... Accessed 26 Apr 2020.
-
- Bedford J, Enria D, Giesecke J, Heymann DL, Ihekweazu C, Kobinger G, Lane HC, Memish Z, Oh MD, Sall AA, Schuchat A, Ungchusak K, Wieler LH, WHO Strategic and Technical Advisory Group for Infectious Hazards COVID-19: towards controlling of a pandemic. Lancet. 2020;395(10229):1015–1018. doi: 10.1016/S0140-6736(20)30673-5. - DOI - PMC - PubMed
-
- Viner RM, Russell SJ, Croker H, Packer J, Ward J, Stansfield C, Mytton O, Bonell C, Booy R. School closure and management practices during coronavirus outbreaks including COVID-19: a rapid systematic review. Lancet Child Adolesc Health. 2020;4(5):397–404. doi: 10.1016/S2352-4642(20)30095-X. - DOI - PMC - PubMed
Publication types
MeSH terms
LinkOut - more resources
Full Text Sources
Medical
