. 2021 Jul 28;7(31):eabh2169.
doi: 10.1126/sciadv.abh2169. Print 2021 Jul.

A single-cell type transcriptomics map of human tissues

Affiliations

A single-cell type transcriptomics map of human tissues

Max Karlsson et al. Sci Adv. .

Abstract

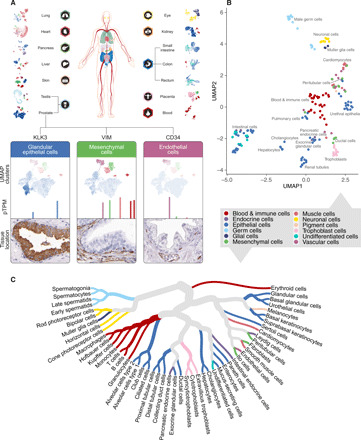
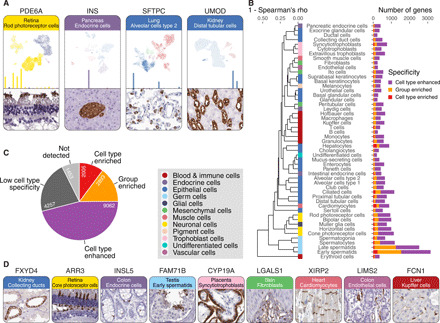
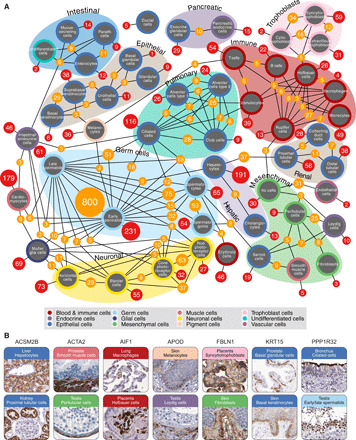
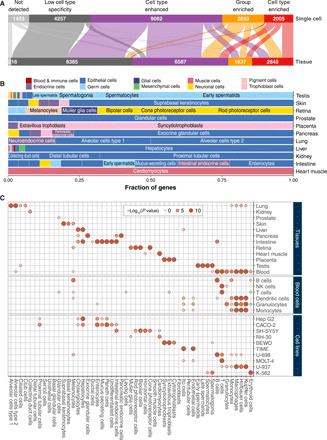
Advances in molecular profiling have opened up the possibility to map the expression of genes in cells, tissues, and organs in the human body. Here, we combined single-cell transcriptomics analysis with spatial antibody-based protein profiling to create a high-resolution single-cell type map of human tissues. An open access atlas has been launched to allow researchers to explore the expression of human protein-coding genes in 192 individual cell type clusters. An expression specificity classification was performed to determine the number of genes elevated in each cell type, allowing comparisons with bulk transcriptomics data. The analysis highlights distinct expression clusters corresponding to cell types sharing similar functions, both within the same organs and between organs.


Figures

Fig. 1
Fig. 1. Annotating 51 cell types from 13 tissues using single-cell transcriptomics data.
(A) scRNA-seq data from 13 tissues and blood [peripheral blood mononuclear cells (PBMCs)] were processed through a clustering algorithm, and each cluster was annotated using known markers. All cells from a cluster were pooled, and the average transcript per million was calculated for all protein-coding genes. (B) UMAP plot showing the relationship of all cell types from all analyzed tissues. The color-coding corresponds to 12 main cell type groups. (C) Cell type dendrogram showing the relationship between all 51 identified main single cell types based on genome-wide expression.
Fig. 2
Fig. 2. An open access single–cell type transcriptomics atlas of human tissues.
(A) Some examples of data visualization in the HPA Single Cell Type Atlas with UMAP plots from the single-cell analysis in each cluster, the resulting bar plot showing the RNA level gene expression in each cell type, and the corresponding tissue images based on immunohistochemistry. (B) Number of cell type–enriched, group-enriched, and cell type–enhanced genes for each of the 51 cell types based on the single–cell type data. (C) Number of genes classified for single–cell type specificity. (D) Some examples of immunohistochemical tissue images for genes identified as elevated in single cell types: FXYD4, an ion transport regulator localized to renal collecting ducts; ARR3, a protein suggested to play a role in retina-specific signal transduction, localized to the cone photoreceptor cells in eye; INSL5, a protein with essentially unknown function but suggested to play a role as a gut hormone (27), localized to intestinal neuroendocrine cells; FAM71B, an uncharacterized protein, here specifically localized to early spermatids; CYP19A, a member of the cytochrome P450 superfamily of enzymes, here localized to placental syncytiotrophoblasts; LGALS1, a lectin acting as an autocrine negative growth factor regulating cell proliferation, here present in fibroblasts; XIRP2, an actin-binding protein localized to the intercalated discs in cardiomyocytes; LIMS2, a focal adhesion protein modulating cell spreading and migration, here localized to endothelial cells; and finally FCN1, an extracellular lectin involved in innate immunity, localized to hepatic Kupffer cells/macrophages.
Fig. 3
Fig. 3. The number of cell type– and group-enriched genes for each cell type.
(A) Network plot showing the numbers of cell type–enriched genes (red nodes) and group-enriched genes (orange nodes). Cell type nodes are colored by the 12 different cell type groups as shown in the color legend. Clusters of cell types of related function or origin are visualized with annotations with different background colors. (B) Some examples of group-enriched genes shared by cell types of different tissue origin. The color codes correspond to the 12 different cell type groups as indicated in the color legend: ACSM2B, involved in fatty acid metabolism, localized to liver hepatocytes and renal proximal tubules; ACTA2, a cytoskeleton protein that produces microfilaments allowing the contractile movement of smooth muscle cells, distinctly expressed in smooth muscle cells as well as testicular peritubular cells; AIF1, an actin-binding protein involved in phagocytosis and macrophage activation, expressed in macrophages residing in different organs such as lung and placenta; APOD, a serum glycoprotein involved in the transport of hydrophobic ligands, present in skin melanocytes and testicular Leydig cells that are both highly associated with production of hydrophobic compounds; FBLN1, a glycoprotein incorporated into fibronectin-containing extracellular matrix (ECM), present in skin fibroblasts and trophoblastic cells, both involved in ECM remodeling; KRT15, a basal cell marker, localized to basal cells of all types of epithelia and here present in both prostate and skin epithelia; and PPP1R32, an uncharacterized phosphatase, here localized to both fallopian tube cilia and testis spermatids, cell types that share functions related to motility.
Fig. 4
Fig. 4. A comparison of gene specificity between single cell type and tissue.
(A) Alluvial diagram showing the number of genes of respective specificity category for single cell (top) and tissue (bottom). (B) Bar plot showing the fraction of single–cell type–enriched genes among the tissue-enriched genes. The color code indicates the cell type groups. The cells with most shared enriched genes with tissues are labeled. (C) Bubble heatmap showing the significance (indicated by dot size and color) of shared enriched genes between single cell types (x axis) and tissues (top), blood lineage (middle), and human cell lines (bottom). Notably, if the overlap of enriched genes is not statistically significant (hypergeometric test, P > 0.05), the corresponding dot is removed.

References

    1. Crosetto N., Bienko M., van Oudenaarden A., Spatially resolved transcriptomics and beyond. Nat. Rev. Genet. 16, 57–66 (2015). - PubMed
    1. Luecken M. D., Theis F. J., Current best practices in single-cell RNA-seq analysis: A tutorial. Mol. Syst. Biol. 15, e8746 (2019). - PMC - PubMed
    1. Regev A., Teichmann S. A., Lander E. S., Amit I., Benoist C., Birney E., Bodenmiller B., Campbell P., Carninci P., Clatworthy M., Clevers H., Deplancke B., Dunham I., Eberwine J., Eils R., Enard W., Farmer A., Fugger L., Göttgens B., Hacohen N., Haniffa M., Hemberg M., Kim S., Klenerman P., Kriegstein A., Lein E., Linnarsson S., Lundberg E., Lundeberg J., Majumder P., Marioni J. C., Merad M., Mhlanga M., Nawijn M., Netea M., Nolan G., Pe’er D., Phillipakis A., Ponting C. P., Quake S., Reik W., Rozenblatt-Rosen O., Sanes J., Satija R., Schumacher T. N., Shalek A., Shapiro E., Sharma P., Shin J. W., Stegle O., Stratton M., Stubbington M. J. T., Theis F. J., Uhlen M., van Oudenaarden A., Wagner A., Watt F., Weissman J., Wold B., Xavier R., Yosef N.; Human Cell Atlas Meeting Participants , The Human Cell Atlas. eLife 6, (2017). - PMC - PubMed
    1. Uhlen M., Fagerberg L., Hallstrom B. M., Lindskog C., Oksvold P., Mardinoglu A., Sivertsson A., Kampf C., Sjostedt E., Asplund A., Olsson I., Edlund K., Lundberg E., Navani S., Szigyarto C. A. K., Odeberg J., Djureinovic D., Takanen J. O., Hober S., Alm T., Edqvist P. H., Berling H., Tegel H., Mulder J., Rockberg J., Nilsson P., Schwenk J. M., Hamsten M., von Feilitzen K., Forsberg M., Persson L., Johansson F., Zwahlen M., von Heijne G., Nielsen J., Ponten F., Tissue-based map of the human proteome. Science 347, 1260419 (2015). - PubMed
    1. Sjostedt E., Zhong W., Fagerberg L., Karlsson M., Mitsios N., Adori C., Oksvold P., Edfors F., Limiszewska A., Hikmet F., Huang J., Du Y., Lin L., Dong Z., Yang L., Liu X., Jiang H., Xu X., Wang J., Yang H., Bolund L., Mardinoglu A., Zhang C., von Feilitzen K., Lindskog C., Pontén F., Luo Y., Hökfelt T., Uhlén M., Mulder J., An atlas of the protein-coding genes in the human, pig, and mouse brain. Science 367, eaay5947 (2020). - PubMed

Publication types

LinkOut - more resources