. 2021 Jul 28:gutjnl-2021-325036.
doi: 10.1136/gutjnl-2021-325036. Online ahead of print.

Unannotated small RNA clusters associated with circulating extracellular vesicles detect early stage liver cancer

Affiliations

Unannotated small RNA clusters associated with circulating extracellular vesicles detect early stage liver cancer

Johann von Felden et al. Gut. .

Abstract

Objective: Surveillance tools for early cancer detection are suboptimal, including hepatocellular carcinoma (HCC), and biomarkers are urgently needed. Extracellular vesicles (EVs) have gained increasing scientific interest due to their involvement in tumour initiation and metastasis; however, most extracellular RNA (exRNA) blood-based biomarker studies are limited to annotated genomic regions.

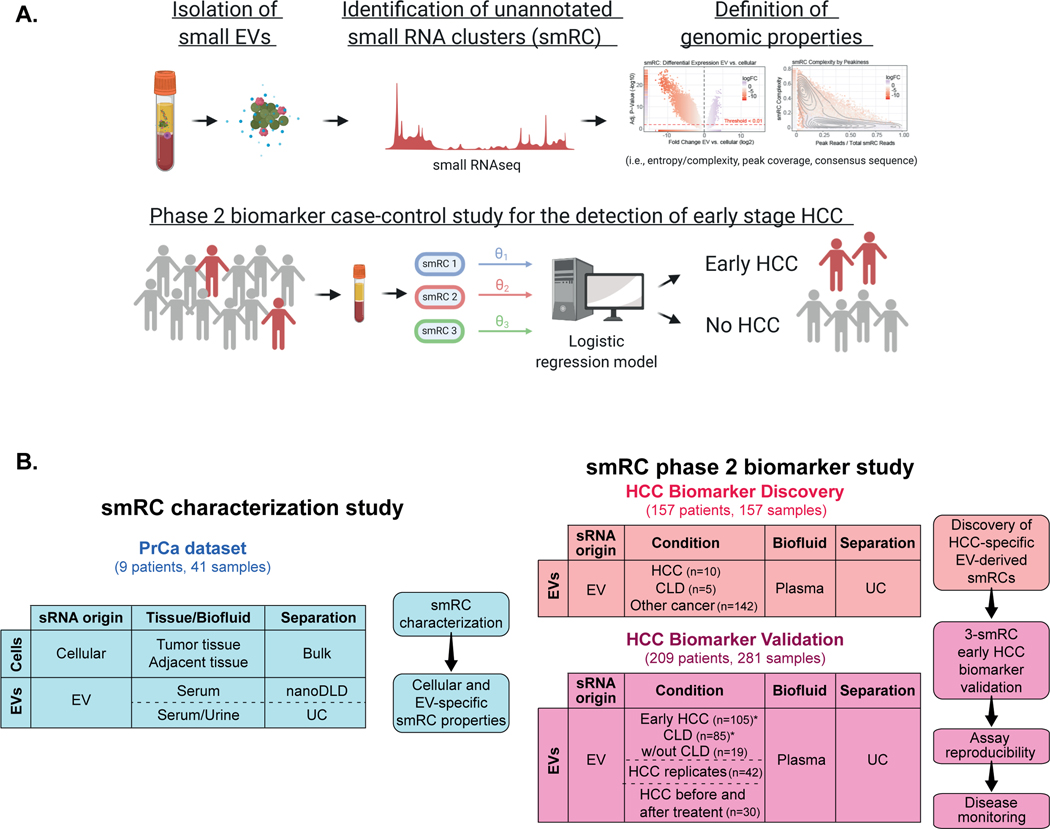
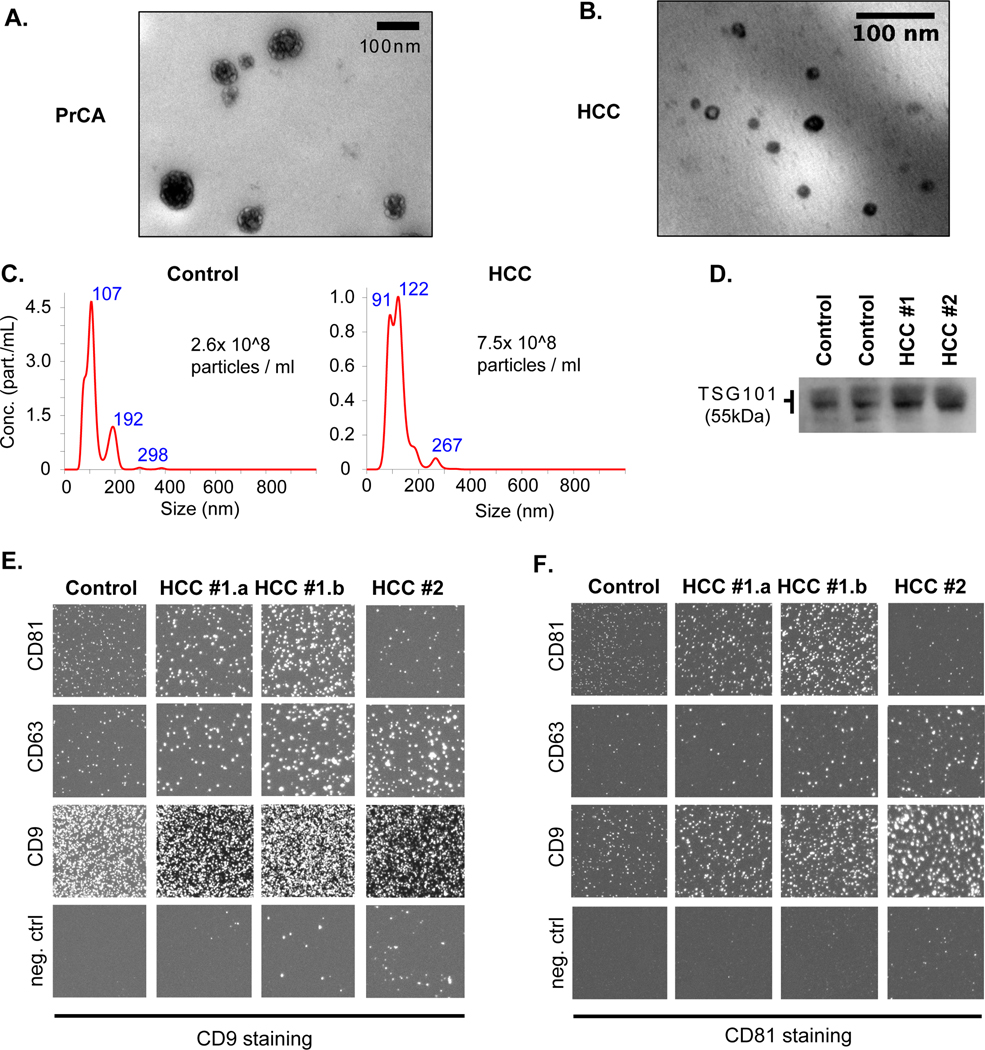
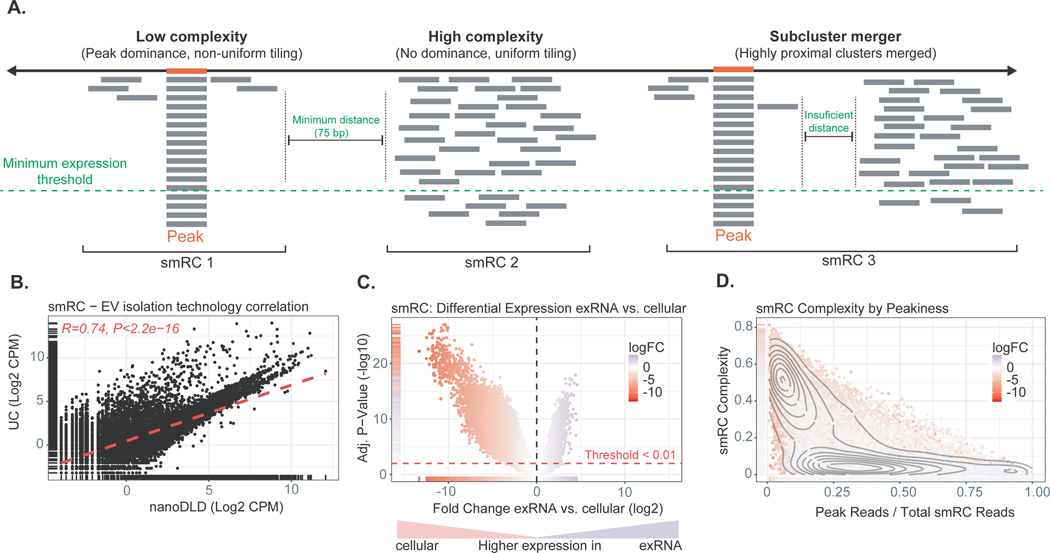
Design: EVs were isolated with differential ultracentrifugation and integrated nanoscale deterministic lateral displacement arrays (nanoDLD) and quality assessed by electron microscopy, immunoblotting, nanoparticle tracking and deconvolution analysis. Genome-wide sequencing of the largely unexplored small exRNA landscape, including unannotated transcripts, identified and reproducibly quantified small RNA clusters (smRCs). Their key genomic features were delineated across biospecimens and EV isolation techniques in prostate cancer and HCC. Three independent exRNA cancer datasets with a total of 479 samples from 375 patients, including longitudinal samples, were used for this study.

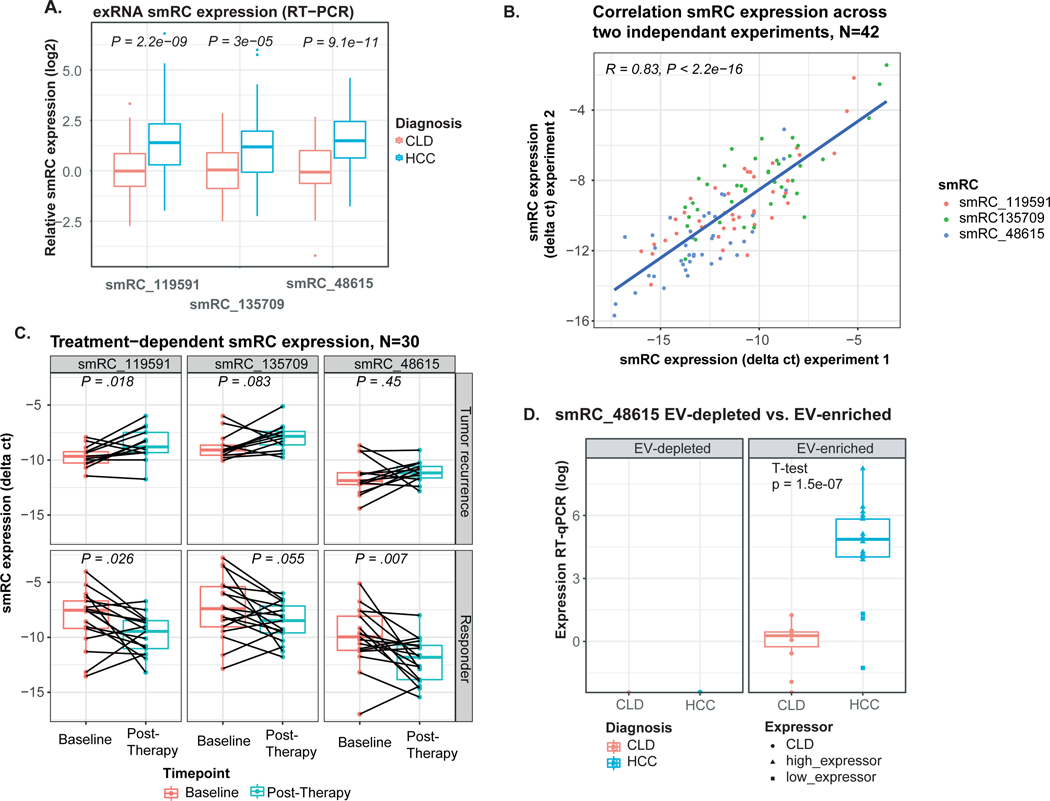
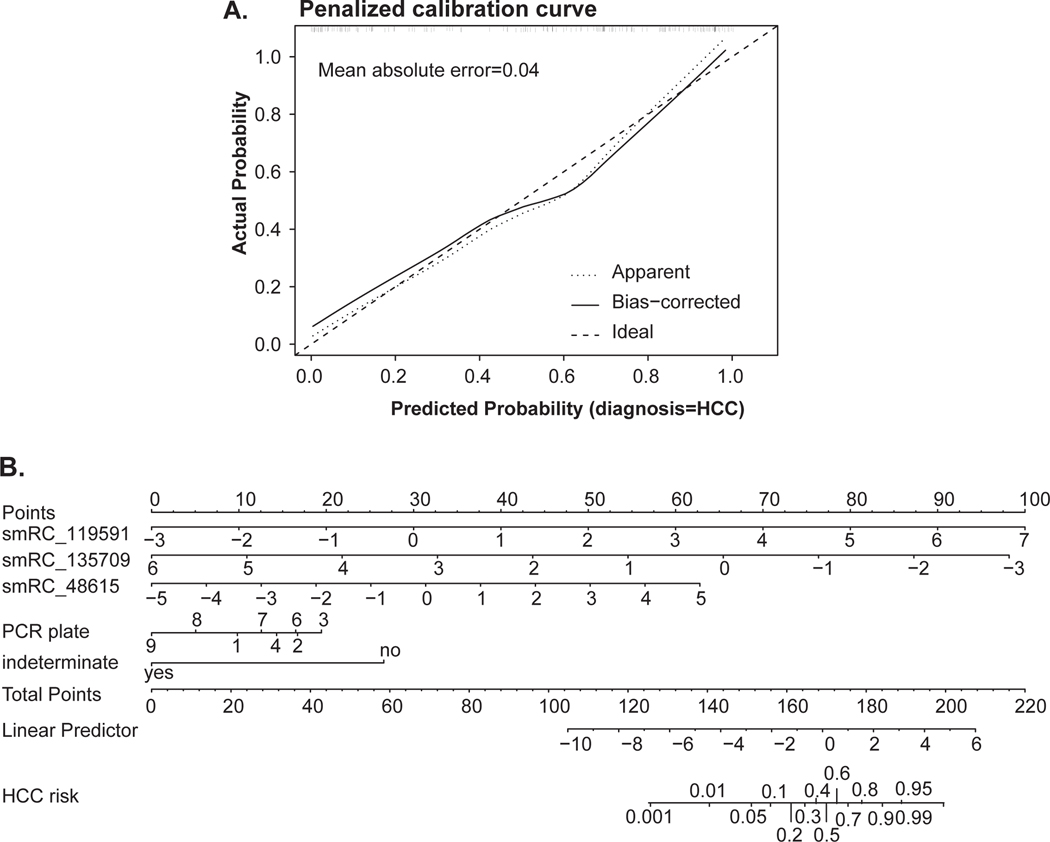
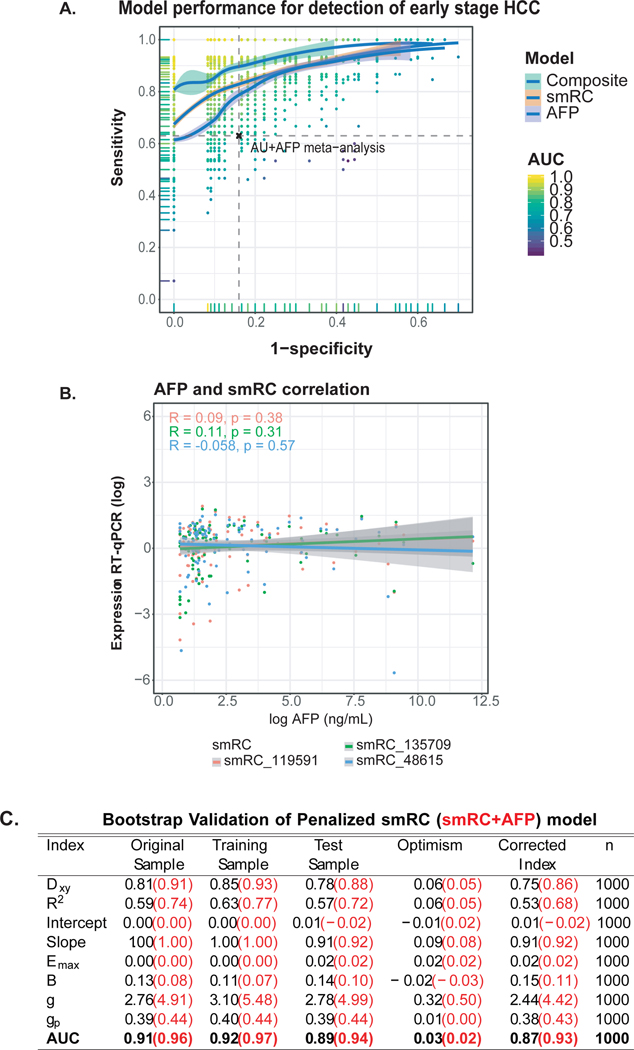
Results: ExRNA smRCs were dominated by uncharacterised, unannotated small RNA with a consensus sequence of 20 nt. An unannotated 3-smRC signature was significantly overexpressed in plasma exRNA of patients with HCC (p<0.01, n=157). An independent validation in a phase 2 biomarker case-control study revealed 86% sensitivity and 91% specificity for the detection of early HCC from controls at risk (n=209) (area under the receiver operating curve (AUC): 0.87). The 3-smRC signature was independent of alpha-fetoprotein (p<0.0001) and a composite model yielded an increased AUC of 0.93.

Conclusion: These findings directly lead to the prospect of a minimally invasive, blood-only, operator-independent clinical tool for HCC surveillance, thus highlighting the potential of unannotated smRCs for biomarker research in cancer.

Keywords: cancer prevention; gene expression; hepatobiliary cancer; surveillance; tumour markers.


Conflict of interest statement

Competing interests: JvF, BL and AV are inventors in a provisional patent application for the 3-smRC signature. JvF received advisory board fees from Roche. DD'A received consulting fees from Almylam and Novartis. JML is receiving research support from Bayer HealthCare Pharmaceuticals, Eisai Inc, Bristol-Myers Squibb, Boehringer-Ingelheim and Ipsen, and consulting fees from Eli Lilly, Bayer HealthCare Pharmaceuticals, Bristol-Myers Squibb, Eisai Inc, Celsion Corporation, Exelixis, Merck, Ipsen, Genentech, Roche, Glycotest, Nucleix, Sirtex, Mina Alpha Ltd and AstraZeneca. AV has received consulting fees from Boehringer Ingelheim, Guidepoint and Fujifilm; advisory board fees from Bristol-Myers Squibb, Genentech, Gilead, Nucleix and NGM Pharmaceuticals; and research support from Eisai Pharmaceuticals. The remaining authors have nothing to declare in relation to this manuscript.

Figures

Figure 1.
Figure 1.. Study summary and flow chart for sample distribution.
(A) small RNA clusters (smRCs) from unannotated genomic regions were identified by unsupervised small RNA sequencing from circulating EVs and characterized. Their clinical utility was confirmed in a phase 2 biomarker case-control study for the detection of early stage HCC. (Created with BioRender.com.) (B) Schematic view of study flow diagram with different cohorts, and available specimen and separation method for each cohort. Three independent datasets with a total of 479 samples from 375 patients were included.
Figure 2.
Figure 2.. Quality assessment of EV enrichment process for exRNA extractions from human blood samples.
(A, B) Transmission electron microscopy image of prostate cancer serum isolate (A) and HCC plasma isolate (B). (C) Nanoparticle tracking analysis (Nanosight®) results in the plasma isolate of a control (left) and HCC patient (right) with corresponding size distribution and estimated particle concentration. (D) Western Blotting image of protein lysate from isolate against TSG101 (~55 kDa) in two control (left) and two HCC (right) patients. (E,F) Immunolabeling of the isolate with Exoview™. Isolates were captured by indicated antibodies (CD81, CD63, CD9, control IgG) on a chip and stained with CD9 (E) or CD81 (F) antibodies to visualize different EV subpopulations in one control and three HCC samples (#1.a and #1.b represent technical replicates from the same patient).
Figure 3.
Figure 3.. Key properties of small RNA clusters (smRCs).
(A) Minimum coverage and sub-read length minimal spacing define smRCs. Read tiling complexity captures heterogeneity of smRC read distribution. (B) Correlation of smRC expression across different EV enrichment methods (i.e., ultracentrifugation, UC, and nanoDLD). (C) Volcano plot for differential expression between smRC of cellular versus exRNA origin. (D) smRC complexity as a function of peak coverage colored by differential smRC expression between cellular and exRNA origin. smRCs enriched in exRNAs (purple) present with low complexity and higher peak coverage, whereas cellular smRCs (red) are more frequently of high complexity and lower peak coverage.
Figure 4.
Figure 4.. smRC expression in ‘HCC biomarker validation’ cohort.
(A) Expression for each smRC between HCC patients and chronic liver disease controls (CLD) (center line, median; box limits, upper and lower quartiles; whiskers, 1.5x interquartile range; points, outliers). (B) Correlation of biomarker analysis for all three smRCs in 42 patients across two independent experiments, including EV enrichment from plasma, exRNA extraction and RT-qPCR. (C) Longitudinal analysis of smRC expression in 30 patients with available sequential blood samples before and after HCC treatment (responders n=13, tumor recurrence n=17, paired t-test). Displayed is the smRC expression as delta between ct values of the spike-in control and respective smRC; smaller delta equals higher expression of the smRC. (D) Expression of smRC-48615 in EV-enriched isolates and EV-depleted plasma. Displayed are samples from HCC and CLD controls. Triangles indicate HCC samples with relatively high expression, rectangles indicate samples with lower expression.
Figure 5.
Figure 5.
(A) Calibration curve for penalized smRC logistic regression model to predict early HCC, with mean error 0.04. (B) Nomogram for 3-smRC signature to predict early stage HCC.
Figure 6.
Figure 6.. Performance of 3-smRC signature in a phase 2 biomarker case-control study.
(A) ROC curve for maximized gain-of-certainty across repeated cross validation. Each point represents a pair of sensitivities and specificities that maximize gain-in-certainty (i.e. sensitivity + specificity) from a test validation ROC curve, whose AUC colors the point. The loess curves trace the best density fit of points across this space, with 95% confidence intervals shown in gray. (B) AFP and smRC correlation plot. (C) Bootstrap validation parameters for smRC and smRC+AFP model. Dxy: Somers’ rank correlation between the observed HCC status and predicted HCC probabilities; Emax: maximum absolute calibration error on probability scale; B: Brier score; g: Gini’s mean difference of log-odds between HCC and CLD; gp: Gini’s mean difference in probability scale; AUC: Area Under the Receiver Operating Curve (ROC).

Comment in

References

    1. Mathieu M, Martin-Jaular L, Lavieu G, et al. Specificities of secretion and uptake of exosomes and other extracellular vesicles for cell-to-cell communication. Nat Cell Biol 2019;21:9–17. - PubMed
    1. Kalluri R, LeBleu VS. The biology, function, and biomedical applications of exosomes. Science 2020;367. doi:10.1126/science.aau6977 - DOI - PMC - PubMed
    1. van Niel G, D’Angelo G, Raposo G. Shedding light on the cell biology of extracellular vesicles. Nat Rev Mol Cell Biol 2018;19:213–28. - PubMed
    1. Murillo OD, Thistlethwaite W, Rozowsky J, et al. exRNA Atlas Analysis Reveals Distinct Extracellular RNA Cargo Types and Their Carriers Present across Human Biofluids. Cell 2019;177:463–77.e15. - PMC - PubMed
    1. Kosaka N, Yoshioka Y, Fujita Y, et al. Versatile roles of extracellular vesicles in cancer. J Clin Invest 2016;126:1163–72. - PMC - PubMed