

Activation and Kinetics of Circulating T Follicular Helper Cells, Specific Plasmablast Response, and Development of Neutralizing Antibodies following Yellow Fever Virus Vaccination
- PMID: 34321231
- PMCID: PMC8358921
- DOI: 10.4049/jimmunol.2001381
Activation and Kinetics of Circulating T Follicular Helper Cells, Specific Plasmablast Response, and Development of Neutralizing Antibodies following Yellow Fever Virus Vaccination
Abstract
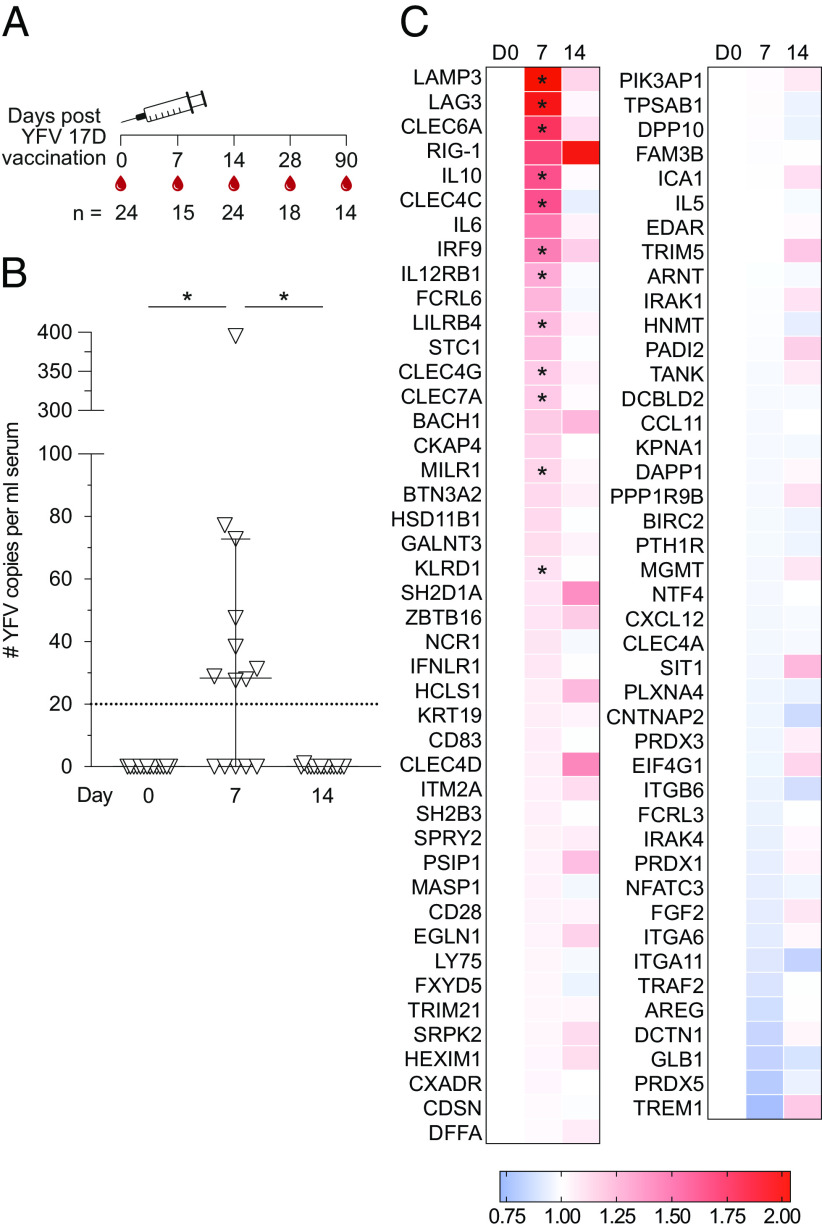
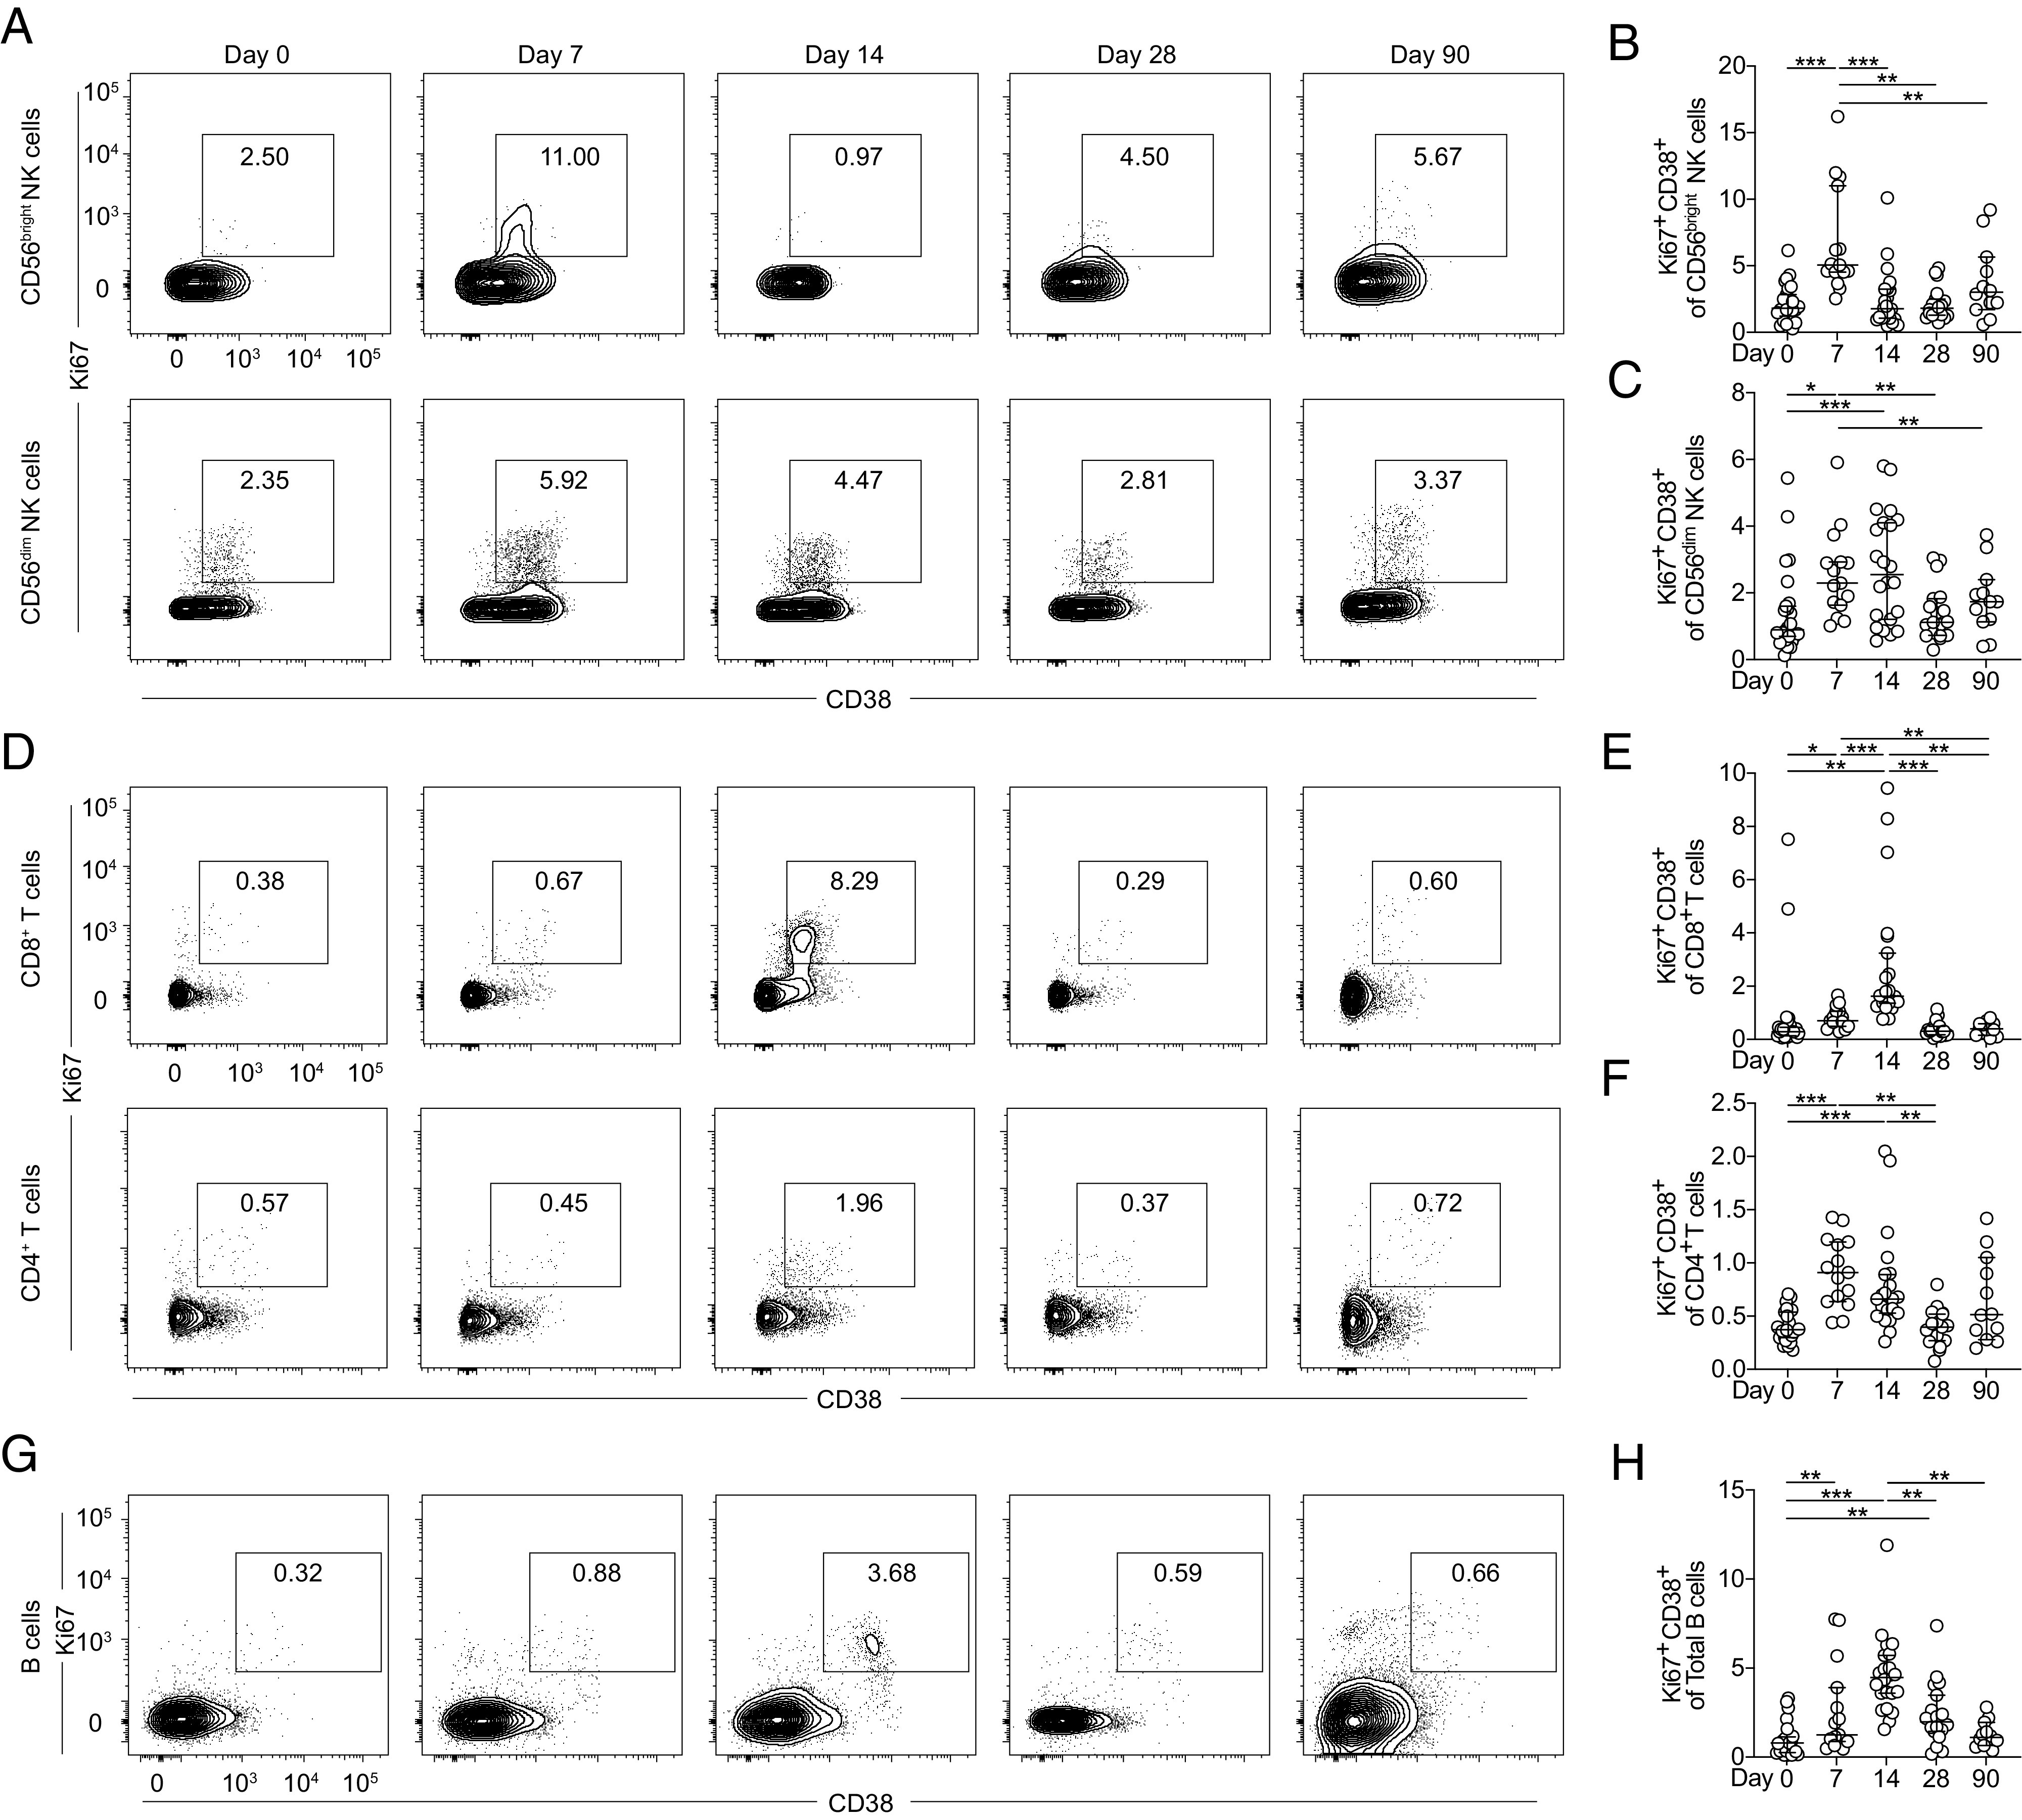
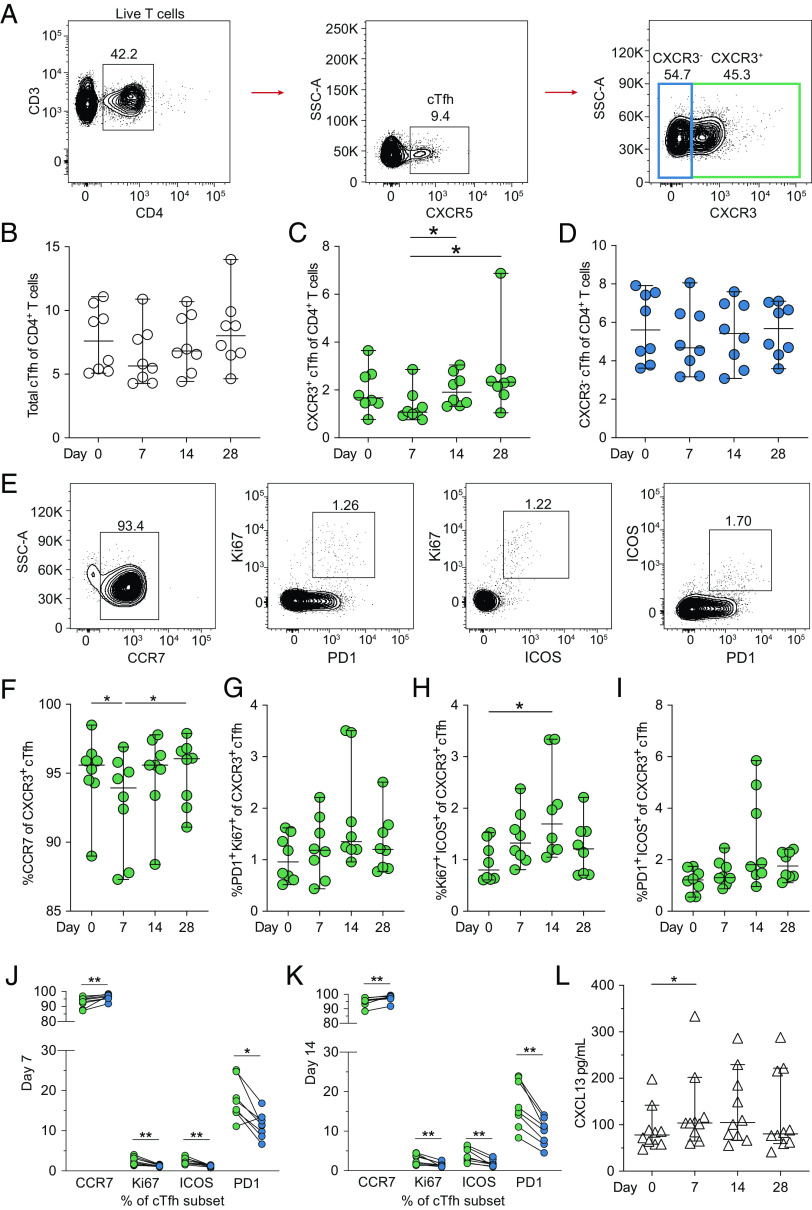
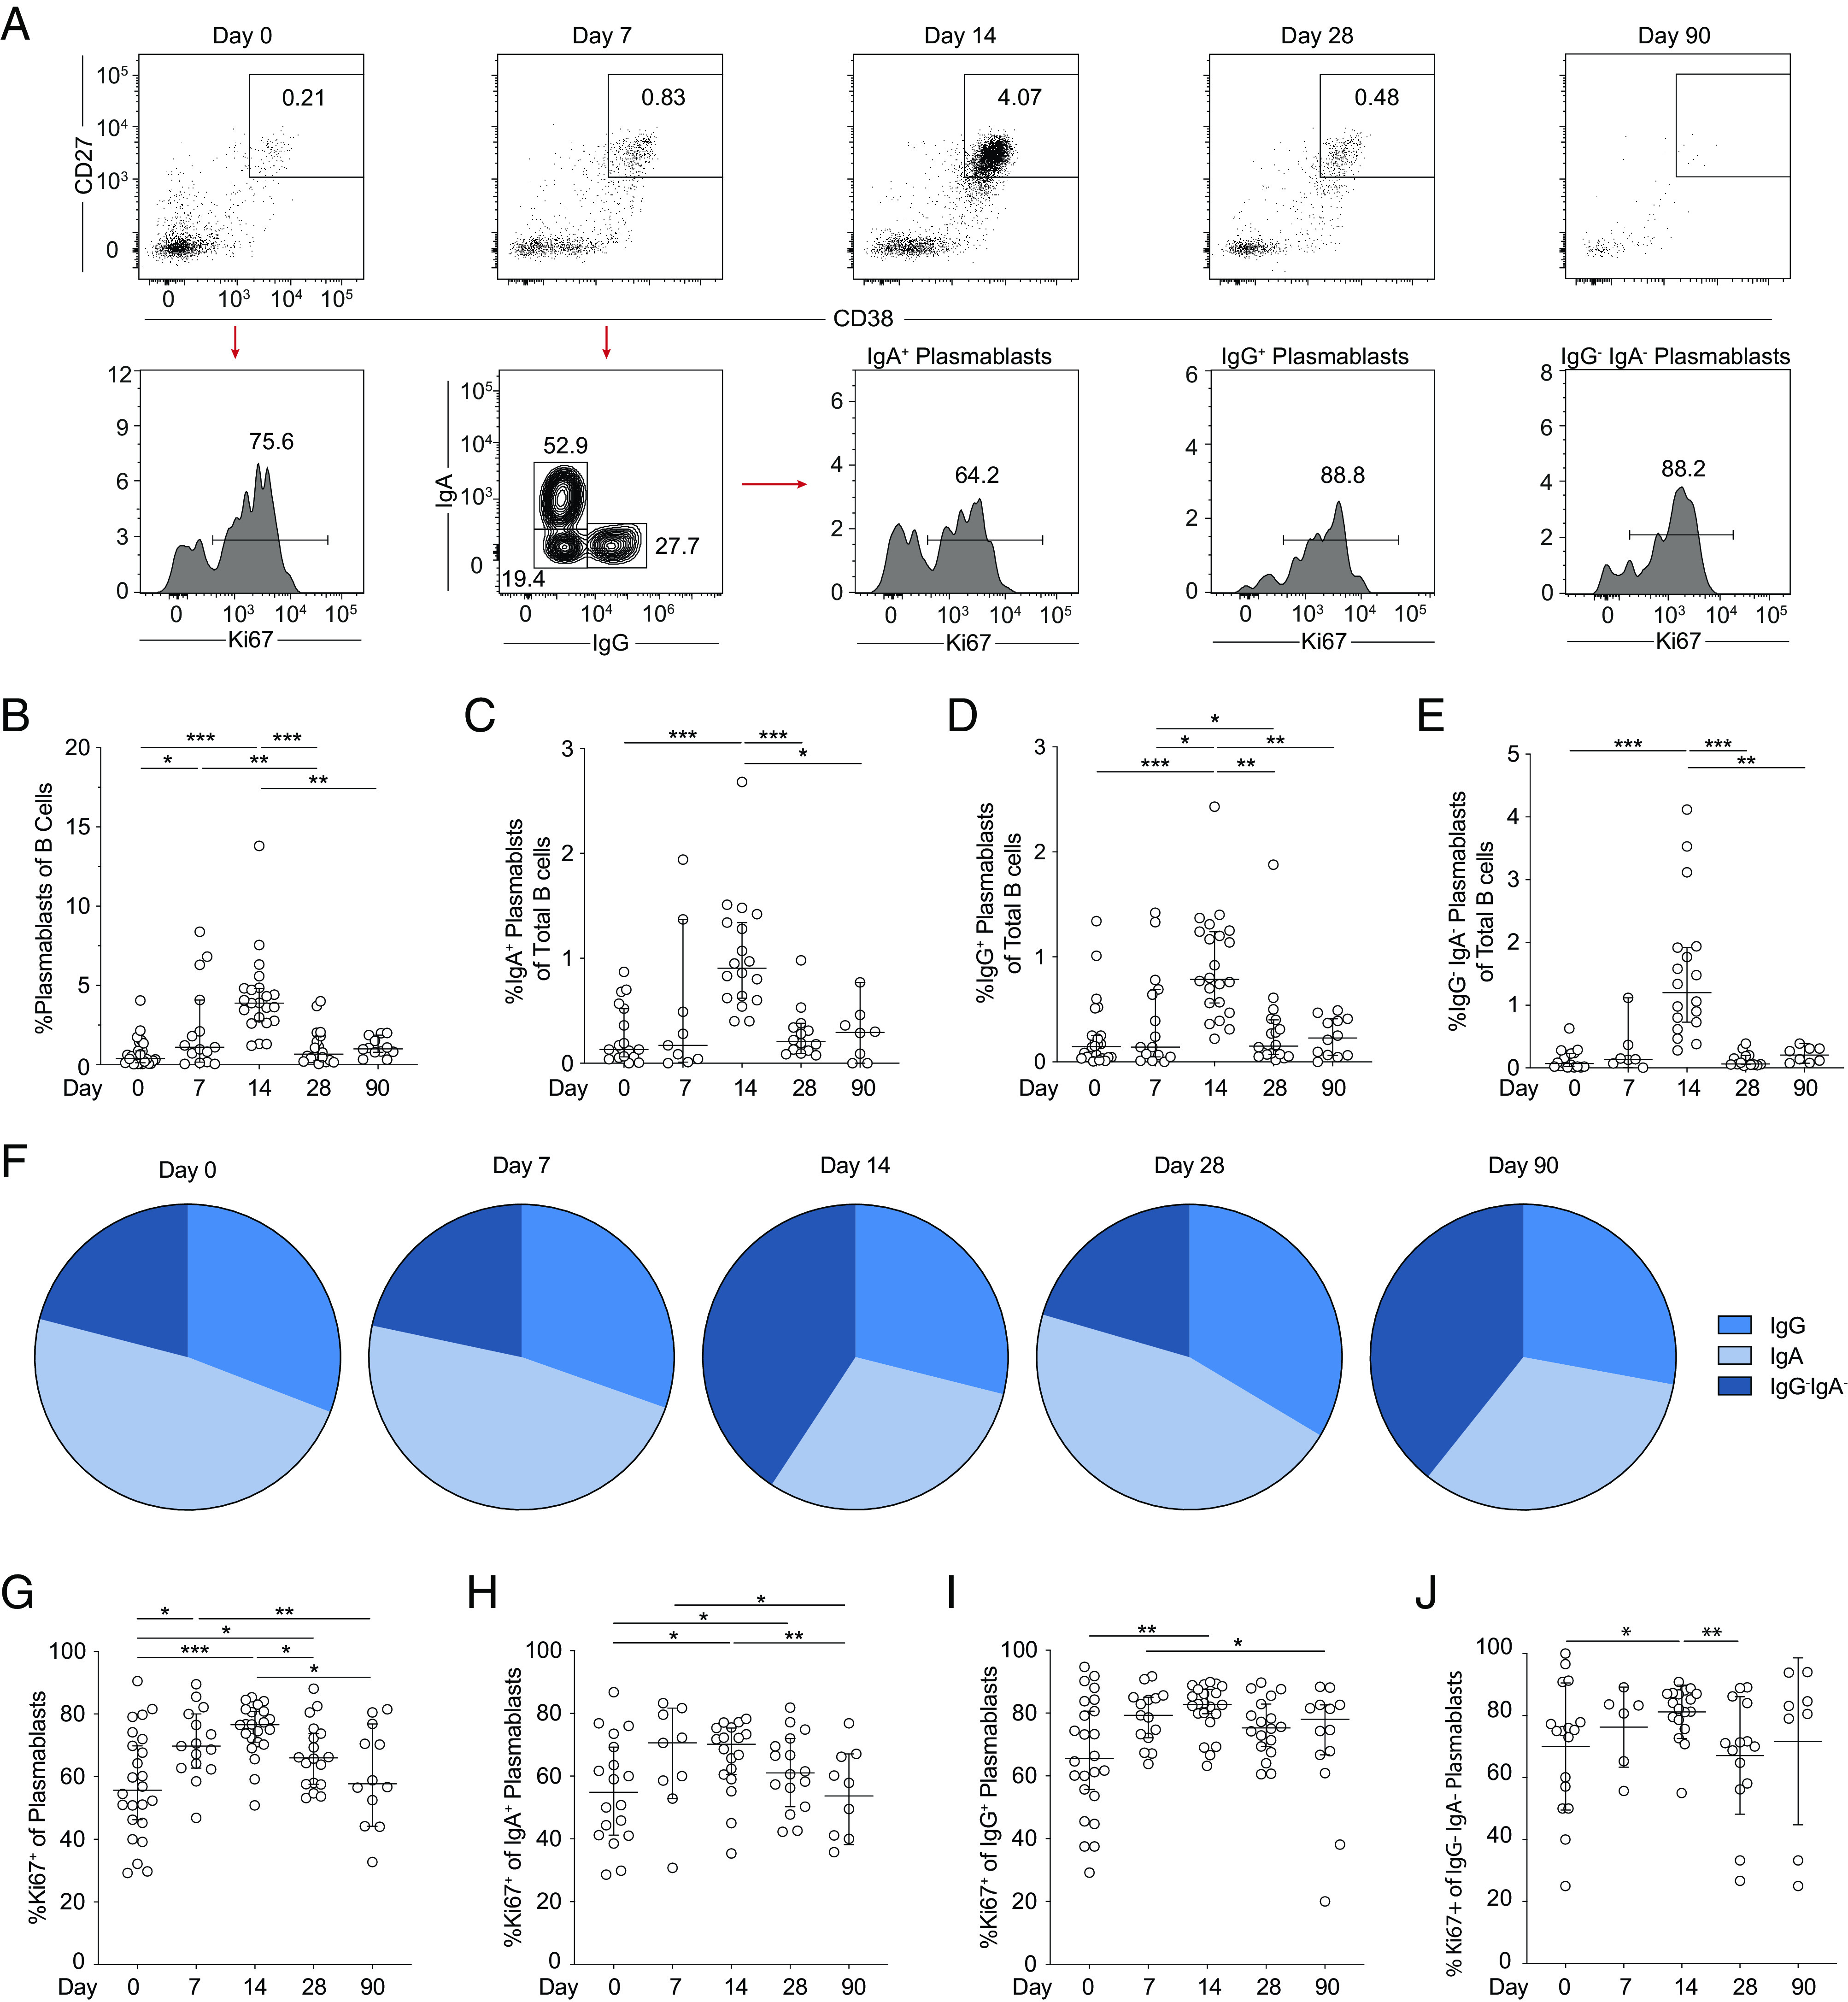
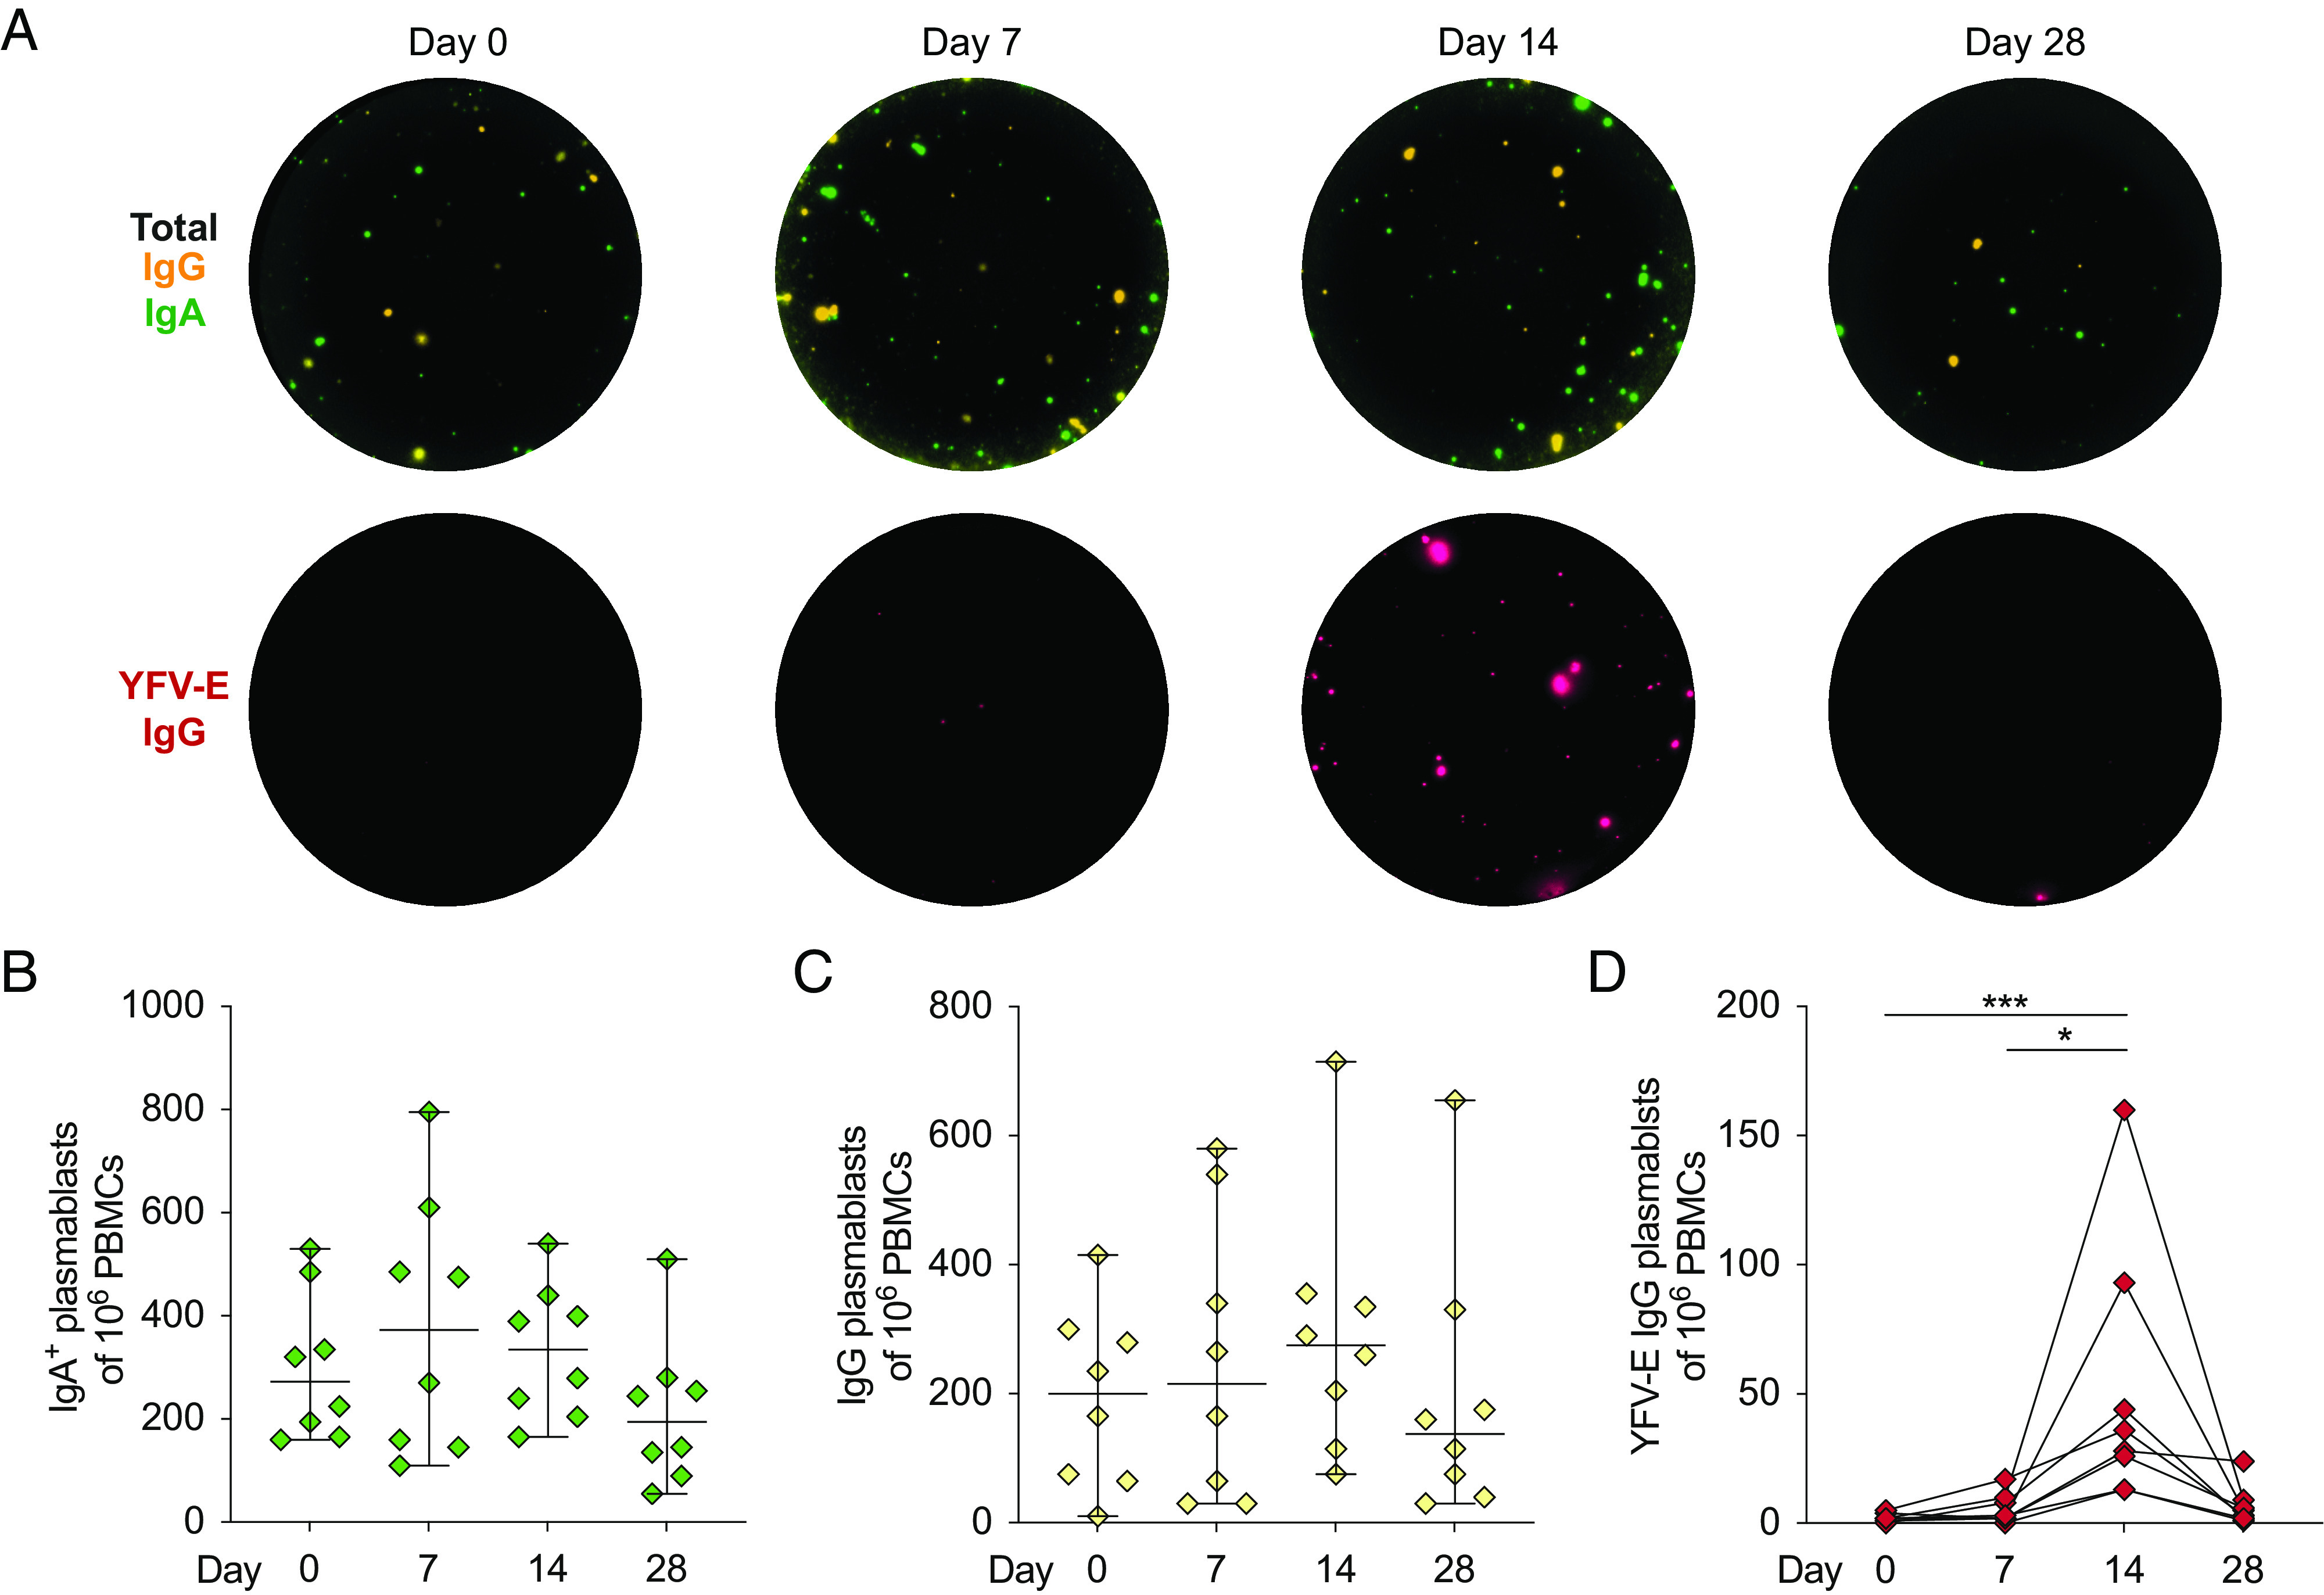
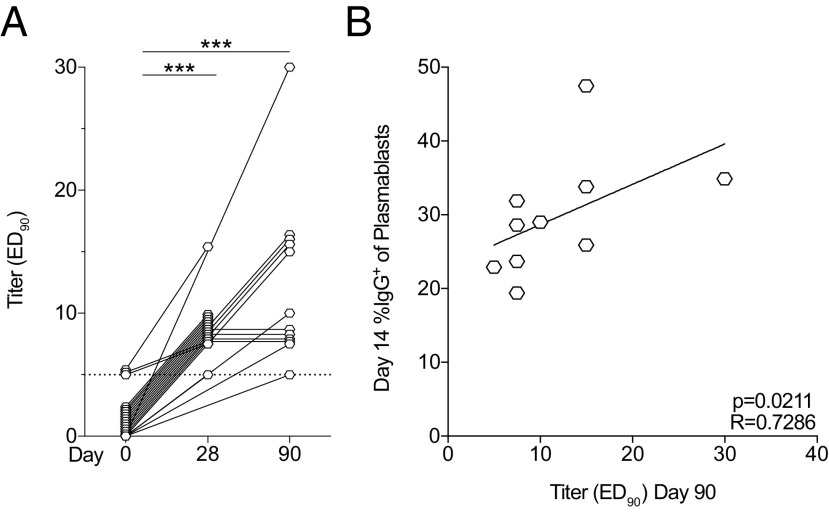
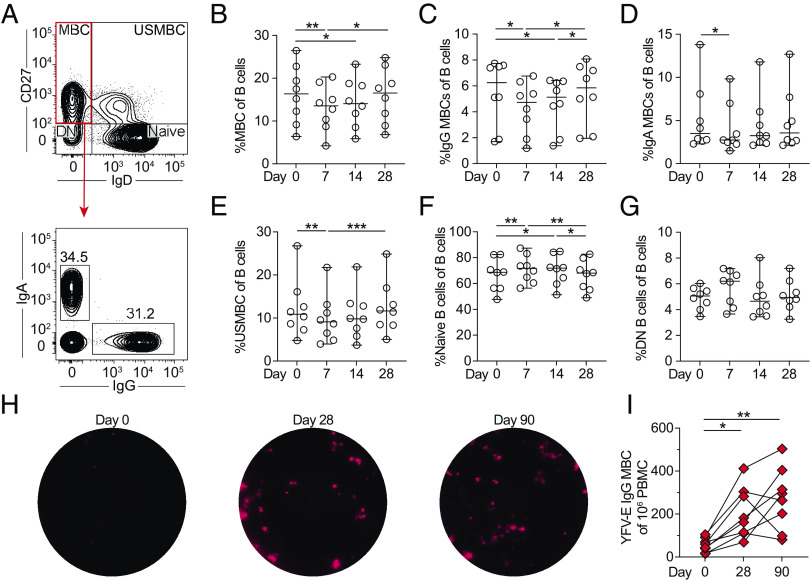
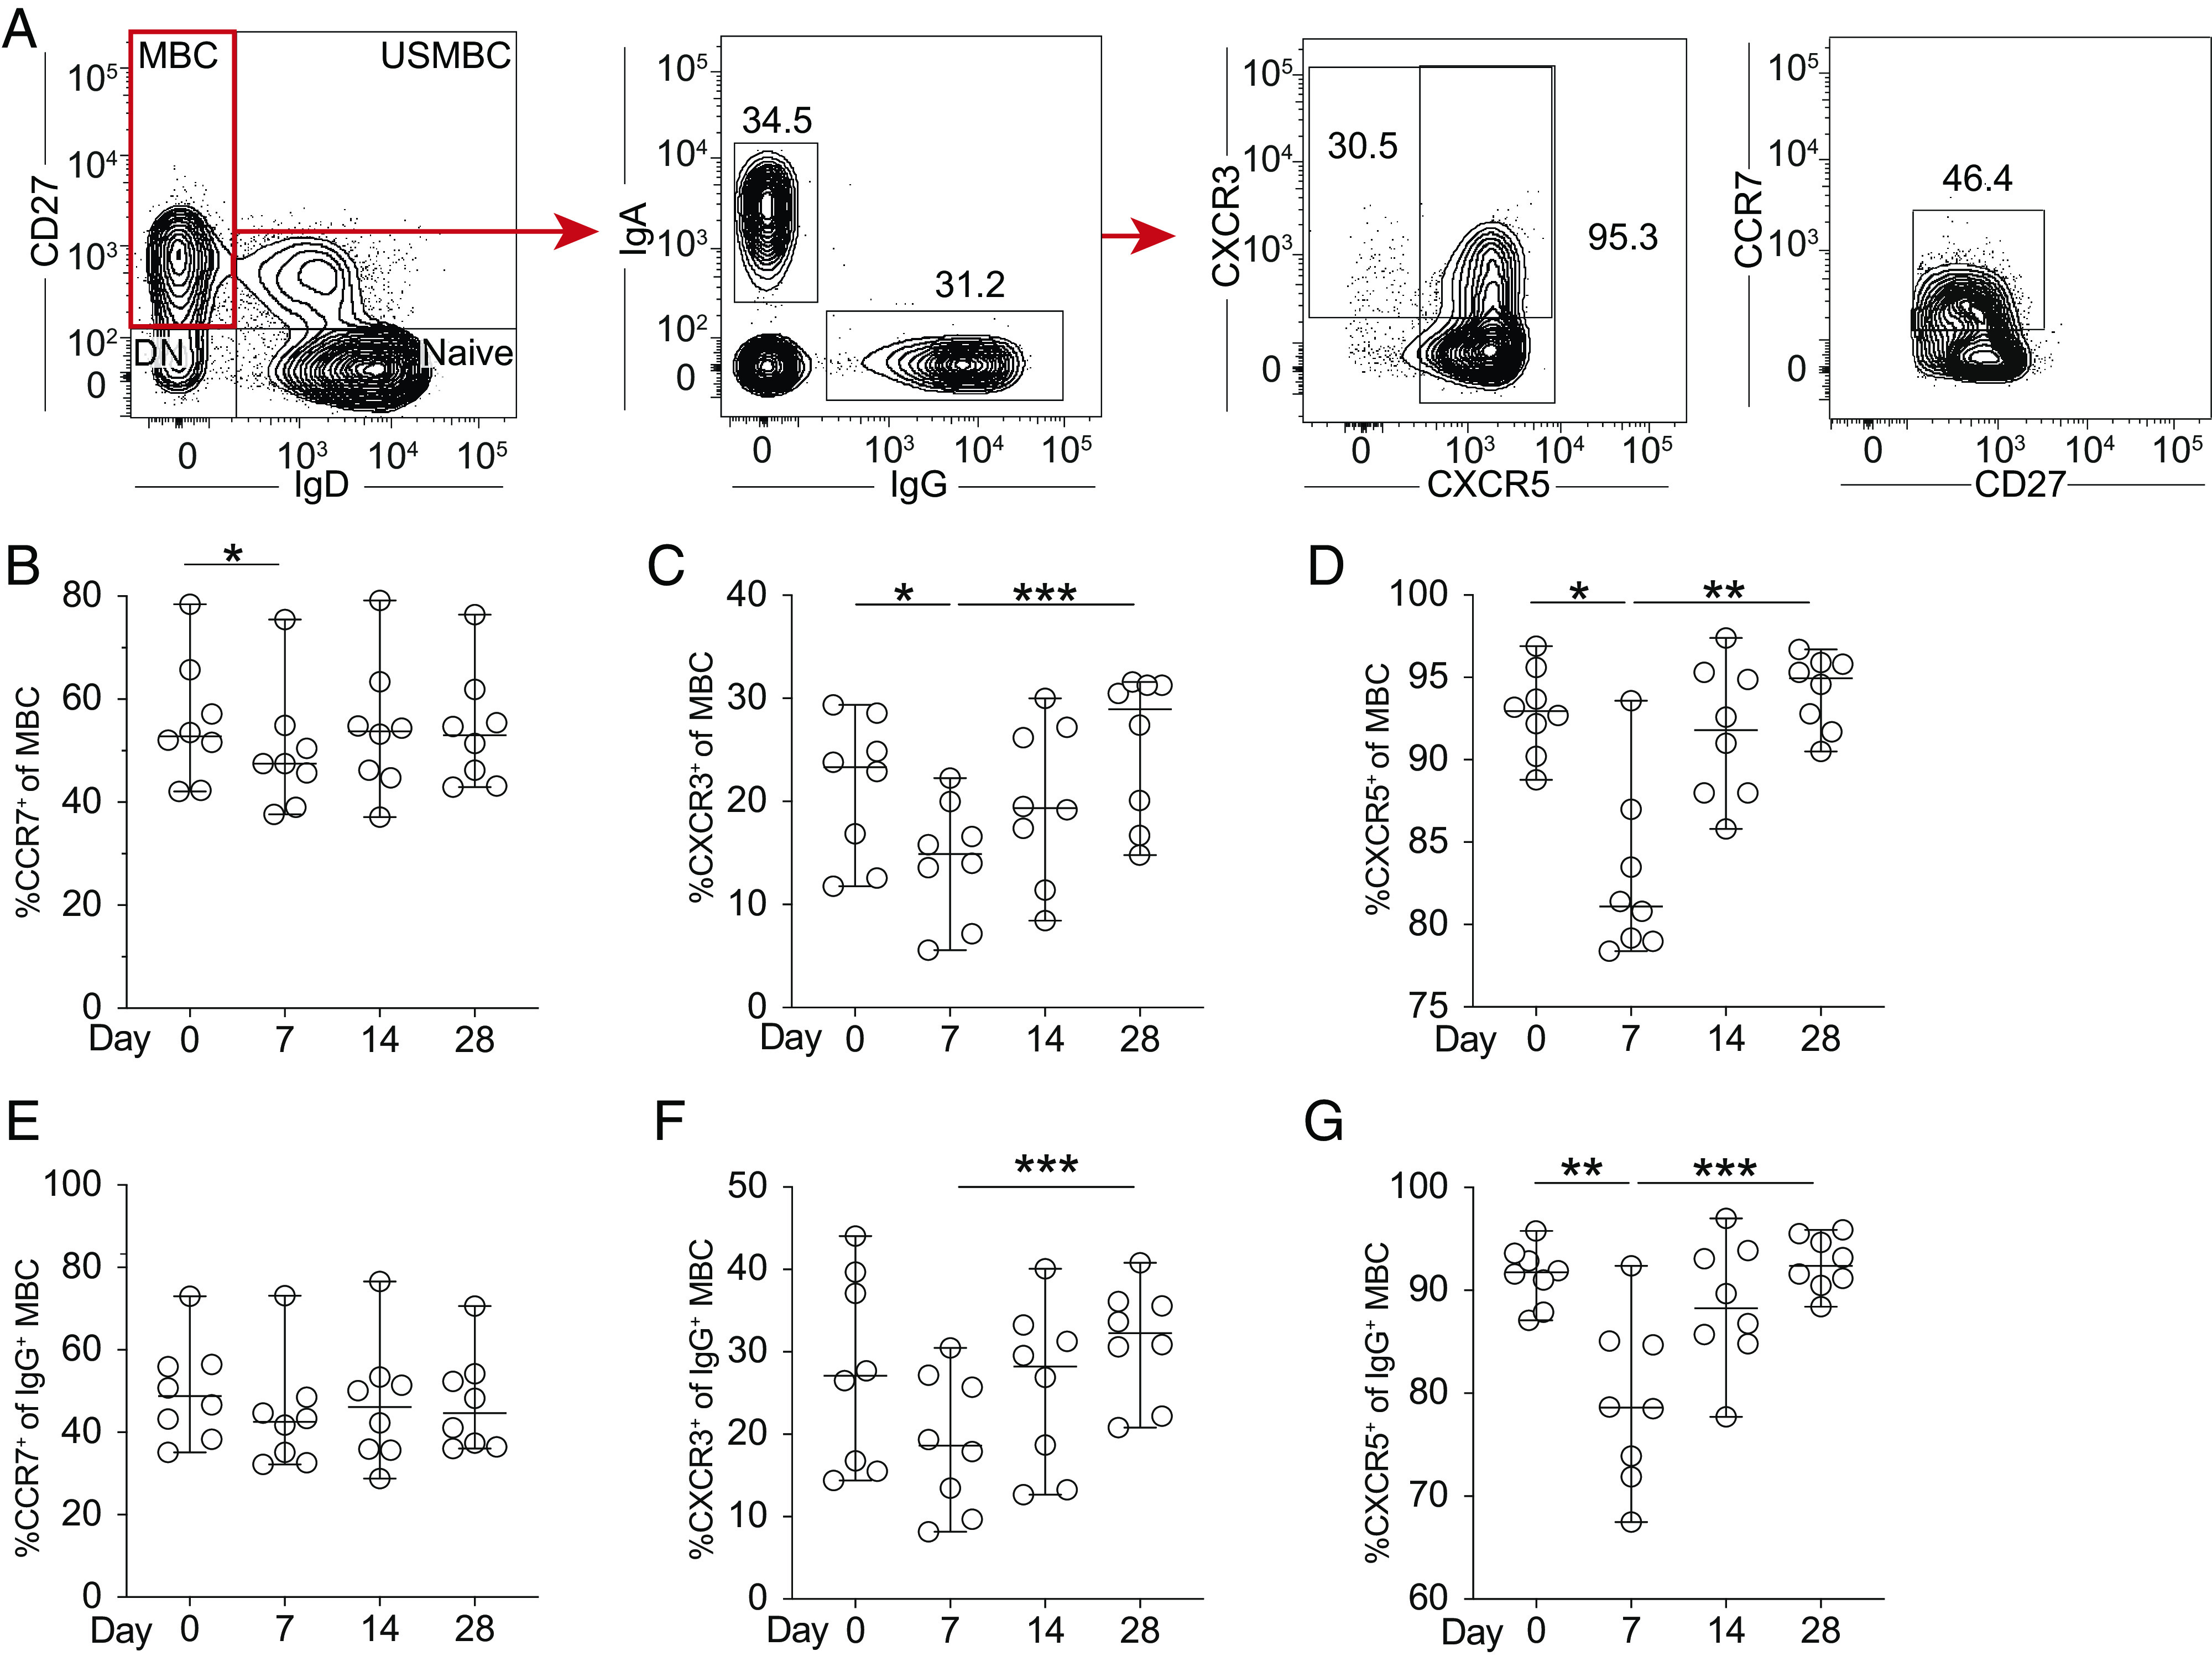
A single dose of the replication-competent, live-attenuated yellow fever virus (YFV) 17D vaccine provides lifelong immunity against human YFV infection. The magnitude, kinetics, and specificity of B cell responses to YFV 17D are relatively less understood than T cell responses. In this clinical study, we focused on early immune events critical for the development of humoral immunity to YFV 17D vaccination in 24 study subjects. More specifically, we studied the dynamics of several immune cell populations over time and the development of neutralizing Abs. At 7 d following vaccination, YFV RNA in serum as well as several antiviral proteins were detected as a sign of YFV 17D replication. Activation of Th1-polarized circulating T follicular helper cells followed germinal center activity, the latter assessed by the surrogate marker CXCL13 in serum. This coincided with a plasmablast expansion peaking at day 14 before returning to baseline levels at day 28. FluoroSpot-based analysis confirmed that plasmablasts were specific to the YFV-E protein. The frequencies of plasmablasts correlated with the magnitude of neutralizing Ab titers measured at day 90, suggesting that this transient B cell subset could be used as an early marker of induction of protective immunity. Additionally, YFV-specific memory B cells were readily detectable at 28 and 90 d following vaccination, and all study subjects tested developed protective neutralizing Ab titers. Taken together, these studies provide insights into key immune events leading to human B cell immunity following vaccination with the YFV 17D vaccine.
Copyright © 2021 by The American Association of Immunologists, Inc.
Conflict of interest statement
The authors have no financial conflicts of interest.
Figures
Similar articles
-
The early cellular signatures of protective immunity induced by live viral vaccination.Eur J Immunol. 2012 Sep;42(9):2363-73. doi: 10.1002/eji.201142306. Epub 2012 Aug 6. Eur J Immunol. 2012. PMID: 22733156
-
Yellow fever vaccination elicits broad functional CD4+ T cell responses that recognize structural and nonstructural proteins.J Virol. 2013 Dec;87(23):12794-804. doi: 10.1128/JVI.01160-13. Epub 2013 Sep 18. J Virol. 2013. PMID: 24049183 Free PMC article.
-
Molecular and immunological characterization of a DNA-launched yellow fever virus 17D infectious clone.J Gen Virol. 2015 Apr;96(Pt 4):804-814. doi: 10.1099/jgv.0.000026. Epub 2014 Dec 16. J Gen Virol. 2015. PMID: 25516543 Free PMC article.
-
T Cell-Mediated Immunity towards Yellow Fever Virus and Useful Animal Models.Viruses. 2017 Apr 11;9(4):77. doi: 10.3390/v9040077. Viruses. 2017. PMID: 28398253 Free PMC article. Review.
-
Understanding the role of innate immunity in the mechanism of action of the live attenuated Yellow Fever Vaccine 17D.Adv Exp Med Biol. 2007;590:43-53. doi: 10.1007/978-0-387-34814-8_3. Adv Exp Med Biol. 2007. PMID: 17191376 Review. No abstract available.
Cited by
-
Prior vaccination promotes early activation of memory T cells and enhances immune responses during SARS-CoV-2 breakthrough infection.Nat Immunol. 2023 Oct;24(10):1711-1724. doi: 10.1038/s41590-023-01613-y. Epub 2023 Sep 21. Nat Immunol. 2023. PMID: 37735592
-
Profile of the B cell receptor repertoire and antibody responses upon 17DD-YF vaccine boosting.bioRxiv [Preprint]. 2025 Jul 1:2025.06.24.660700. doi: 10.1101/2025.06.24.660700. bioRxiv. 2025. PMID: 40631227 Free PMC article. Preprint.
-
Type I Interferon Autoantibodies Correlate With Cellular Immune Alterations in Severe COVID-19.J Infect Dis. 2024 Aug 16;230(2):e318-e326. doi: 10.1093/infdis/jiae036. J Infect Dis. 2024. PMID: 38421006 Free PMC article.
-
Generation of antigen-specific memory CD4 T cells by heterologous immunization enhances the magnitude of the germinal center response upon influenza infection.PLoS Pathog. 2024 Sep 16;20(9):e1011639. doi: 10.1371/journal.ppat.1011639. eCollection 2024 Sep. PLoS Pathog. 2024. PMID: 39283916 Free PMC article.
-
Plasmablast Expansion Following the Tetravalent, Live-Attenuated Dengue Vaccine Butantan-DV in DENV-Naïve and DENV-Exposed Individuals in a Brazilian Cohort.Front Immunol. 2022 Jun 28;13:908398. doi: 10.3389/fimmu.2022.908398. eCollection 2022. Front Immunol. 2022. PMID: 35837409 Free PMC article.
References
-
- Giovanetti M., de Mendonça M. C. L., Fonseca V., Mares-Guia M. A., Fabri A., Xavier J., de Jesus J. G., Gräf T., Dos Santos Rodrigues C. D., Dos Santos C. C., et al. 2019. Yellow fever virus reemergence and spread in Southeast Brazil, 2016-2019. [Published erratum appears in 2020 J. Virol. 94: e02008-19.] J. Virol. 94: e01623-19. - PMC - PubMed
-
- Monath T. P., Gershman M., Erin Staples J., Barrett A. D. T.. 2012. Yellow fever vaccine. In Vaccines, 6th Ed. Plotkin S., Orenstein W., Offit P.. Elsevier, Philadelphia, PA, p. 870–968.
-
- Blom K., Braun M., Ivarsson M. A., Gonzalez V. D., Falconer K., Moll M., Ljunggren H.-G., Michaëlsson J., Sandberg J. K.. 2013. Temporal dynamics of the primary human T cell response to yellow fever virus 17D as it matures from an effector- to a memory-type response. J. Immunol. 190: 2150–2158. - PubMed
Publication types
MeSH terms
Substances
LinkOut - more resources
Full Text Sources
