. 2021 Jul 28;13(604):eaax8891.
doi: 10.1126/scitranslmed.aax8891.

PARIS farnesylation prevents neurodegeneration in models of Parkinson's disease

Affiliations

PARIS farnesylation prevents neurodegeneration in models of Parkinson's disease

Areum Jo et al. Sci Transl Med. .

Abstract

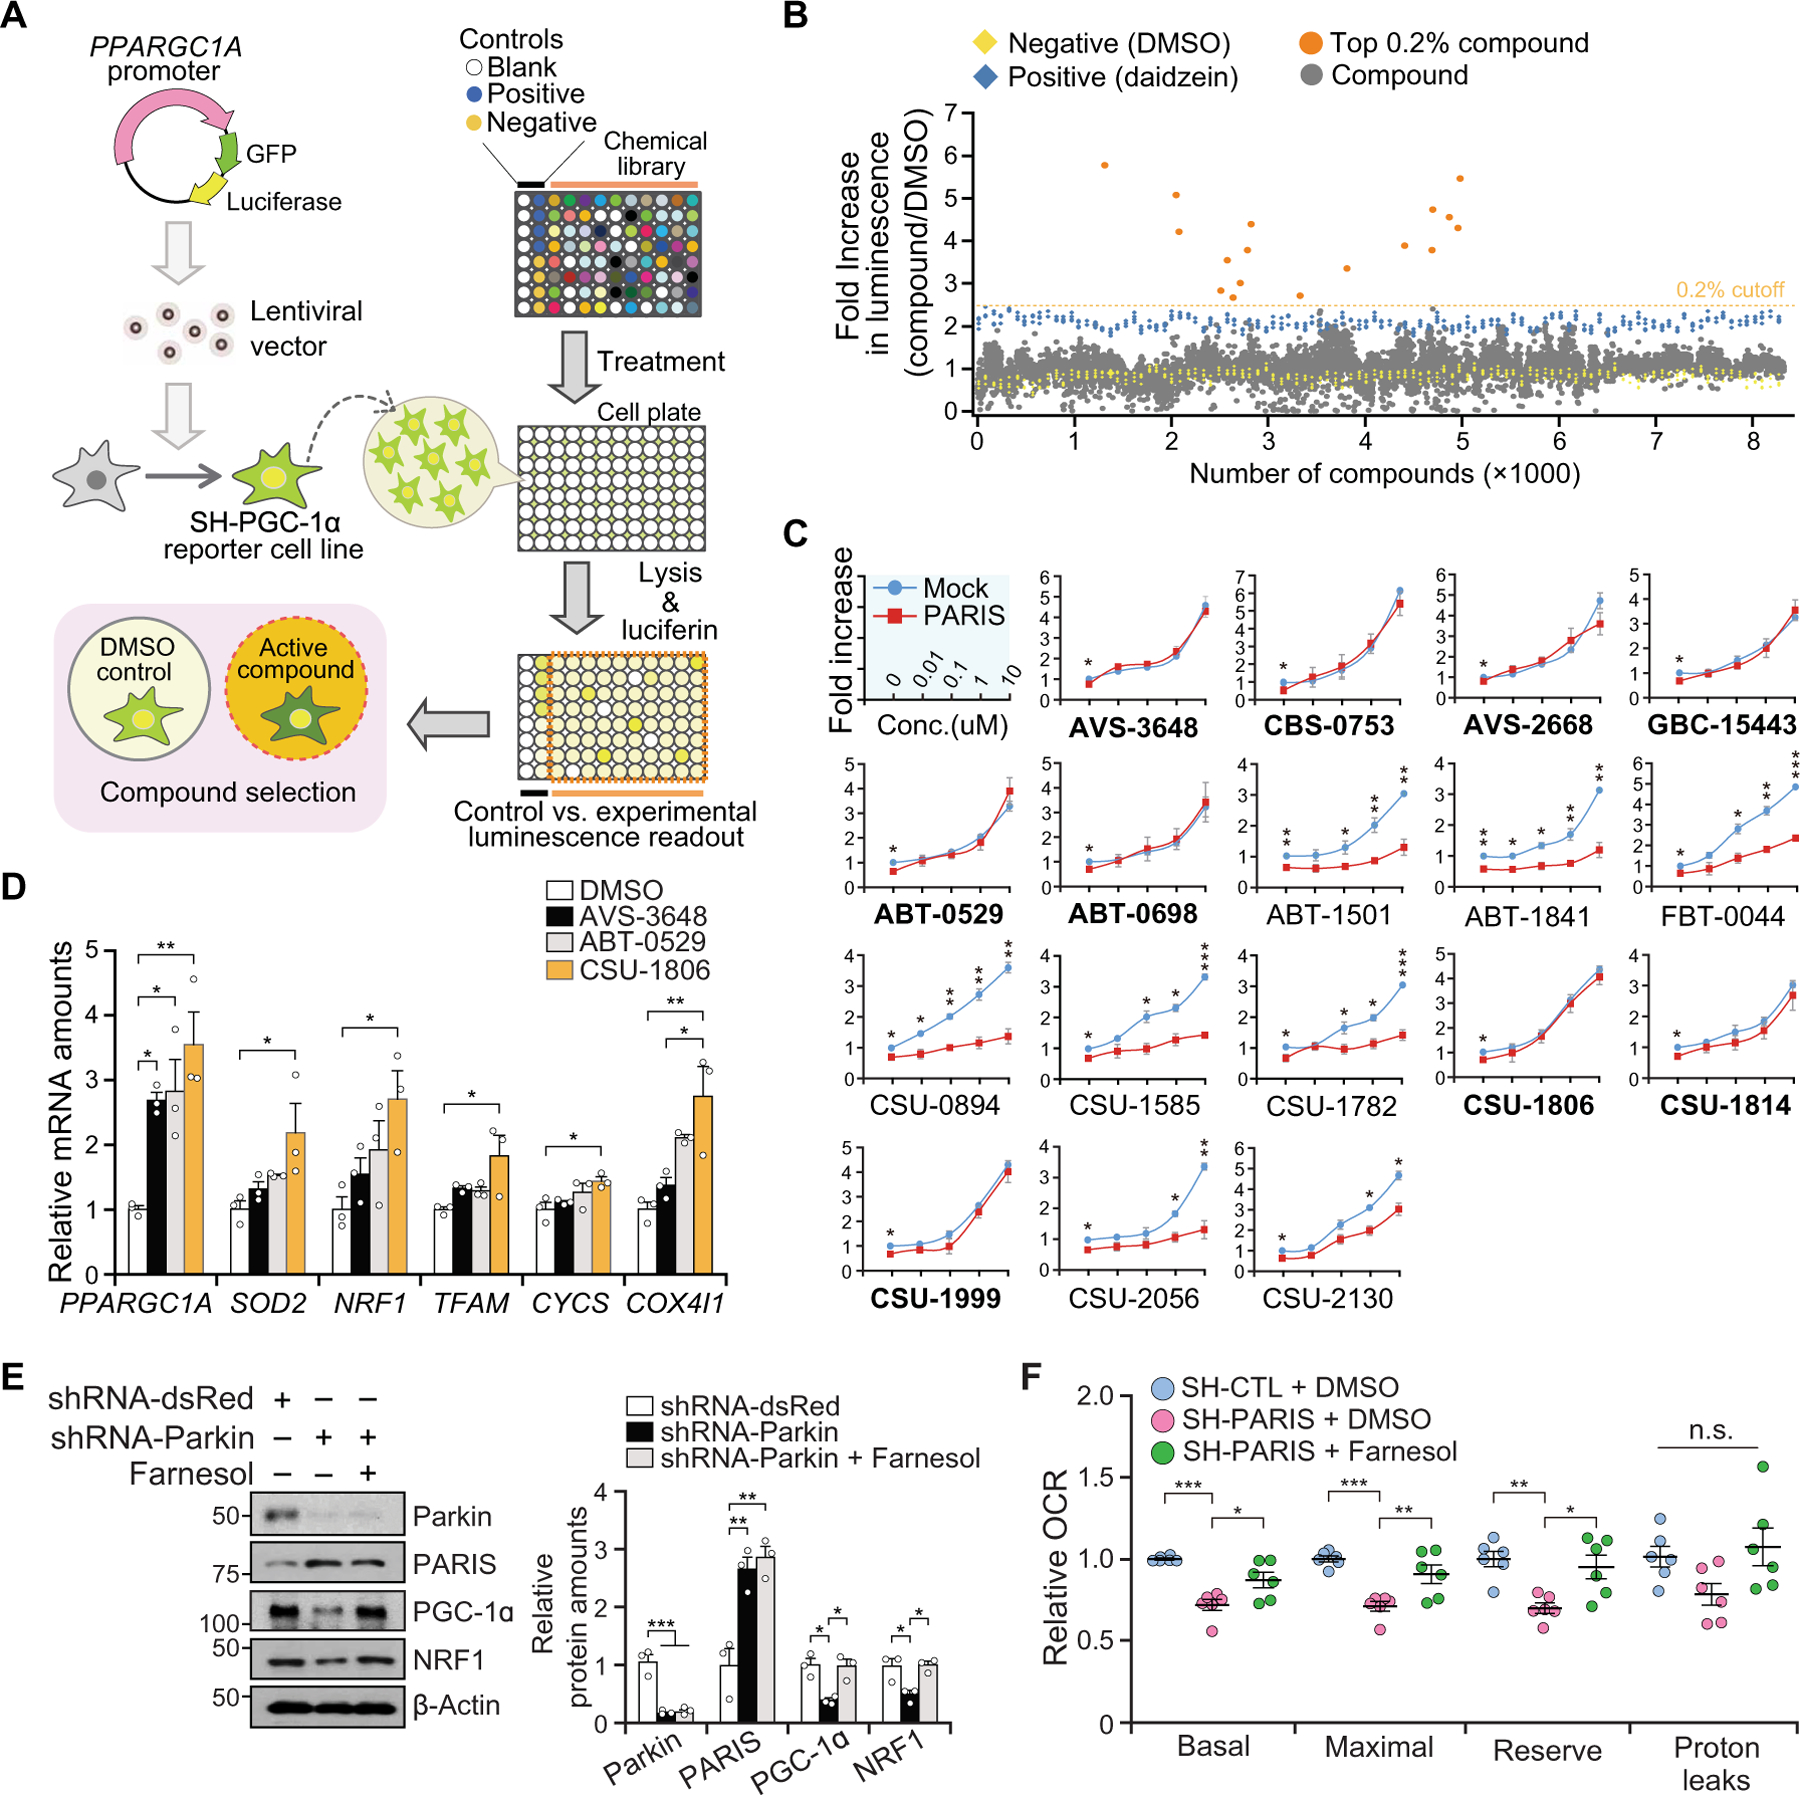
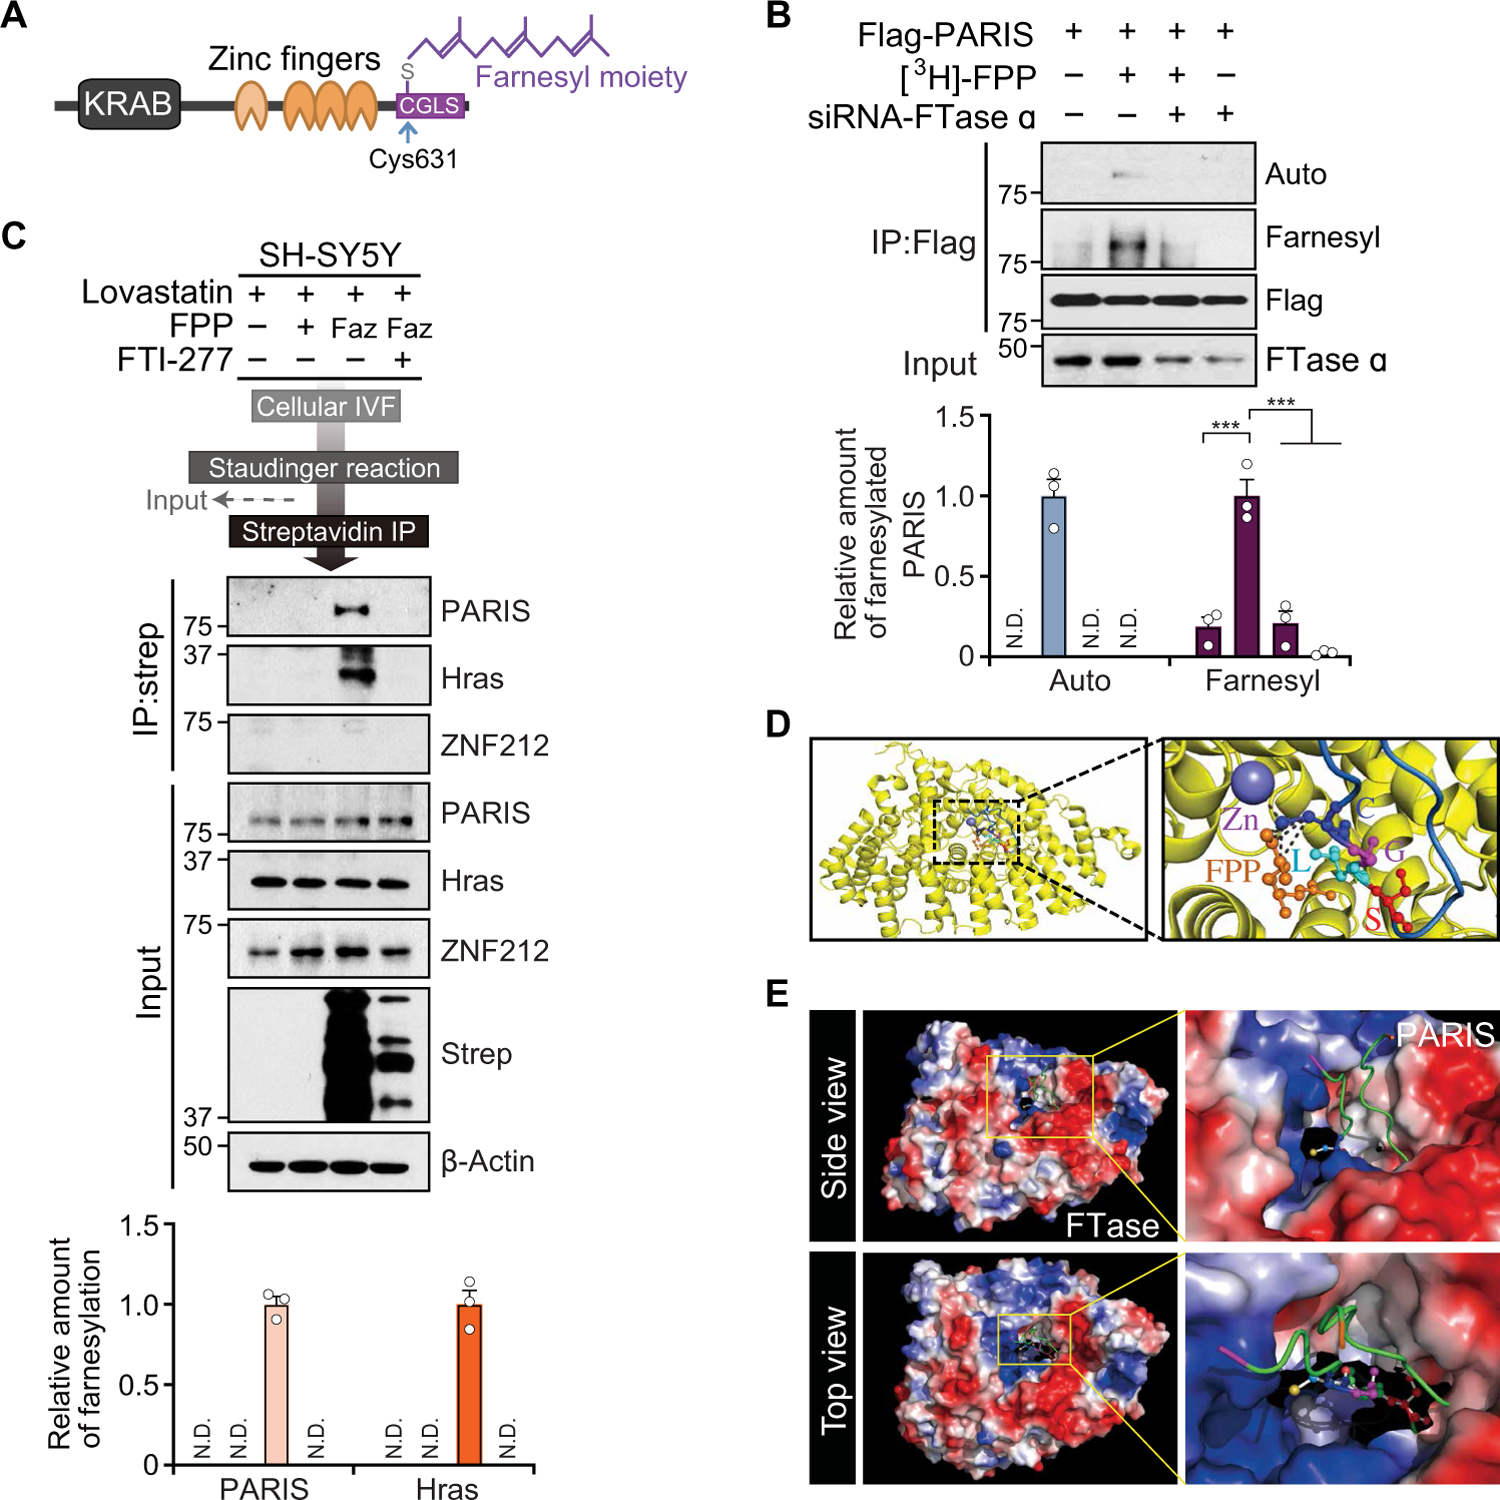
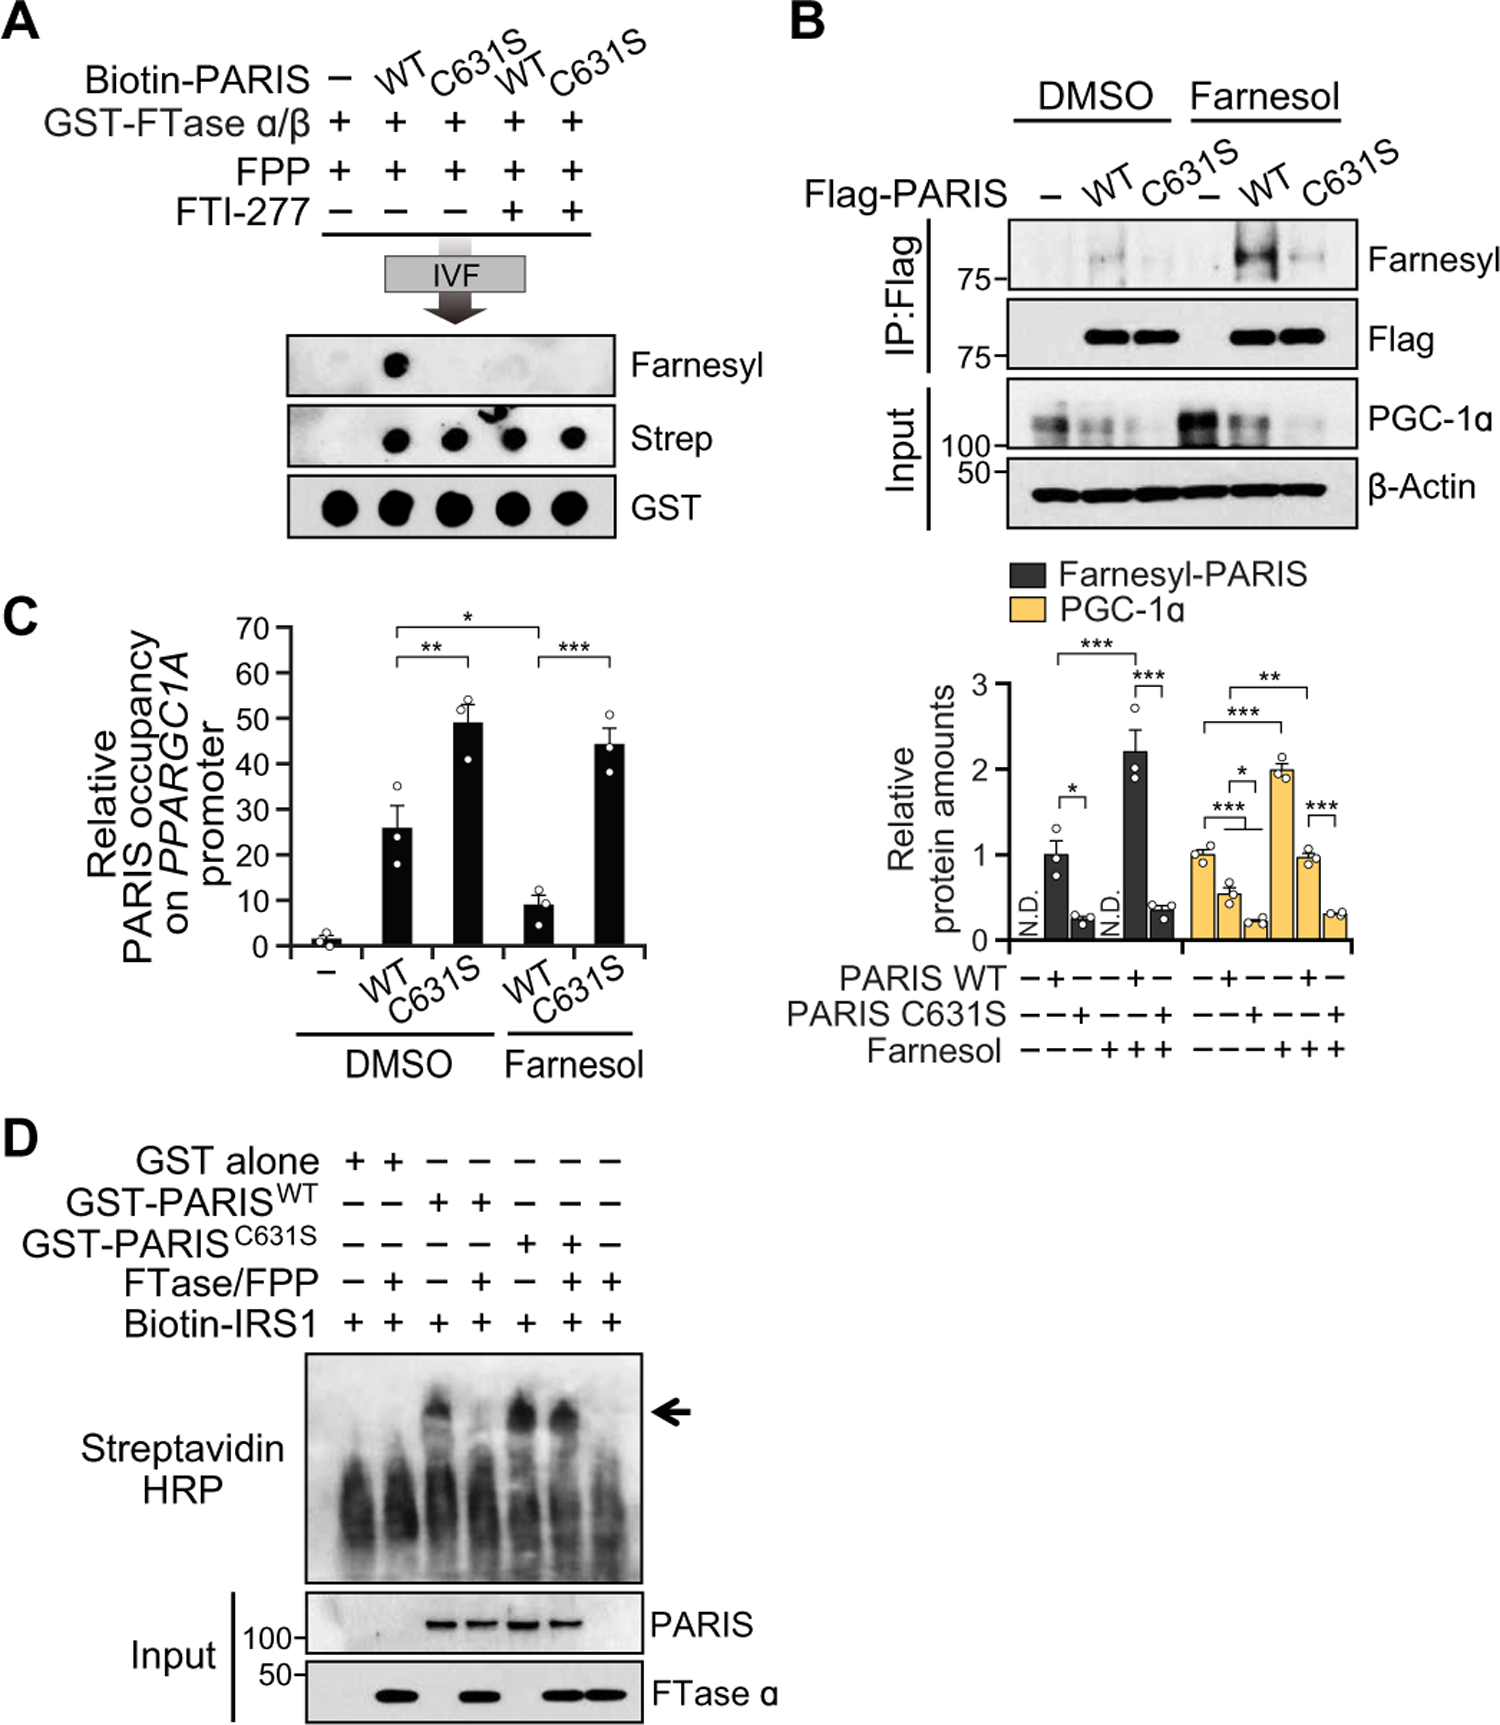
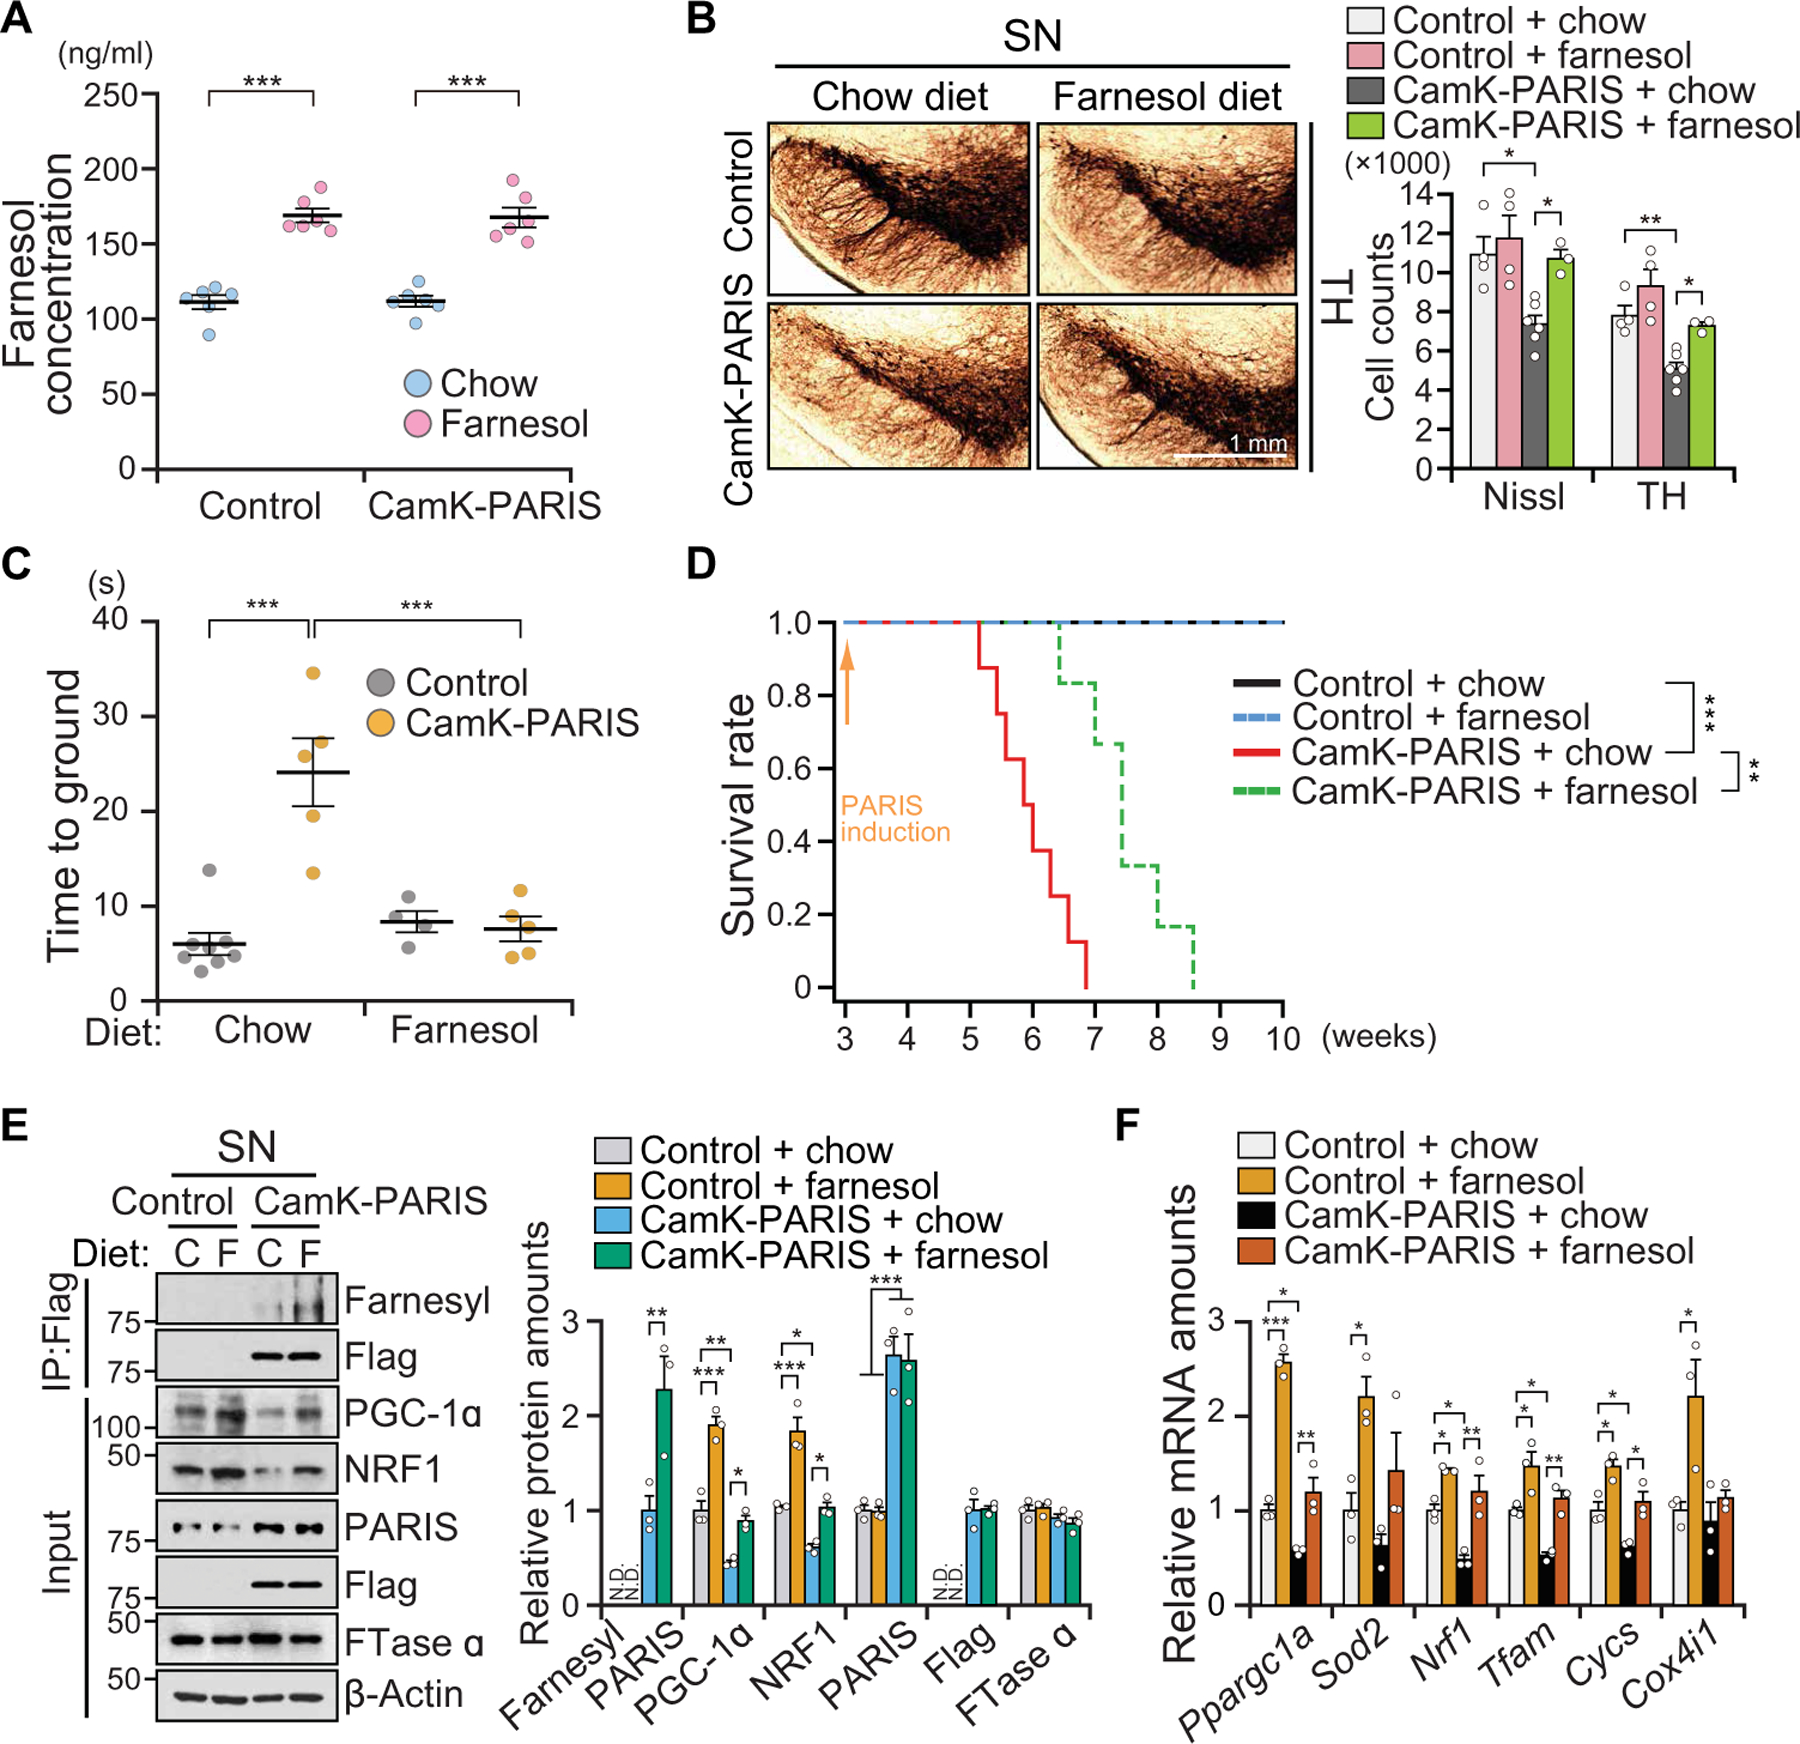
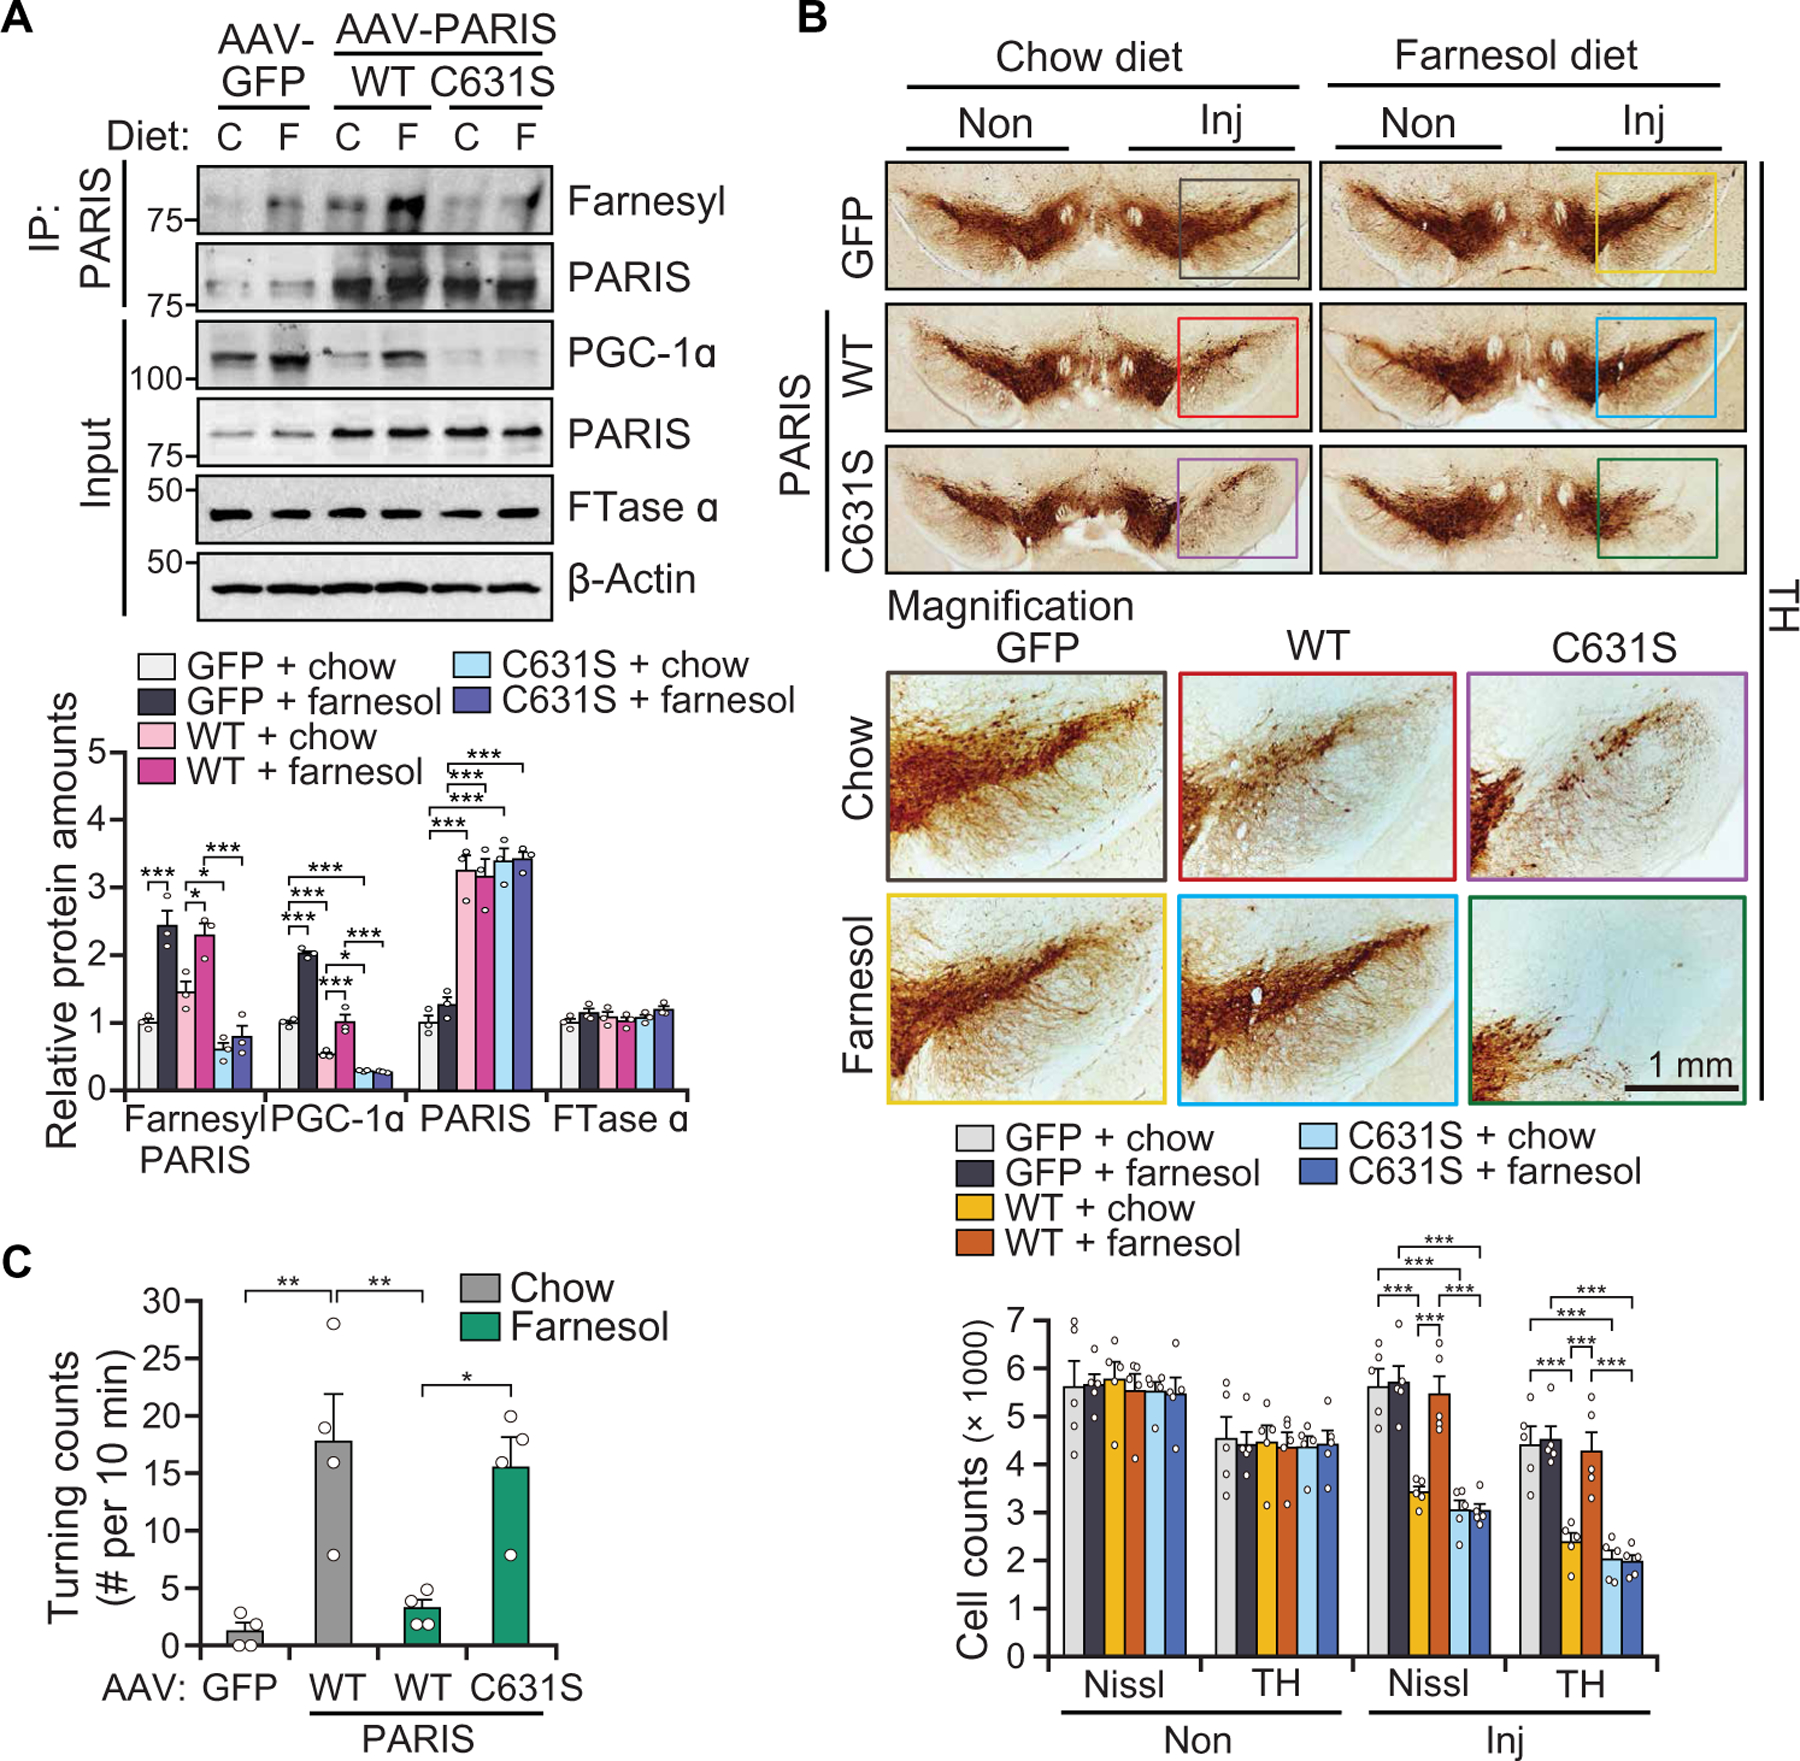
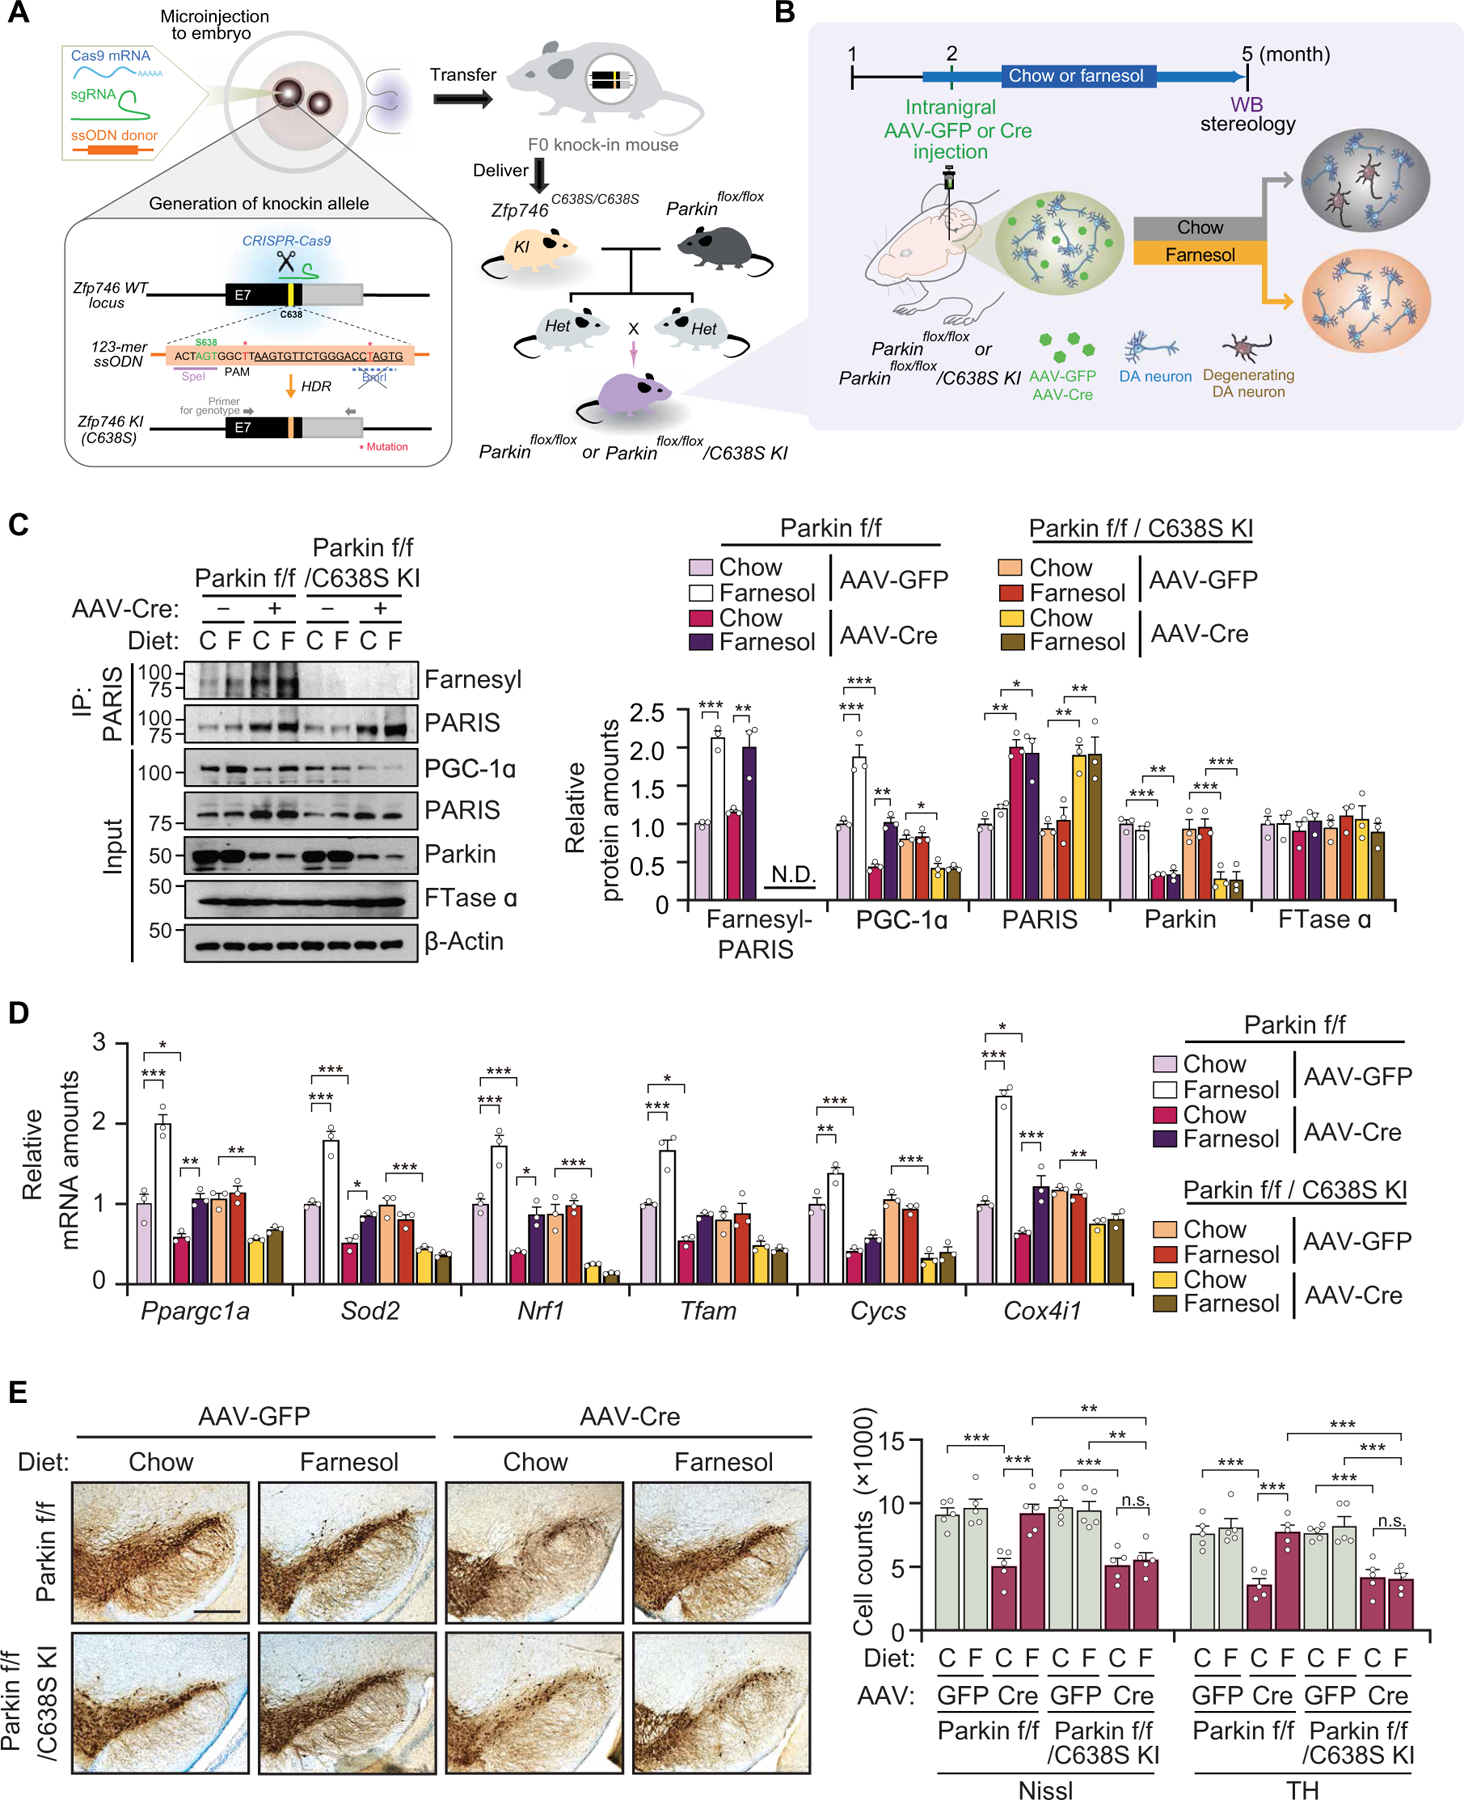
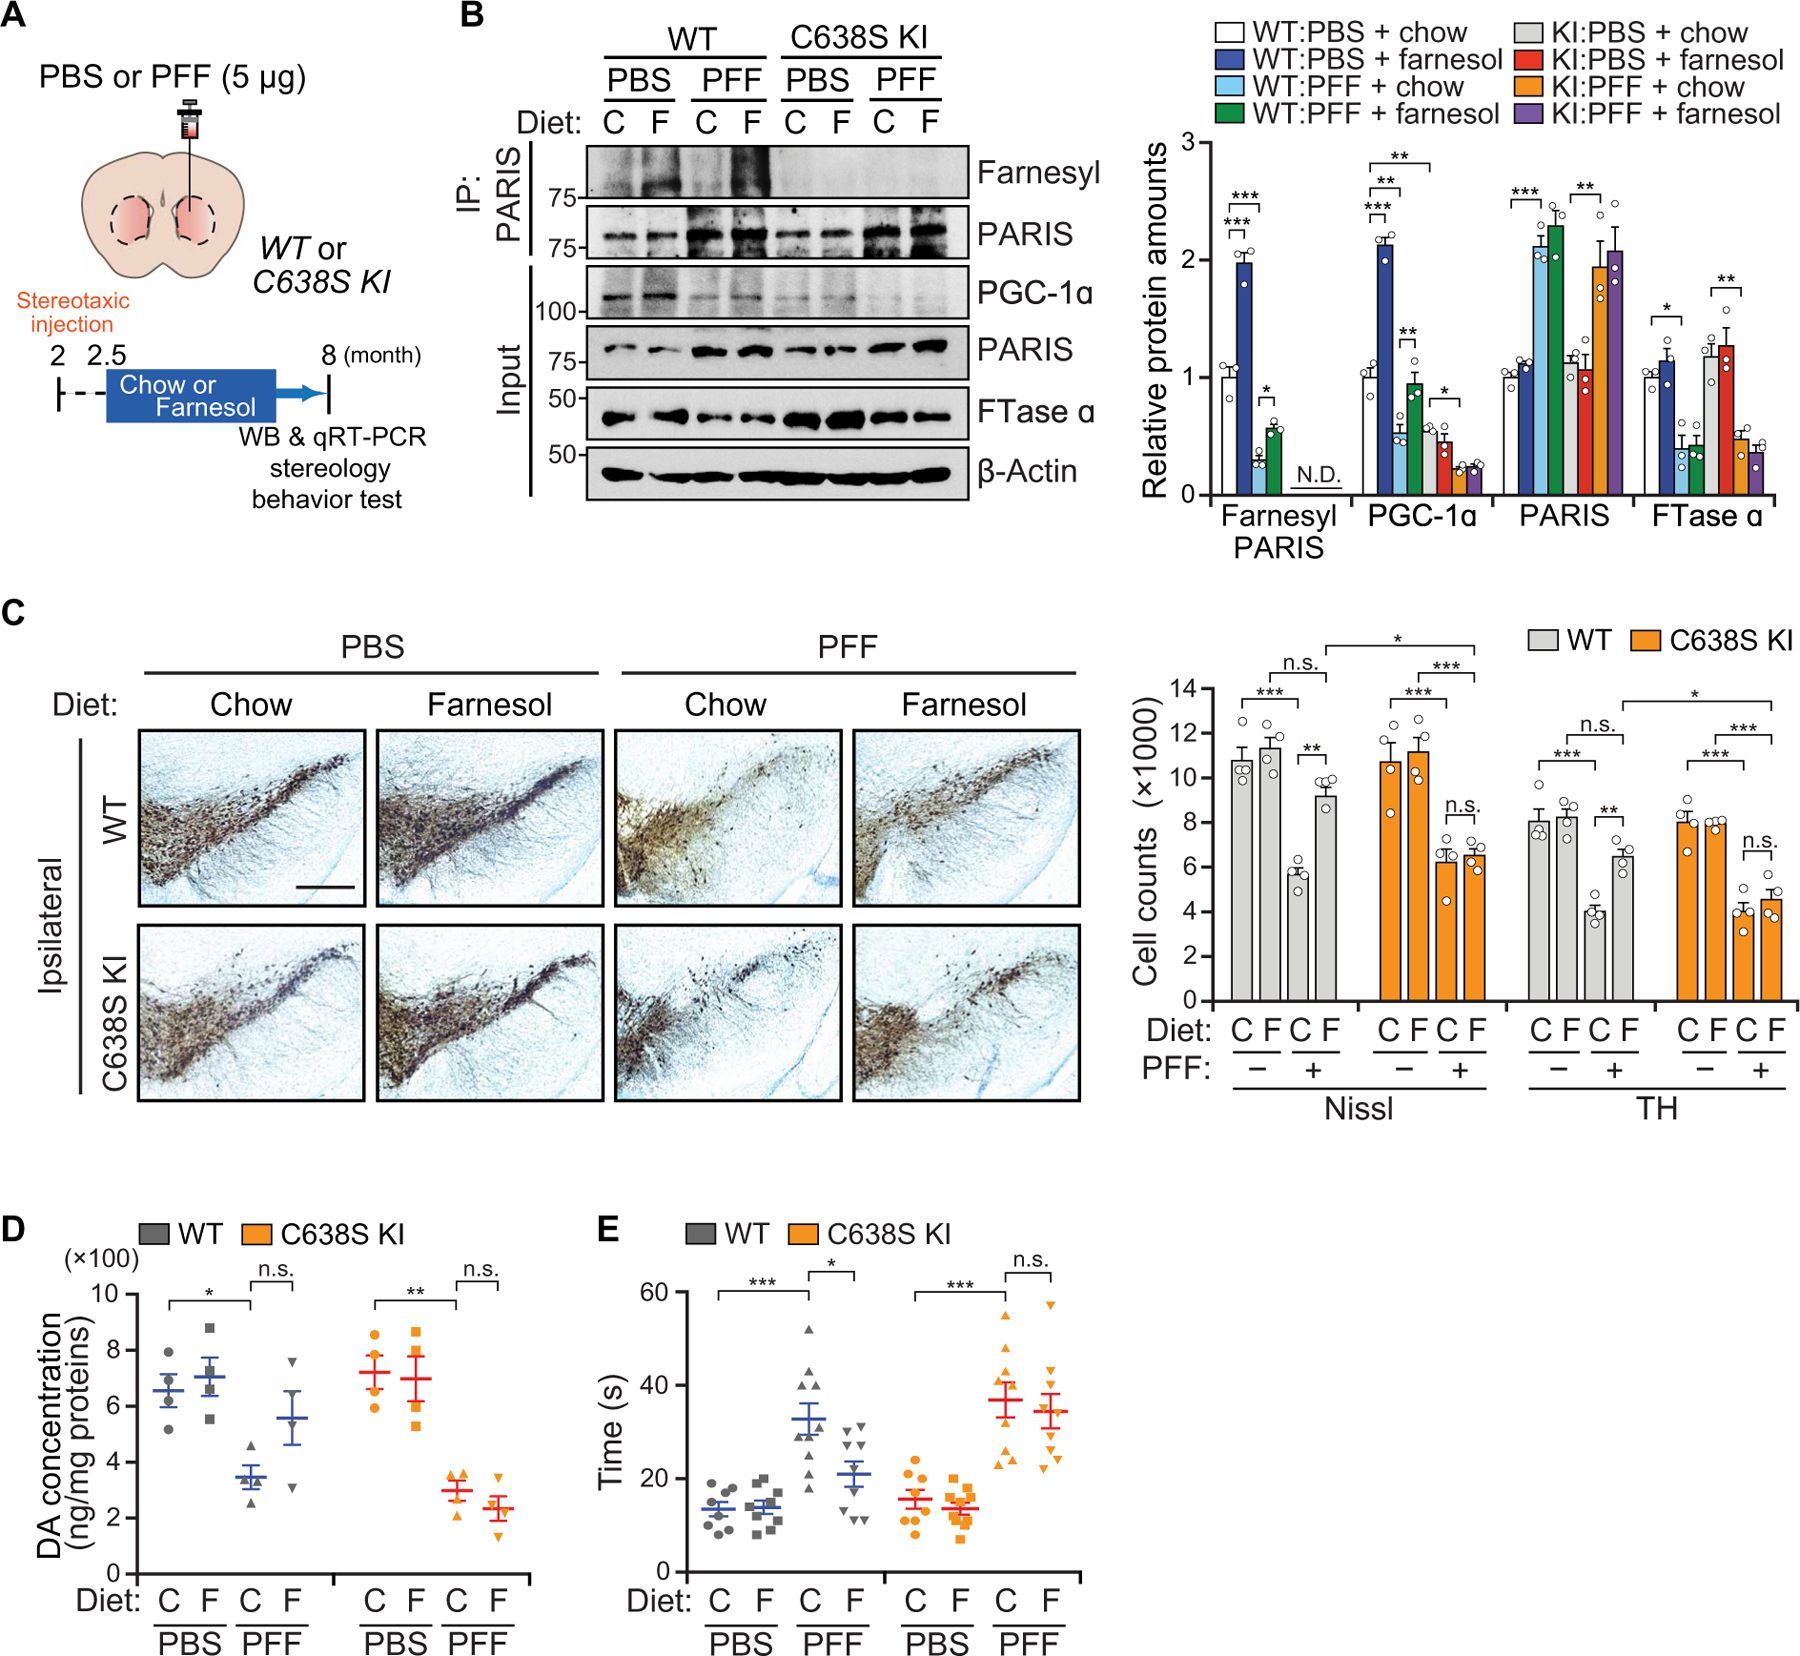
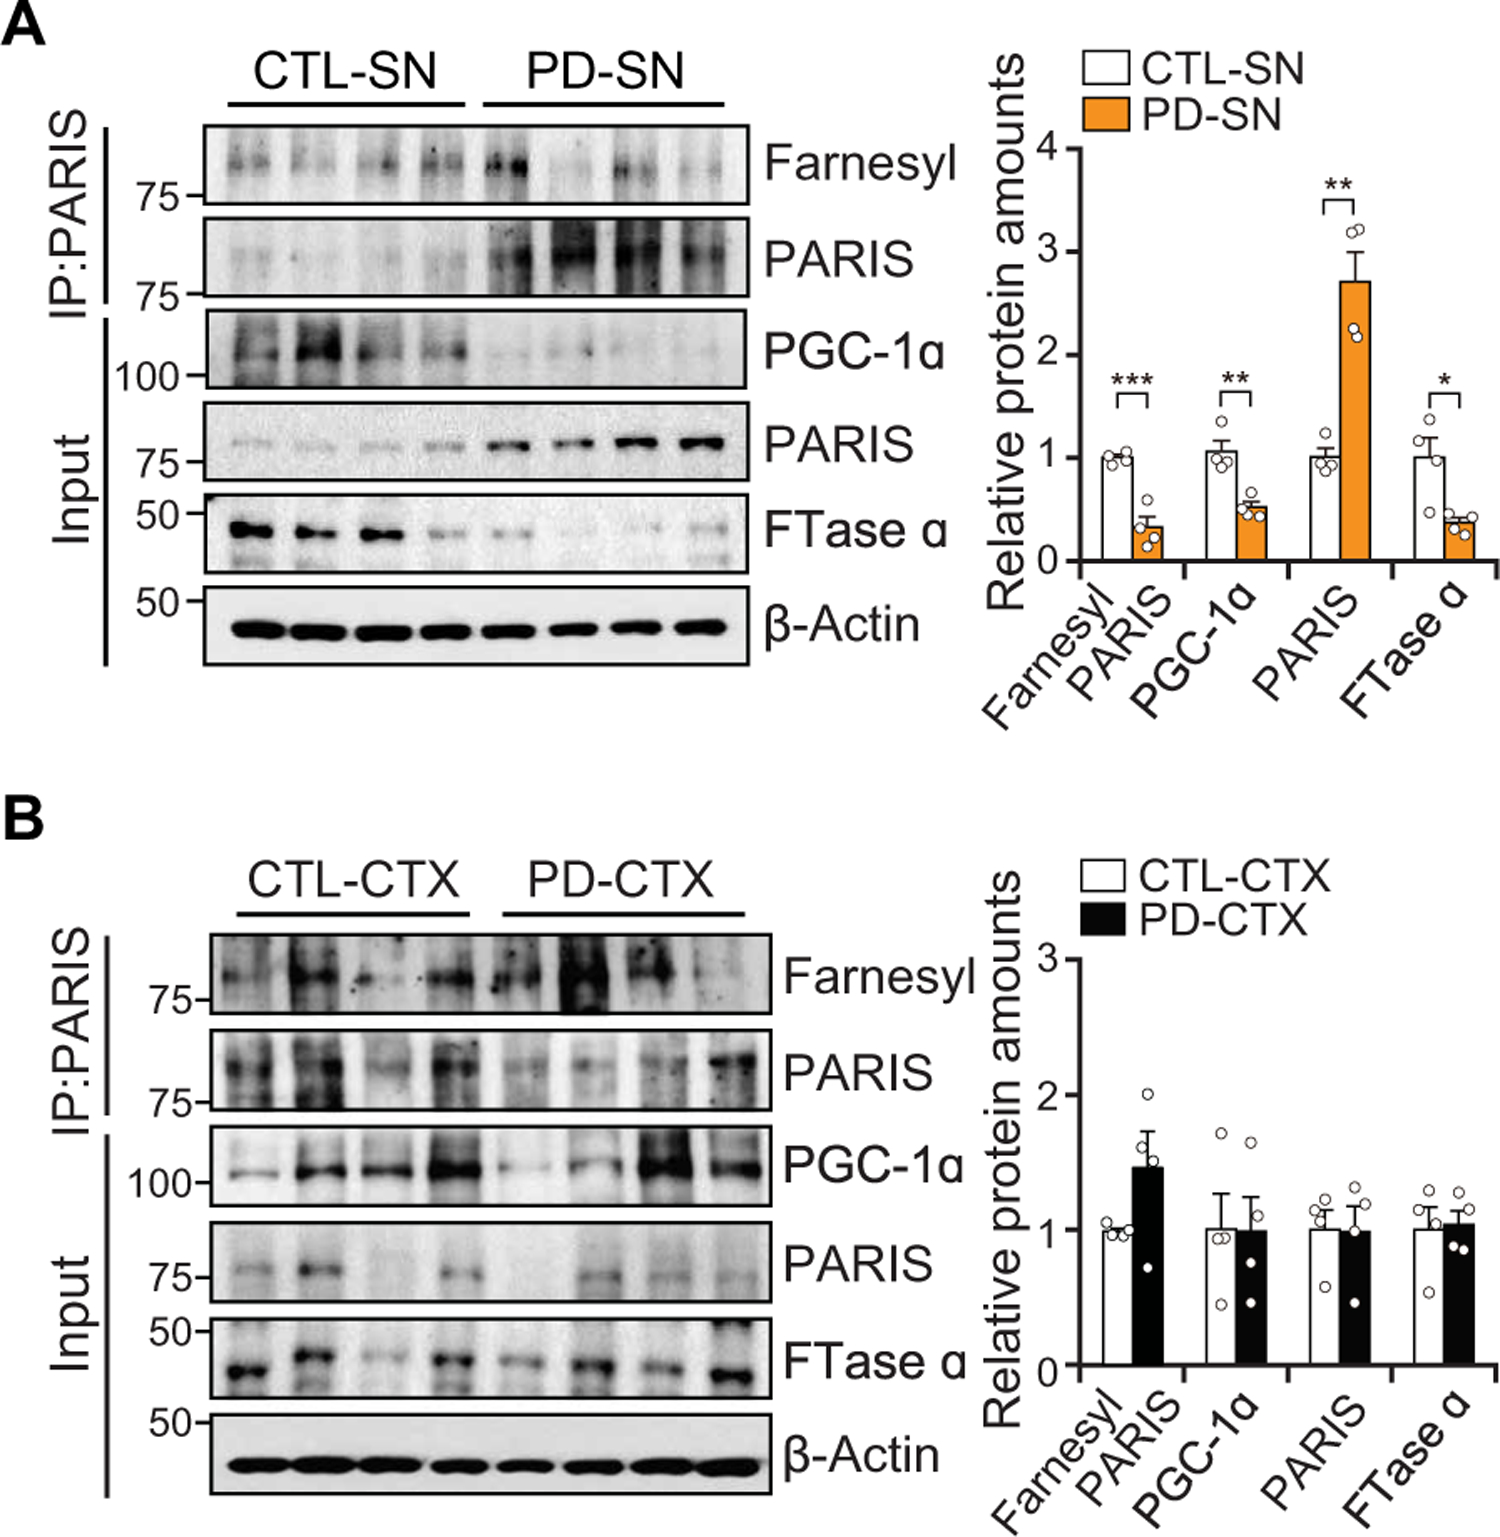
Accumulation of the parkin-interacting substrate (PARIS; ZNF746), due to inactivation of parkin, contributes to Parkinson's disease (PD) through repression of peroxisome proliferator-activated receptor-γ coactivator-1α (PGC-1α; PPARGC1A) activity. Here, we identify farnesol as an inhibitor of PARIS. Farnesol promoted the farnesylation of PARIS, preventing its repression of PGC-1α via decreasing PARIS occupancy on the PPARGC1A promoter. Farnesol prevented dopaminergic neuronal loss and behavioral deficits via farnesylation of PARIS in PARIS transgenic mice, ventral midbrain transduction of AAV-PARIS, adult conditional parkin KO mice, and the α-synuclein preformed fibril model of sporadic PD. PARIS farnesylation is decreased in the substantia nigra of patients with PD, suggesting that reduced farnesylation of PARIS may play a role in PD. Thus, farnesol may be beneficial in the treatment of PD by enhancing the farnesylation of PARIS and restoring PGC-1α activity.


Conflict of interest statement

Competing interests: Patents related to this work include US9274128B2 entitled “Transcriptional repression leading to Parkinson’s disease” and WO2017161155A1 “Methods for preventing or treating Parkinson’s disease by the farnesylation of PARIS.” T.M.D. is a member of the Linked Clinical Trials Committee. T.M.D. and V.L.D. are founders of Valted LLC and hold an ownership equity interest in the company. These arrangements have been reviewed and approved by the Johns Hopkins University in accordance with its conflict of interest policies. T.M.D. is a member of Scientific Advisory Board of CurePSP, is a consultant and advisor to Sun Pharma Advanced Research Company Ltd., has received personal compensation in an editorial capacity for Journal of Clinical Investigation, is a member of American Gene Technologies International Inc., advisory board, and is a consultant for Mitokinin. T.M.D. and V.L.D. are consultants to Inhibikase Therapeutics Inc.; T.M.D. serves on the Board of Directors and is compensated for his roles as a consultant and interim Chief Scientific Officer of Valted Seq Inc.; V.L.D. serves on the Board of Directors, is a consultant, and is compensated for her role as interim Chief Executive Officer of Valted Seq Inc.; V.L.D. serves on the Scientific Advisory Board for the Burke Neurological Institute. These arrangements have been reviewed and approved by the Johns Hopkins University in accordance with its conflict of interest policies. The other authors declare that they have no competing interests.

Figures

Fig. 1.
Fig. 1.. Identification of farnesol as a PGC-1α inducer.
(A) Experimental illustration of compound screening. A reporter cell line (SH-PGC-1α) expressing GFP and luciferase under control of PPARGC1A promoter was used to screen for compounds that induce PPARGC1A promoter activity. (B) Promoter activity of PPARGC1A by luciferase assay. Dotted line indicates 2.5-fold activation. All readouts are displayed with color-coded shapes: yellow diamond (DMSO), blue diamond (daidzein), and gray/orange dot (experimental compounds). (C) The PPARGC1A promoter activity of the top 0.2% compounds (17 compounds) [orange dots in (B)] in the setting of overexpression of PARIS. Bold-named (nine) compounds dose-dependently increase PPARGC1A promoter activity in the presence of PARIS overexpression, n = 3 independent experiments. (D) Relative mRNA amounts of PPARGC1A and its target genes normalized to GAPDH in SH-SY5Y cells treated with DMSO, 10 µM AVS-3648, ABT-0529, or CSU-1806 (farnesol); n = 3 independent experiments. PPARGC1A, peroxisome proliferator-activated receptor γ coactivator-1α; SOD2, superoxide dismutase 2; NRF1, nuclear respiratory factor 1; TFAM, mitochondrial transcription factor A; CYCS, cytochrome c, somatic; COX4I1, cytochrome c oxidase 4. (E) Immunoblot analysis of parkin, PARIS, PGC-1α, and NRF1 in shRNA-parkin knockdown cells ± farnesol (10 µM, 48 hours) treatment normalized to β-actin; n = 3 independent experiments. Quantitation of the immunoblots in the right panel. (F) Relative oxygen consumption rate (OCR) measured by microplate-based respirometry in stable SH-SY5Y cells overexpressing PARIS (SH-PARIS) ± farnesol (10 µM, 24 hours) treatment as compared to control SH-SY5Y cells (SH-CTL), n = 6 per group. n.s., not significant. Data are expressed as means ± SEM. Statistical significance was evaluated by applying an unpaired two-tailed Student t test (C) or using one-way ANOVA with Tukey post hoc test (D to F). Differences are considered significant when P < 0.05. *P < 0.05, **P < 0.01, and ***P < 0.001. Exact P values can be found in the accompanying statistical raw data.
Fig. 2.
Fig. 2.. PARIS is farnesylated.
(A) Illustration showing domain and putative farnesylation site of PARIS with the farnesyl moiety on C631 of PARIS. (B) Metabolic farnesylation assay of SH-SY5Y cells expressing Flag-tagged PARIS and siRNΑ-farnesyl transferase (FTase) α incubated with [3H]-farnesyl pyrophosphate (FPP). Farnesylation of PARIS was detected by autoradiography (Auto) or via an antibody that recognizes farnesylated proteins (Farnesyl). PARIS farnesylation was normalized to the flag signal, n = 3 independent experiments. Quantitation of the immunoblots in the bottom. (C) Detection of endogenous PARIS and HRas farnesylation by tagging-via-substrate (TAS) technique. ZNF212, negative control; Faz, azido farnesyl alcohol (F-azide-OH); Strep, streptavidin. Quantitation of the immunoblots in the bottom. (D) Superposition of PARIS C terminus with the crystal structure of FTase in complex with zinc ion (Zn) and CVLS-FPP peptide (Protein Data Bank: 2H6F). Close-up view (right) of the model of FTase in complex with Zn, PARIS C-terminal peptide, and FPP substrate. The interactions between PARIS C631, FPP, and Zn are indicated by black dashed lines. (E) Solvent-accessible surface and electrostatic surface potential showing FTase active CaaX-FPP binding site. The yellow boxes highlight the cleft where CaaX-FPP binds. N.D., not detected. Data are expressed as means ± SEM. Statistical significance was evaluated via one-way ANOVA with Tukey post hoc test (B). Differences are considered significant when P < 0.05. ***P < 0.001. Exact P values can be found in the accompanying statistical raw data.
Fig. 3.
Fig. 3.. PARIS can be farnesylated on C631 and is promoted by farnesol.
(A) In vitro farnesylation (IVF) assay with biotin-labeled PARIS WT peptide (VTDWTC631GLSVLGPTDGGDM) or C631S mutant peptide. (B) Representative immunoblot image of farnesylated PARIS and PGC-1α amounts in SH-SY5Y cells transfected with PARIS WT or C631S mutant with DMSO control or farnesol (10 µM), n = 3 independent experiments. Quantitation of farnesylated PARIS and PGC-1α amounts normalized to immunoprecipitated Flag-PARIS and β-actin, respectively (bottom). (C) Real-time qPCR of ChIP eluate normalized to input chromatin, n = 3 independent experiments. (D) Electrophoretic mobility shift assay (EMSA) of in vitro farnesylated GST, GST-PARIS WT, or C631S incubated with biotin-labeled insulin responsive sequence 1 (Biotin-IRS1) motif of PPARGC1A promoter. The arrow indicates GST-PARIS binding with IRS1. Data = means ± SEM. Statistical significance was determined via ANOVA test with Tukey post hoc (C, one-way; B, two-way). Differences were considered significant when P < 0.05. *P < 0.05, **P < 0.01, and ***P < 0.001. Exact P values can be found in the accompanying statistical raw data.
Fig. 4.
Fig. 4.. Farnesol prevents DA neuron loss in CamK-PARIS transgenic mice.
(A) Concentration of farnesol in the brain of control and CamK-PARIS ± farnesol diet (for 1 week) at 3 weeks of age, n = 6 mice per group. Chow diet (AIN-76A diet, Research diet, NJ) and farnesol diet [0.5% (w/w) of trans-farnesol in AIN-76A diet, Research diet, NJ]. (B) Representative TH immunohistochemistry of the SN of 6-week-old CamK-PARIS mice and age-matched littermate controls fed with chow or farnesol diet. PARIS is induced for 3 weeks by doxycycline withdrawal at 3 weeks of age. The farnesol diet was initiated 3 days before doxycycline withdrawal. Stereological assessment of TH or Nissl-positive neurons (right). Control ± farnesol diet, n = 4 mice per group; CamK-PARIS + chow diet, n = 6 mice; CamK-PARIS + farnesol diet, n = 3 mice. (C) Assessment of dopamine-related motor performance by pole test for CamK-PARIS and littermate control mice fed with chow or farnesol diet. PARIS was induced at 3 weeks of age, and behavior is assessed at 5 weeks of age. Control + chow diet, n = 8 mice; CamK-PARIS + chow diet, n = 5 mice; control + farnesol diet, n = 4 mice; CamK-PARIS + farnesol diet, n = 5 mice per group. (D) Survival rate of control and CamK-PARIS fed with a chow or farnesol diet. PARIS induction was started at 3 weeks of age by withdrawing Dox diet (control + chow, n = 8 mice; control + farnesol, n = 6 mice; CamK-PARIS + chow, n = 8 mice; CamK-PARIS + farnesol, n = 6 mice). (E) Representative immunoblot image of farnesylated PARIS, PGC-1α, NRF1, PARIS, and FTase α in the SN of 5- to 6-week-old CamK-PARIS mice and age-matched littermate controls (control) fed with chow (C) or farnesol (F) diet; n = 3 mice per group. Quantitation of the immunoblots in the right panel normalized to immunoprecipitated Flag or β-actin. (F) Real-time qRT-PCR analysis of Ppargc1a and its target genes in the SN of 5- to 6-week-old CamK-PARIS mice or age-matched littermate control mice fed with chow or farnesol diet normalized to GAPDH, n = 3 mice per group. Data = means ± SEM. Statistical significance was determined by two-way ANOVA test with Tukey post hoc analysis (A to C, E, and F) or log-rank (Mantel-Cox) test (D). Differences were considered significant when P < 0.05. *P < 0.05, **P < 0.01, and ***P < 0.001. Exact P values can be found in the accompanying statistical raw data.
Fig. 5.
Fig. 5.. Farnesol’s protection against PARIS-induced DA degeneration requires PARIS farnesylation.
(A) Representative immunoblot image of farnesylated PARIS, PGC-1α, PARIS, and FTase α at 3 weeks postintranigral injection of AAV-GFP, AAV-PARIS WT, or C631S into the SN of 6-week-old C57BL/6N mice fed with control chow or farnesol diet, n = 3 mice per group. Quantitation of the immunoblots in the bottom normalized to immunoprecipitated PARIS or β-actin. (B) TH staining of a representative SN section of mice injected with AAV-GFP, AAV-PARIS WT, or AAV-PARIS C631S ± farnesol diet at 4 weeks after injection. Top six panels show the noninjected side (Non) and ipsilateral injected side (Inj). Colored rectangle box indicates enlarged area (bottom six panels). Stereological TH, Nissl-positive neuronal counting was indicated at the bottom; n = 5 mice per group. (C) Amphetamine-induced rotation test with mice injected with AAV-GFP, AAV-PARIS WT, or AAV-PARIS C631S ± farnesol diet at 4 weeks after injection, n = 4 mice per group. Data = means ± SEM. Statistical significance was determined by ANOVA test with Tukey post hoc analysis (A and B, two-way; C, one-way). *P < 0.05, **P < 0.01, and ***P < 0.001. Exact P values can be found in the accompanying statistical raw data.
Fig. 6.
Fig. 6.. Farnesol’s prevention of DA neuronal degeneration induced by parkin loss is dependent on PARIS farnesylation at C631.
(A) Schematic illustration of generation of Zfp746(PARIS)C638S/C638S knock-in mice (C638S KI) by CRISPR/Cas9. C638S KI mice were bred with floxed parkin mice (parkinflox/flox) to generate parkinflox/flox/PARISC638S/C638S mice. (B) Experimental design to conditionally KO parkin in adult mice. AAV-Cre was injected into the SN of 8-week-old parkinflox/flox and parkinflox/flox/PARISC638S/C638S mice to generate cPK-KO and cPK-KO/C638S KI mice, respectively. Mice were fed with control chow or farnesol diet for 7 days before injection and euthanized after injection at 3 months. (C) Representative immunoblot images of farnesylated PARIS, parkin, PARIS, PGC-1α, and FTase α in the SN of cPK-KO and cPK-KO/C638S KI mice fed with control chow or the farnesol diet, n = 3 mice per group. Quantitation of the immunoblots in the right panel normalized to immunoprecipitated PARIS or β-actin. f/f, flox/flox. (D) Relative mRNA expression of Ppargc1a and its dependent genes normalized to GAPDH by real-time qRT-PCR in the SN of cPK-KO and cPK-KO/C638S KI mice fed with control chow or the farnesol diet, n = 3 mice per group. (E) TH staining of a representative section of 5-month-old cPK-KO and cPK-KO/C638S KI generated by stereotaxic injection of AAV-Cre into the SN of 8-week-old parkinflox/flox and parkinflox/flox/C638S KI mice, respectively. Scale bar, 400 µm. Stereological TH, Nissl-positive neuronal counting, n = 5 mice per group (right). Data = means ± SEM. Statistical significance was determined by two-way ANOVA test with Tukey post hoc analysis (C to E). Differences were considered significant when P < 0.05. *P < 0.05, **P < 0.01, and ***P < 0.001. Exact P values can be found in the accompanying statistical raw data.
Fig. 7.
Fig. 7.. Farnesol fails to rescue α-syn PFF–mediated DA neuron loss in Zfp746(PARIS)C638S/C638S knock-in mice.
(A) Phosphate-buffered saline (PBS) or α-syn PFF was injected into the STR of 2-month-old PARIS C638S KI (C638S K) mice, and age-matched littermate controls (WT) were fed with control chow or farnesol diet, 2 weeks after injection. (B) Representative immunoblot image of farnesylated PARIS, PGC-1α, PARIS, and FTase α in the SN of C638S KI and WT mice ± α-syn PFF ± farnesol diet at 6 months after injection of α-syn PFF; n = 3 mice per group. Quantitation of the immunoblots in the bottom normalized to immunoprecipitated PARIS or β-actin. WB, western blot analysis. (C) TH staining of a representative section of 8-month-old C638S KI and WT mice ± α-syn PFF ± farnesol diet. Scale bar, 400 µm. Stereological TH, Nissl-positive neuronal counting was indicated at the bottom, n = 4 mice per group. (D) HPLC assessment of the content of dopamine (DA) normalized to protein expression in the STR of 8-month-old C638S KI and WT mice ± α-syn PFF ± farnesol diet; n = 4 mice per group. (E) Assessment of DA-related motor performance by pole test for C638S KI and WT mice ± α-syn PFF ± farnesol diet. WT, n = 8, 9, 10, and 9 mice for each group; C638S KI, n = 8, 10, 9, and 9 mice for each group. Data = means ± SEM. Statistical significance was determined by applying a two-way ANOVA test with Tukey post hoc analysis (C to F). Differences were considered significant when P < 0.05. *P < 0.05, **P < 0.01, and ***P < 0.001. Exact P values can be found in the accompanying statistical raw data.
Fig. 8.
Fig. 8.. PARIS farnesylation is decreased in the SN of sporadic patients with PD.
(A) PARIS farnesylation, PGC-1α, PARIS, and FTase α amounts in the SN of sporadic patients with PD brains as compared to age-matched controls; n = 4 per group. Quantification of farnesylated PARIS is normalized to immunoprecipitated PARIS (right). (B) Immunoblot analysis of PARIS farnesylation, PGC-1α, PARIS, and FTase α in the CTX from sporadic patients with PD compared to age-matched controls; n = 4 per group. Quantification of farnesylated PARIS is normalized to immunoprecipitated PARIS (right). Data = means ± SEM. Statistical significance was determined by applying an unpaired two-tailed student t test. Differences were considered significant when P < 0.05. *P < 0.05, **P < 0.01, and ***P < 0.001. Exact P values can be found in the accompanying statistical raw data.

Similar articles

Cited by

References

    1. Mullin S, Schapira AH, Pathogenic mechanisms of neurodegeneration in Parkinson disease. Neurol. Clin 33, 1–17 (2015). - PubMed
    1. Savitt JM, Dawson VL, Dawson TM, Diagnosis and treatment of Parkinson disease: Molecules to medicine. J. Clin. Invest 116, 1744–1754 (2006). - PMC - PubMed
    1. Jellinger KA, Neuropathology of sporadic Parkinson’s disease: Evaluation and changes of concepts. Mov. Disord 27, 8–30 (2012). - PubMed
    1. Corti O, Lesage S, Brice A, What genetics tells us about the causes and mechanisms of Parkinson’s disease. Physiol. Rev 91, 1161–1218 (2011). - PubMed
    1. Martin I, Dawson VL, Dawson TM, Recent advances in the genetics of Parkinson’s disease. Annu. Rev. Genomics Hum. Genet 12, 301–325 (2011). - PMC - PubMed

Publication types

Substances