. 2021 Jul 28;13(604):eabc8922.
doi: 10.1126/scitranslmed.abc8922.

Blockade of the CD93 pathway normalizes tumor vasculature to facilitate drug delivery and immunotherapy

Affiliations

Blockade of the CD93 pathway normalizes tumor vasculature to facilitate drug delivery and immunotherapy

Yi Sun et al. Sci Transl Med. .

Abstract

The immature and dysfunctional vascular network within solid tumors poses a substantial obstacle to immunotherapy because it creates a hypoxic tumor microenvironment that actively limits immune cell infiltration. The molecular basis underpinning this vascular dysfunction is not fully understood. Using genome-scale receptor array technology, we showed here that insulin-like growth factor binding protein 7 (IGFBP7) interacts with its receptor CD93, and we subsequently demonstrated that this interaction contributes to abnormal tumor vasculature. Both CD93 and IGFBP7 were up-regulated in tumor-associated endothelial cells. IGFBP7 interacted with CD93 via a domain different from multimerin-2, the known ligand for CD93. In two mouse tumor models, blockade of the CD93/IGFBP7 interaction by monoclonal antibodies promoted vascular maturation to reduce leakage, leading to reduced tumor hypoxia and increased tumor perfusion. CD93 blockade in mice increased drug delivery, resulting in an improved antitumor response to gemcitabine or fluorouracil. Blockade of the CD93 pathway triggered a substantial increase in intratumoral effector T cells, thereby sensitizing mouse tumors to immune checkpoint therapy. Last, analysis of samples from patients with cancer under anti-programmed death 1/programmed death-ligand 1 treatment revealed that overexpression of the IGFBP7/CD93 pathway was associated with poor response to therapy. Thus, our study identified a molecular interaction involved in tumor vascular dysfunction and revealed an approach to promote a favorable tumor microenvironment for therapeutic intervention.


Figures

Fig. 1.
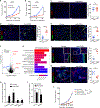
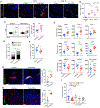
Fig. 1.. Anti-CD93 inhibits tumor growth and promotes vascular maturation in mice.
(A and B) Subcutaneous KPC (A, n = 12) and B16 melanoma (B, n = 10) tumors in mice were treated with CD93 mAb (7C10) twice a week when tumors became palpable. Data are representative of at least three independent experiments. (C to E) KPC tumor tissue was obtained on day 8 after antibody treatment. Blood vessel numbers within tumors were quantified by CD31 staining (C). Images and comparisons of tissues for blood vessels (CD31) expressing NG2 (D) and αSMA (E) to assess blood vessels covered by pericytes and smooth muscle cells, respectively. Data are representative of two independent experiments. Scale bars, 50 μm. DAPI, 4′,6-diamidino-2-phenylindole. (F to I) RNA-seq was performed on ECs isolated from KPC tumors in mice. Volcano plot revealed differentially expressed genes between control- and anti-CD93–treated groups (F). Gene ontology analysis was performed to identify biological pathways for differentially expressed genes (G). Quantitative PCR was performed to validate the expression increases of ALDH1A3, BNIP3, MAFA, and HMGCS2 (H), and the decreases of GATA1 and SFRP2 (I). (J and K) KPC tumor-bearing mice after 1 week of antibody treatment were assessed for lectin perfusion (J) and for dextran leakage (K). Data are representative of two independent experiments. Scale bars, 50 μm. (L) WT B6 mice were reconstituted with bone marrow cells from WT or CD93−/− mice. Eight weeks after reconstitution, mice were inoculated with B16 tumor cells and started with antibody treatment. Tumor volumes were measured at the time points shown after first treatment. n = 10 to 13. Data are representative of two independent experiments. Data are presented as means ± SEM. Data in (A), (B), and (L) were analyzed with two-way ANOVA test. Data in (C) to (F) and (H) to (K) were analyzed with unpaired Student’s t test. *P < 0.05, **P < 0.01, and ***P < 0.001. ns, not significant.
Fig. 2.
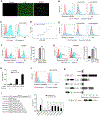
Fig. 2.. IGFBP7 is identified as a binding partner for CD93.
(A) Graphic views of individual wells with a positive hit (IGFBP7) for CD93-Ig in a GSRA screening system. Scale bars, 50 μm. (B) HEK293T cells transfected with control (red) or CD93 construct (blue) were stained with IGFBP7-Ig for binding, with the presence of anti-CD93 (MM01) or anti-IGFBP7 (R003) mAb. Data are representative of two independent experiments. (C) HUVEC cells were stained with control (red) or IGFBP7-Ig (blue), with or without the presence of CD93 mAb (MM01). Data are representative of two independent experiments. (D) Microscale thermophoresis binding curve of human IGFBP7 to CD93 protein. (E) HEK293T cells transfected with control (red) or mouse CD93 construct (blue) were stained with mouse IGFBP7-Ig for binding, with the presence of anti-mouse CD93 (clone 7C10) or anti–mouse IGFBP7 (clone 2C6). Data are representative of at least three independent experiments. (F) CD93+ CHO cells were stained with MMRN2-Ig, with or without the presence of IGFBP7-His protein. Data are representative of two independent experiments. MFI, mean fluorescent intensity. (G) CD93+ CHO cells were stained for IGFBP7 binding, with or without the addition of MMRN2 protein. Data are representative of two independent experiments. (H) Wells coated with IGFBP7-His protein were incubated with CD93-His protein before examining for MMRN2-Ig binding by ELISA. Wells coated with CD93-His protein served as a positive control. Data are representative of two independent experiments. (I) Wells coated with mIGFBP7-His or anti-mCD93 (7C10) were incubated with mFc-tagged mCD93 fragment fusion proteins for binding by ELISA. Data are representative of two independent experiments. (J) HEK293T cells transfected with control (red) or CD93 construct (blue) were stained with MMRN2-Ig, with or without the presence of anti-mCD93 (7C10). Data are representative of two independent experiments. (K) Schematic diagrams represent the structure of a series of chimeric proteins that were generated by replacing each domain of IGFBP7 (BP7) with a corresponding portion from IGFBPL1 (BPL1). The binding of each chimeric protein to CD93 transfectant was tested by flow cytometry. Binding index refers to the ratio of mean fluorescence intensity of CD93 transfectant to control cells.
Fig. 3.
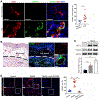
Fig. 3.. IGFBP7 is up-regulated on tumor vasculature.
(A) IGFBP7 expression on blood vessels (CD31+) in normal pancreas and PDA tissues. Each dot represents the mean value for one tissue. Scale bars, 50 μm. (B) Representative image of IGFBP7 expression on blood vessels (CD31+) in human head and neck cancer tissue. H&E staining was performed to identify tumor from the adjacent normal tissue (Adj normal). Scale bars, 20 μm. (C) HUVEC cells treated with DMOG were examined for HIF-1α and IGFBP7 expression by Western blot. IGFBP7 protein was compared by densitometric quantification. Data are representative of two independent experiments. (D) MAECs under the treatment of DMOG with or without VEGFR2-blocking mAb for 24 hours were examined for IGFBP7 expression. Data are representative of two independent experiments. Scale bars, 20 μm. Data presented as means ± SEM. Data in (A) were analyzed with unpaired Student’s t test. Data in (C) and (D) were analyzed with one-way ANOVA test with a Tukey post hoc test. *P < 0.05 and ***P < 0.001.
Fig. 4.
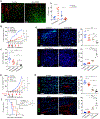
Fig. 4.. Anti-CD93 treatment improves drug delivery and facilitates chemotherapy.
(A) KPC tumor-bearing mice under antibody treatment for 8 days were injected with doxorubicin and pimonidazole for the assessment of drug delivery and hypoxia, respectively. Data are representative of two independent experiments. Scale bars, 50 μm. (B to D) KPC tumor-bearing mice were treated with antibody (red arrowhead) and/or gemcitabine (black arrowhead). Tumor growth (B) and tumor weight at day 14 (C) are shown. n = 10. Tumor tissues harvested on day 14 after therapy were stained for Ki-67 and cleaved caspase 3 (CC3) (D). Scale bars, 50 μm. Data are representative of two independent experiments. (E to G) B16 tumor-bearing mice were treated with antibody (red arrowhead) and/or 5-FU (black arrowhead). Tumor growth (E, n = 10) and survival curve (F, n = 7) of groups with different treatments are shown. Tumor tissues harvested on day 14 after therapy were stained for Ki-67 and CC3 (G). Scale bars, 50 μm. Data are representative of two independent experiments. Data presented as means ± SEM. (A) analyzed with unpaired Student’s t test. Data in (B) and (E) analyzed with two-way ANOVA test with a Dunnett’s post hoc test. (F) Kaplan-Meier curves analyzed with log-rank (Mantel-Cox) test. Data in (C), (D), and (G) analyzed with one-way ANOVA test with a Tukey post hoc test. *P < 0.05, **P < 0.01 and ***P < 0.001.
Fig. 5.
Fig. 5.. CD93 blockade promotes immune cell infiltration to inhibit tumor progression.
(A and B) Representative images (A) and quantifications (B) of CD3+ T cells (green) in healthy skin of naive mice and implanted KPC tumors harvested on days 8 and 15 after antibody treatment. Scale bars, 50 μm. Data are representative of three independent experiments. (C to F) Single-cell suspensions were prepared from KPC tumors harvested on day 8 after antibody therapy. Flow cytometry analysis was performed to determine the percentage of infiltrating CD45+ leukocytes (C) and the densities of different immune cells (D). The percentages of effector cytokine-producing CD8+ T cells (E) and Foxp3+ Treg in CD4+ T cells (F) were quantified. Data are representative of two independent experiments. (G) Images and comparisons of MECA79 expression (green) on CD31+ blood vessels (red) within KPC tumors harvested on 8 days after antibody treatment. Data are representative to two independent experiments. Scale bars, 50 μm. (H) Images and comparisons of CD3+ T cells (green) within subcutaneous B16 tumors 14 days after antibody treatment. Scale bars, 50 μm. Data are representative of two independent experiments. (I) KPC tumor (subcutaneous model) weights after 14 days of antibody treatment were determined. In some mice, CD8+ T cells, CD4+ T cells, or NK (including NKT) cells were eliminated by a corresponding depleting antibody. Data are representative of two independent experiments. Data presented as means ± SEM. Data in (B) and (I) were analyzed with one-way ANOVA test with a Tukey post hoc test. Data in (C) to (H) were analyzed with unpaired Student’s t test. *P < 0.05, **P < 0.01, and ***P < 0.001.
Fig. 6.
Fig. 6.. CD93 blockade sensitizes tumors to ICB therapy.
(A and B) Representative images of PD-L1 expression (green) in subcutaneous KPC tumors harvested on day 15 after antibody treatment. Scale bars, 50 μm. Single-cell suspensions prepared from KPC tumor tissues were quantified for PD-L1 expression by flow cytometry. (C to E) B6 mice with palpable KPC tumors were divided into four groups and treated with control, anti-CD93, anti-PD1, or the combination of anti-CD93 and anti-PD1 at the time points indicated by the red arrowheads. Tumor growth curve (C) and tumor weight 12 days after treatment (D) were measured. n = 10. The densities of respective immune cells within tumors were determined by flow cytometry (E). Data are representative of two independent experiments. (F to H) Mice with palpable B16 tumors were treated with control, anti-CD93, ICB (PD1 + CTLA mAbs), or the combination of anti-CD93 and ICB at the time points indicated by the red arrows. Tumor growth (F) and survival curve (G) of groups were shown. n = 10. The densities of CD45+ leukocytes and CD3+ T cells within tumors harvested on day 12 were determined by flow cytometry (H). Data are representative of two independent experiments. Data presented as means ± SEM. Data in (B) analyzed with unpaired Student’s t test. Data in (D), (E), and (H) analyzed with one-way ANOVA test with a Tukey post hoc test. Data in (C) and (F) analyzed with two-way ANOVA test with a Dunnett’s post hoc test. (G) Kaplan-Meier curves analyzed with log-rank (Mantel-Cox) test. *P < 0.05, **P < 0.01, and ***P < 0.001.

References

    1. De Palma M, Biziato D, Petrova TV, Microenvironmental regulation of tumour angiogenesis. Nat. Rev. Cancer 17, 457–474 (2017). - PubMed
    1. Carmeliet P, Jain RK, Angiogenesis in cancer and other diseases. Nature 407, 249–257 (2000). - PubMed
    1. McDonald DM, Baluk P, Significance of blood vessel leakiness in cancer. Cancer Res 62, 5381–5385 (2002). - PubMed
    1. Dreher MR, Liu W, Michelich CR, Dewhirst MW, Yuan F, Chilkoti A, Tumor vascular permeability, accumulation, and penetration of macromolecular drug carriers. J. Natl. Cancer Inst 98, 335–344 (2006). - PubMed
    1. Lanitis E, Irving M, Coukos G, Targeting the tumor vasculature to enhance T cell activity. Curr. Opin. Immunol 33, 55–63 (2015). - PMC - PubMed

Publication types

Substances