. 2021 Nov 1;40(11):955-961.
doi: 10.1097/INF.0000000000003279.

Age-dependency of the Propagation Rate of Coronavirus Disease 2019 Inside School Bubble Groups in Catalonia, Spain

Affiliations

Age-dependency of the Propagation Rate of Coronavirus Disease 2019 Inside School Bubble Groups in Catalonia, Spain

Sergio Alonso et al. Pediatr Infect Dis J. .

Abstract

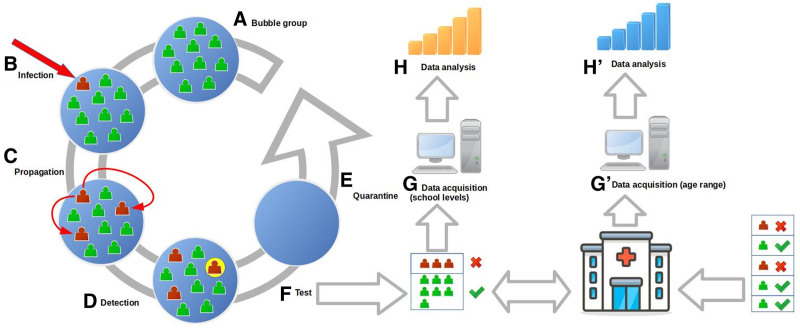
Background: We analyzed contagions of coronavirus disease 2019 inside school bubble groups in Catalonia, Spain, in the presence of strong nonpharmaceutical interventions from September to December 2020. More than 1 million students were organized in bubble groups and monitored and analyzed by the Health and the Educational departments.

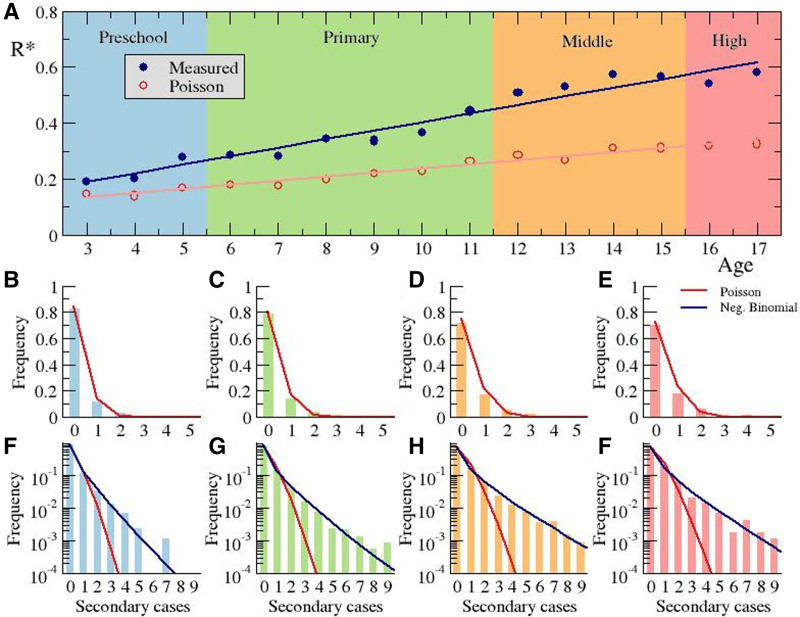
Methods: We had access to 2 data sources, and both were employed for the analysis, one is the Catalan school surveillance system and the other of the educational department. As soon as a positive index case is detected by the health system, isolation is required for all members of the bubble group, in addition to a mandatory proactive systematic screening of each individual. All infected cases are reported. It permits the calculation of the average reproductive number (R*), corresponding to the average number of infected individuals per index case.

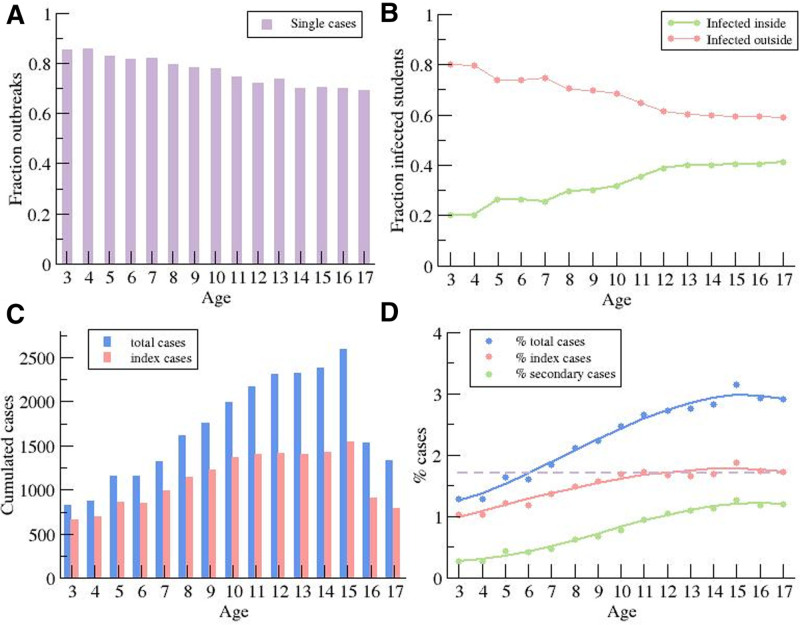
Results: We found that propagation inside of the bubble group was small. Among 75% index cases, there was no transmission to other members in the classroom, with an average R* across all ages inside the bubble of R* = 0.4. We found a significant age trend in the secondary attack rates, with the R* going from 0.2 in preschool to 0.6 in high school youth.

Conclusions: The secondary attack rate depends on the school level and therefore on the age. Super-spreading events (outbreaks of 5 cases or more) in childhood were rare, only occurring in 2.5% of all infections triggered from a pediatric index case.


Conflict of interest statement

S.A. is professor in the Department of Physics in the Universitat Politècnica de Catalunya; he works in the Computational Biology and Complex Systems research group and its research focus on the application of mathematical and statistical tools to biological problems. The remaining authors have no conflicts of interest to disclose.

Figures

FIGURE 1.
FIGURE 1.
Outline of the protocols and data acquisition process. A: Bubble group made up of 10–30 students. B: Infection, outside, of an individual of the bubble group, (C) propagation of the disease inside the bubble group, (D) detection of one of the infected individuals, (E) quarantine of the whole bubble group for 10 days, (F) test of all the individuals of the group, (G) data acquisition of all the positives per group and school level, (H) data analysis of the propagation inside the bubble group per school level, (G) data acquisition for age ranges from the general data system, and (H) data analysis per age range.
FIGURE 2.
FIGURE 2.
Evolution of daily new cases distributed by age. Daily new cases for preschool (A), primary (B), middle (C), and high (D) school, and 7-day averages obtained from the data in the schools by school years and from the official data by age ranges.
FIGURE 3.
FIGURE 3.
Distribution of daily new cases by age. A: Dependence of the fraction of index cases without secondary cases on the educational level. B: Fraction of students infected inside and outside of the bubble group, assuming no simultaneous infections by different index cases. C: Total number of cases and index cases for different educational level. D: Percentage of students infected during the 3 months (as reference for Catalonia 3% of the population were infected), percentage of case indexes, and percentage of secondary cases.
FIGURE 4.
FIGURE 4.
Calculation of the reproductive number. A: Dependence of the reproductive number on the educational level and the corresponding associated age. Frequency of the number of secondary cases per index case for preschool (B, F) primary (C, G), middle (D, H), and high (E, I) school, using linear (B–E) and logarithmic (F–I) scales. Poisson distribution is fitted employing a least square method for red lines in panels (B–I), and the negative binomial distribution is fitted employing maximum likelihood estimation method for blue lines in panels (F–I) giving rise to values R = 0.27 and dispersion parameter k = 0.41 (F), R = 0.35 and dispersion parameter k = 0.32 (G), R = 0.55 and dispersion parameter k = 0.35 (H), R = 0.56 and dispersion parameter k = 0.41 (I).

References

    1. Götzinger F, Santiago-García B, Noguera-Julián A, et al. ptbnet COVID-19 Study Group. COVID-19 in children and adolescents in Europe: a multinational, multicentre cohort study. Lancet Child Adolesc Health. 2020;4:653–661. - PMC - PubMed
    1. Munro APS, Faust SN. COVID-19 in children: current evidence and key questions. Curr Opin Infect Dis. 2020;33:540–547. - PubMed
    1. Viner RM, Mytton OT, Bonell C, et al. . Susceptibility to SARS-CoV-2 infection among children and adolescents compared with adults: a systematic review and meta-analysis. JAMA Pediatr. 2021;175:143–156. - PMC - PubMed
    1. Viner RM, Russell SJ, Croker H, et al. . School closure and management practices during coronavirus outbreaks including COVID-19: a rapid systematic review. Lancet Child Adolesc Health. 2020;4:397–404. - PMC - PubMed
    1. Viner RM, Bonell C, Drake L, et al. . Reopening schools during the COVID-19 pandemic: governments must balance the uncertainty and risks of reopening schools against the clear harms associated with prolonged closure. Arch Dis Child. 2020;106:111–113. - PMC - PubMed

Publication types