Comparative Study
. 2021 Jul 28;11(1):15312.
doi: 10.1038/s41598-021-93479-z.

Changes in expression of PD-L1 on peripheral T cells in patients with melanoma and lung cancer treated with PD-1 inhibitors

Affiliations
Comparative Study

Changes in expression of PD-L1 on peripheral T cells in patients with melanoma and lung cancer treated with PD-1 inhibitors

Sarah J Dart et al. Sci Rep. .

Abstract

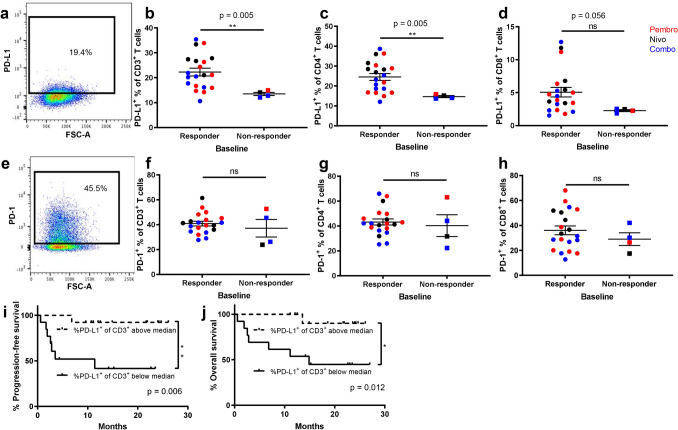
Advances in cancer immunology have increased the use of immune checkpoint inhibitors in clinical practice, however not all patients respond, and treatment can have severe side-effects. Blood-based immunological biomarkers are an attractive method for predicting which patients will respond to therapy, however, reliable biomarkers for immune checkpoint blockade are lacking. This study aimed to identify patients before or early in treatment who would best respond to PD-1 inhibitors. We hypothesised that higher baseline PD-L1 and/or PD-1 on peripheral blood T cells could predict radiological response to PD-1 inhibitors. This pilot prospective cohort study assessed 26 patients with melanoma or non-small cell lung cancer, treated with pembrolizumab, nivolumab, or nivolumab/ipilimumab combined. Response was assessed by RECIST 1.1. Peripheral blood lymphocytes collected at baseline, after one cycle, 10 weeks and at discontinuation of therapy were analysed by flow cytometry. Patients with a higher proportion of PD-L1+ T cells at baseline had improved objective response to PD-1 inhibitor therapy, and patients with a lower proportion of regulatory T cells at baseline experienced more immune-related adverse events. These findings may prove useful to assist in clinical decision making. Further studies with larger cohorts are required to validate these findings.


Conflict of interest statement

M.J.M. and T.M.M. declare serving on the advisory boards for AstraZeneca, Bristol-Myers Squibb, Merck Sharp & Dohme and Novartis. M.J.M. also declares serving on the advisory boards for Pfizer and Roche. M.J.M. and T.M.M. declare receiving travel support from AstraZeneca, Bristol-Meyers Squibb and Roche. S.J.D., A.M.C., A.M.M., W.L.C, M.U.H. and S.E.B. declare they have no competing interests related to the work described.

Figures

Figure 1
Figure 1
Swimmer plot showing individual patient characteristics with respect to time since commencement of therapy including: treatment type and duration, overall survival (OS), date of death (RIP) or censorship date, and timing of radiological responses of either complete response (CR), partial response (PR) or progressive disease (PD). Timing of toxicities of grade 3 or above are also noted. Patients are ordered time until either first recorded disease progression or time until censorship. NR non-responding patient. Patients 24 and 18 were not assessed for radiological response.
Figure 2
Figure 2
Patients with a higher baseline PD-L1 expression on T cells have a more favourable overall best response. PBMC collected from patients were assessed for PD-L1 and PD-1 expression in the total CD3+, CD3+CD4+ and CD3+CD8+ lymphocyte populations by flow cytometry, using fluorescence-minus one controls to set gates. Frequencies of PD-L1 (a–d) and PD-1 (e–h) in each population for total responder (n = 20) and non-responder patients (n = 4) were compared using a Mann–Whitney test; **p ≤ 0.005; error bars, SEM. Data is displayed with treatment groups colour-coded; pembrolizumab, red; nivolumab, black; combination nivolumab/ipilimumab, blue. Kaplan–Meier plot showing progression-free survival (i) and overall survival (j) of patients with CD3+ T cell %PD-L1 expression above and below the median, p values calculated using Mantel-Cox Log-rank test. See also Supplementary Fig. S2.
Figure 3
Figure 3
Increased activation and proliferation of CD8+ and CD4+ lymphocytes after therapy. Flow cytometry analysis of CD8+ and CD4+ lymphocytes collected from all patients. Fold change in the proportion of Ki67+ (a) and ICOS+ (b) CD8+ T cells, and Ki67+ (c) and ICOS+ (d) CD4+ T cells between baseline and day 21, comparing patients treated with pembrolizumab (pembro; n = 9), nivolumab (nivo; n = 6), or combination nivolumab/ipilimumab (combo; n = 10). Fold change in the proportion of (e) Ki67+ and (f) ICOS+ CD8+ and CD4+ T cells between baseline and day 21, in responding (n = 20) vs non-responding (n = 4) patients. Proportion of CD8+ (g) and CD4+ (h) lymphocytes expressing Ki67 and ICOS at baseline (BL; n = 20), day 21 (D21; n = 20), week 10 (Wk10; n = 18) and time of discontinuation or progression (Prog.; n = 10), for responding patients only, colour-coded by treatment group (i) Proportion of CD3+ lymphocytes expressing PD-L1 at baseline (BL), day 21 (D21), week 10 (Wk10) and time of discontinuation or progression (Prog.), for responders (n = 20, 20, 18, 10) and non-responders (n = 4, 4, 2, 2), colour-coded by treatment group. p values calculated by Kruskal–Wallis test with multiple comparisons (a–d), Mann–Whitney test (e,f) or mixed effects analysis (g–i); *p ≤ 0.05, ** p ≤ 0.005; error bars, SEM.
Figure 4
Figure 4
Patients who go on to have grade 3 irAEs have lower proportions of total Tregs at baseline. (a) Baseline Treg (CD25+CD127loFoxP3+) proportion of CD3+CD4+ lymphocytes in patients experiencing grade 3 irAE (n = 11) or no toxicity (n = 15). (b) Frequencies of Treg subsets at baseline: CD45RA-FoxP3hi activated Treg (aTreg); CD45RA+FoxP3lo resting Treg (rTreg); CD45RA-FoxP3lo non-suppressive Treg cells. Mann–Whitney test; *p ≤ 0.05; error bars, SEM.

References

    1. Larkin J, et al. Combined nivolumab and ipilimumab or monotherapy in untreated melanoma. N. Engl. J. Med. 2015;373:23–34. doi: 10.1056/NEJMoa1504030. - DOI - PMC - PubMed
    1. Ribas A, et al. Pembrolizumab versus investigator-choice chemotherapy for ipilimumab-refractory melanoma (KEYNOTE-002): A randomised, controlled, phase 2 trial. Lancet Oncol. 2015;16:908–918. doi: 10.1016/S1470-2045(15)00083-2. - DOI - PMC - PubMed
    1. Robert C, et al. Nivolumab in previously untreated melanoma without BRAF mutation. N. Engl. J. Med. 2015;372:320–330. doi: 10.1056/NEJMoa1412082. - DOI - PubMed
    1. Robert C, et al. Pembrolizumab versus ipilimumab in advanced melanoma. N. Engl. J. Med. 2015;372:2521–2532. doi: 10.1056/NEJMoa1503093. - DOI - PubMed
    1. Wolchok JD, et al. Overall survival with combined nivolumab and ipilimumab in advanced melanoma. N. Engl. J. Med. 2017;377:1345–1356. doi: 10.1056/NEJMoa1709684. - DOI - PMC - PubMed

Publication types

MeSH terms