. 2022 Jan;47(2):588-598.
doi: 10.1038/s41386-021-01110-6. Epub 2021 Jul 28.

Proof of concept study to develop a novel connectivity-based electric-field modelling approach for individualized targeting of transcranial magnetic stimulation treatment

Affiliations

Proof of concept study to develop a novel connectivity-based electric-field modelling approach for individualized targeting of transcranial magnetic stimulation treatment

Nicholas L Balderston et al. Neuropsychopharmacology. 2022 Jan.

Abstract

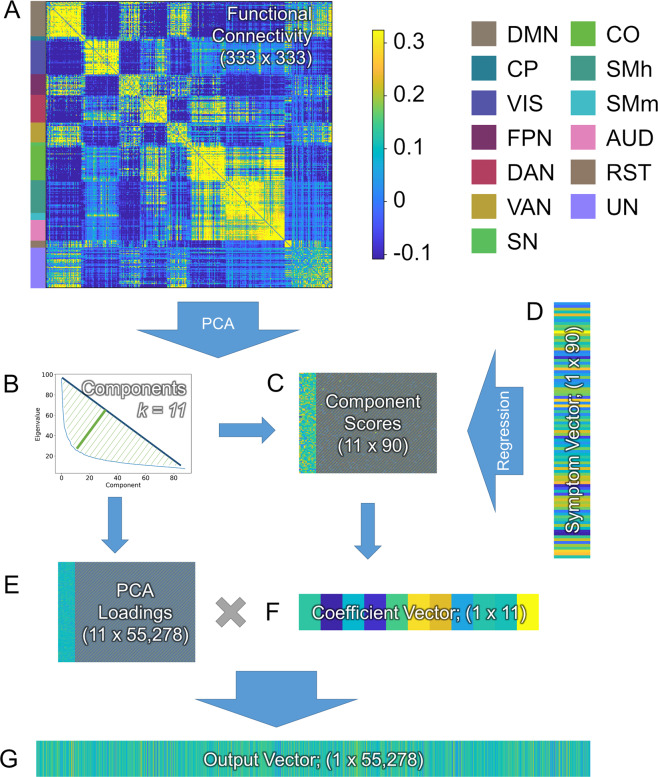
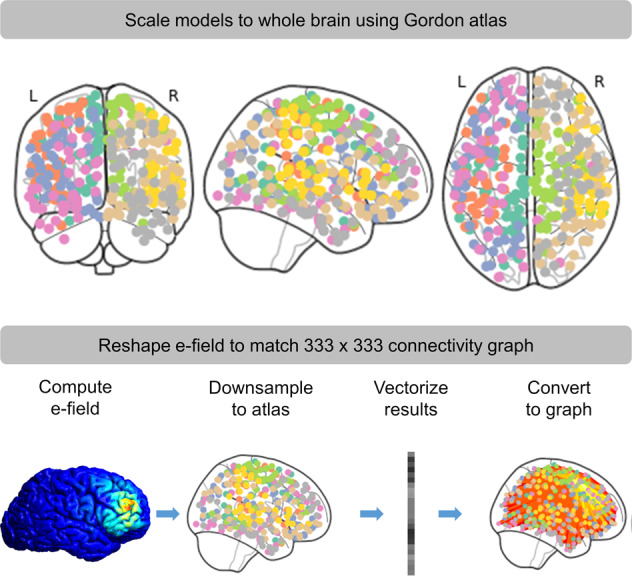
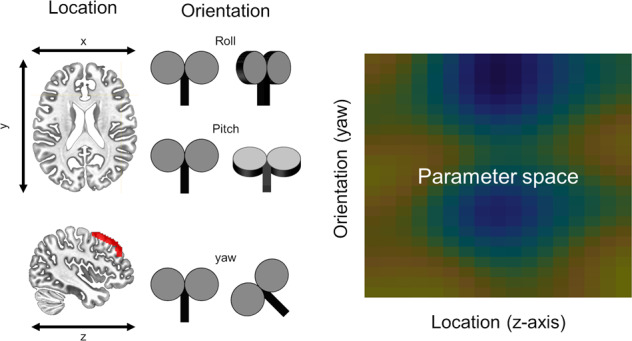
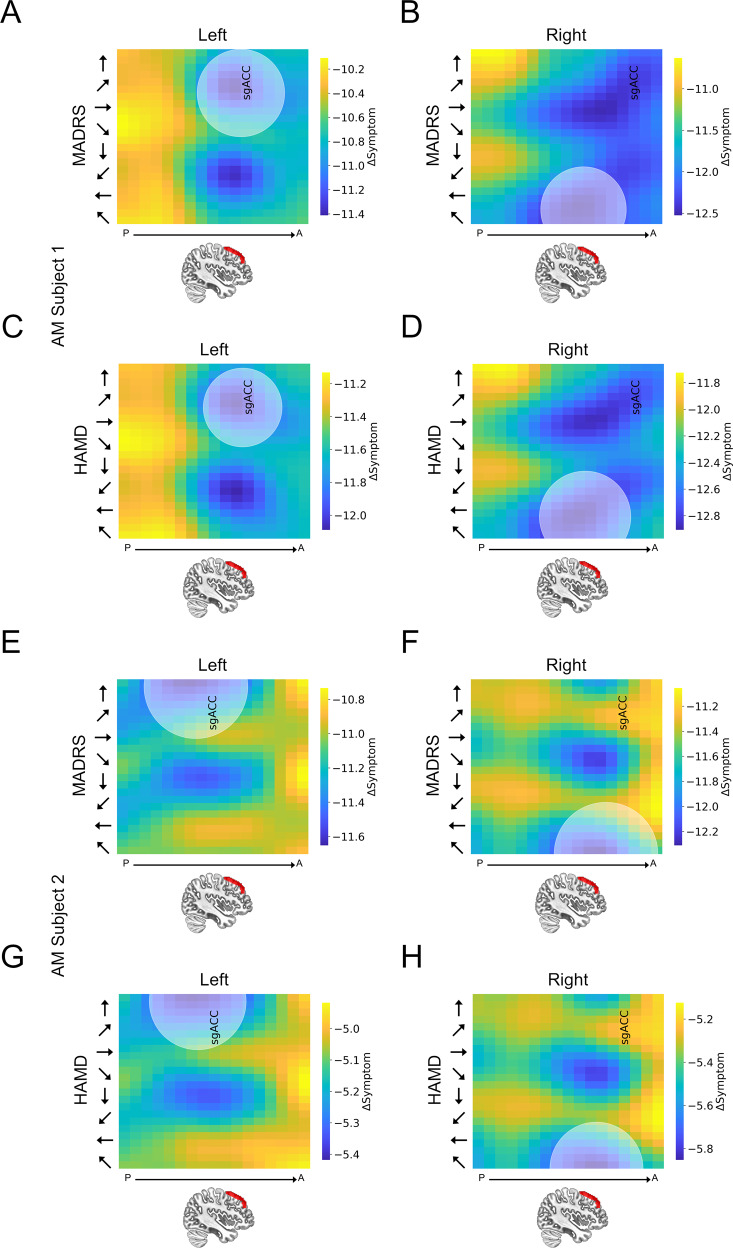
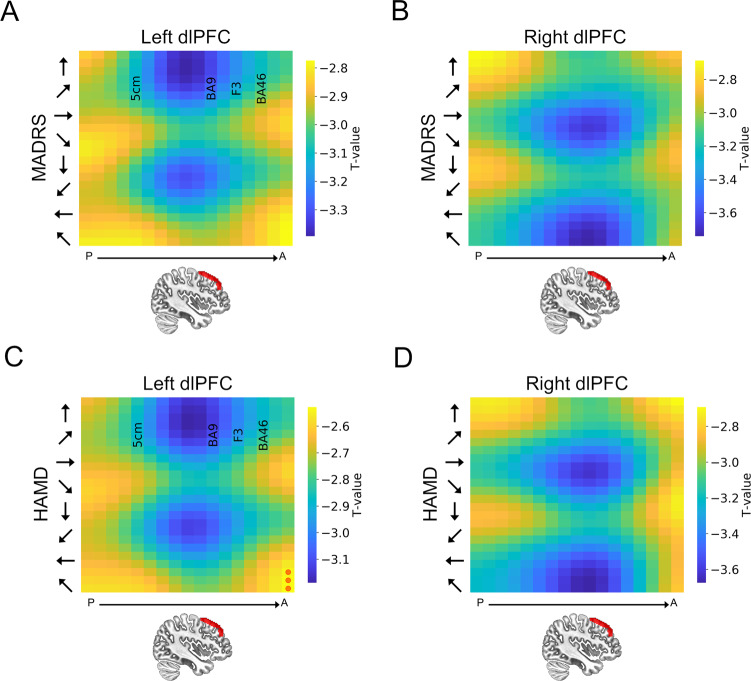
Resting state functional connectivity (rsFC) offers promise for individualizing stimulation targets for transcranial magnetic stimulation (TMS) treatments. However, current targeting approaches do not account for non-focal TMS effects or large-scale connectivity patterns. To overcome these limitations, we propose a novel targeting optimization approach that combines whole-brain rsFC and electric-field (e-field) modelling to identify single-subject, symptom-specific TMS targets. In this proof of concept study, we recruited 91 anxious misery (AM) patients and 25 controls. We measured depression symptoms (MADRS/HAMD) and recorded rsFC. We used a PCA regression to predict symptoms from rsFC and estimate the parameter vector, for input into our e-field augmented model. We modeled 17 left dlPFC and 7 M1 sites using 24 equally spaced coil orientations. We computed single-subject predicted ΔMADRS/HAMD scores for each site/orientation using the e-field augmented model, which comprises a linear combination of the following elementwise products (1) the estimated connectivity/symptom coefficients, (2) a vectorized e-field model for site/orientation, (3) rsFC matrix, scaled by a proportionality constant. In AM patients, our connectivity-based model predicted a significant decrease depression for sites near BA9, but not M1 for coil orientations perpendicular to the cortical gyrus. In control subjects, no site/orientation combination showed a significant predicted change. These results corroborate previous work suggesting the efficacy of left dlPFC stimulation for depression treatment, and predict better outcomes with individualized targeting. They also suggest that our novel connectivity-based e-field modelling approach may effectively identify potential TMS treatment responders and individualize TMS targeting to maximize the therapeutic impact.


Conflict of interest statement

The authors declare no competing interests.

Figures

Fig. 1
Fig. 1. The PCA-Regression data reduction approach used to summarize the relationship between symptoms and connectivity in the current model.
A Resting state functional connectivity (rsFC) is calculated using Pearson’s correlation across all subjects for all regions in the Gordon atlas [49]. B A principal component analysis (PCA) is used to identify orthogonal components in the rsFC data, and a geometric approach is used to identify a minimal number of components that explain a maximal proportion of the variability. C Component scores for the selected components are extracted and entered into a multiple linear regression to predict symptoms (D). The PCA loadings from the selected components (E) are combined with the coefficient vector from the regression (F) using matrix multiplication to create the output vector (G), which is used to represent multiple regression coefficients projected into the rsFC feature space. Network Color key: DMN = Default Mode Network; CP = CinguloParietal; VIS = Visual; FPN = FrontoParietal Network; DAN = Dorsal Attention Network; VAN = Ventral Attention Network, SN = Salience Network, CO = CinguloOpercular, SMh = SomatoMotor (hand), SMm = SomatoMotor (mouth), AUD = Auditory, RST = RetrosplenialTemporal, UN = Unassigned nodes.
Fig. 2
Fig. 2. Methods used to summarize electric (e)-field models in connectivity space.
Normalized e-field models were first downsampled to the Gordon atlas [49]. The results were then converted to a 1 × 333 vector. This vector was then used to form a 333 × 333 matrix where the values in the matrix represent the average current induced in the ROIs for each connection.
Fig. 3
Fig. 3. Iteration of model across site and orientation.
To understand how placement and orientation of the TMS coil might impact symptoms, we computed our model across multiple sites and orientations. Sites were defined at equally spaced points along the anterior to posterior axis of the middle frontal gyrus. Roll and pitch were defined orthogonal to the scalp at each stimulation site. Multiple equally spaced yaw vectors were defined at each stimulation site, representing all possible coil orientations. Electric (e)-field models were conducted at each site/orientation combination, entered into our symptom prediction model, and the results were plotted in this site × orientation heatmap.
Fig. 4
Fig. 4. Individual subject heatmaps plotting dlPFC predictions for the anxious misery group.
A, C, E, G Heatmaps representing the predicted MADRS and HAMD scores following a hypothetical course of TMS treatment to the left dlPFC. B, D, F, H Heatmaps representing the predicted MADRS/HAMD scores following a hypothetical course of TMS treatment to the right dlPFC. Colors represent the predicted change in MADRS/HAMD scores. Y-axis represents coil orientation. X-axis represents location along the Z-axis of the middle frontal gyrus. The center point of the shaded circle on the heatmaps represents the site and orientation of stimulation predicted to have the maximal reduction in symptoms for each subject. The area of the shaded circle represents the variability (i.e., Euclidean distance [95% confidence interval]) in this optimal site assessed using bootstrapping. sGACC = site along vector with maximal anti-correlation with the subgenual anterior cingulate cortex.
Fig. 5
Fig. 5. Group-level heatmaps plotting dlPFC predictions for the anxious misery group.
A Heatmap representing the predicted MADRS scores following a hypothetical course of TMS treatment to the left dlPFC. B Heatmap representing the predicted MADRS scores following a hypothetical course of TMS treatment to the right dlPFC. C Heatmap representing the predicted HAMD scores following a hypothetical course of TMS treatment to the left dlPFC. D Heatmap representing the predicted HAMD scores following a hypothetical course of TMS treatment to the right dlPFC. Y-axis represents coil orientation. Red circles represent sites where the change in MADRS/HAMD scores was not statistically different from 0. 5 cm = Site in vector corresponding to the 5 cm rule target commonly used in therapeutic applications for depression [38]. BA9 = Site in vector corresponding to Broadmann area 9 [38]. F3 = Site in vector closest to the BEAM/F3 target commonly used in therapeutic applications for depression [48]. BA46 = Site in vector corresponding to Broadmann area 46 [38].

References

    1. American Psychiatric Association. Anxiety disorders. In Diagnostic and statistical manual of mental disorders (5th ed.). Arlington VA (2013). 10.1176/appi.books.9780890425596.dsm05.
    1. Scott KM, de Jonge, P, Stein DJ & Kessler RC Mental disorders around the world: Facts and figures from the WHO World Mental Health surveys. Mental Disorders Around the World: Facts and Figures from the WHO World Mental Health Surveys (2018). 10.1017/9781316336168
    1. Cipriani A, Furukawa TA, Salanti G, Chaimani A, Atkinson LZ, Ogawa Y, et al. Comparative efficacy and acceptability of 21 antidepressant drugs for the acute treatment of adults with major depressive disorder: a systematic review and network meta-analysis. Lancet. 2018;391:1357–66. - PMC - PubMed
    1. McClintock SM, Reti IM, Carpenter LL, McDonald WM, Dubin M, Taylor SF, et al. Consensus recommendations for the clinical application of repetitive transcranial magnetic stimulation (rTMS) in the treatment of depression. J Clin Psychiatry. (2018). 10.4088/JCP.16cs10905 - PMC - PubMed
    1. Conelea CA, Philip NS, Yip AG, Barnes JL, Niedzwiecki MJ, Greenberg BD, et al. Transcranial magnetic stimulation for treatment-resistant depression: naturalistic treatment outcomes for younger versus older patients. J Affect Disord. (2017). 10.1016/j.jad.2017.03.063 - PMC - PubMed

Publication types

MeSH terms